Cross-Functional Flowchart
Being director and delegating your power it’s always important to observe those who are responsible for their tasks. Using Cross-Functional Flowcharts for depicting each of your employees’ work with the help of ConceptDraw DIAGRAM is fast and simple as always! Schematic drawing is perfect for visualizing operations of your business process flow watching all responsible people from each of the existing departments as well as all operations at once.
Diagram relationships between your business process and those who have to make it work smoothly by making horizontal and vertical flowcharts, such as top-down flowcharts, flow process charts, work flow and block diagrams, state change charts, and process maps. Find out how to make your own flowcharts using already existing examples and layouts for doing that easily and in the short term. Take it easy as you can make your business work by spreading the right people all over departments and make sure they do their job with the help of our software which soon will become your best assistant!

Cross-Functional Flowcharts
Cross-Functional Flowchart Definition
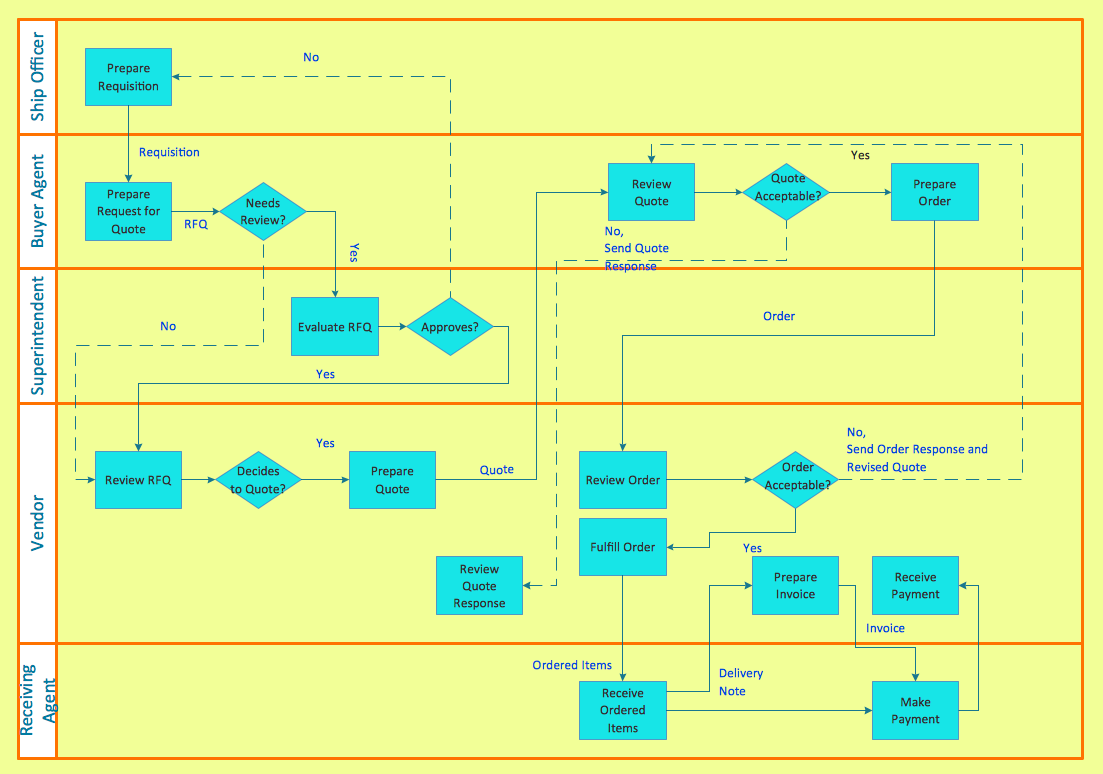
When a flowchart describes a process in which a number of different people, departments, or functional areas are involved, it is sometimes difficult to keep track of who is responsible for each step. A useful additional technique for tracking this and for analyzing the number of times a process is 'handed over' to different people, is to divide the flowchart into columns. Head up each column with the name of the person or function involved in the process and each time they carry out an action, show it in their column. This is illustrated in the flowchart below which covers a simple purchasing process. It shows how control of the process passes from the person initiating the purchase to the Purchasing Dept. and then to the Supplier.
A Process Flow Diagram presents the relationships with components in the schematic drawings. Use Cross-Functional Flowcharts to show the relationship between a business process and the functional units (such as departments) responsible for that process. Bands represent the functional units. Shapes representing steps in the process are placed in bands that correspond to the functional units responsible for those steps.
ConceptDraw DIAGRAM Cross Functional Flowchart Software
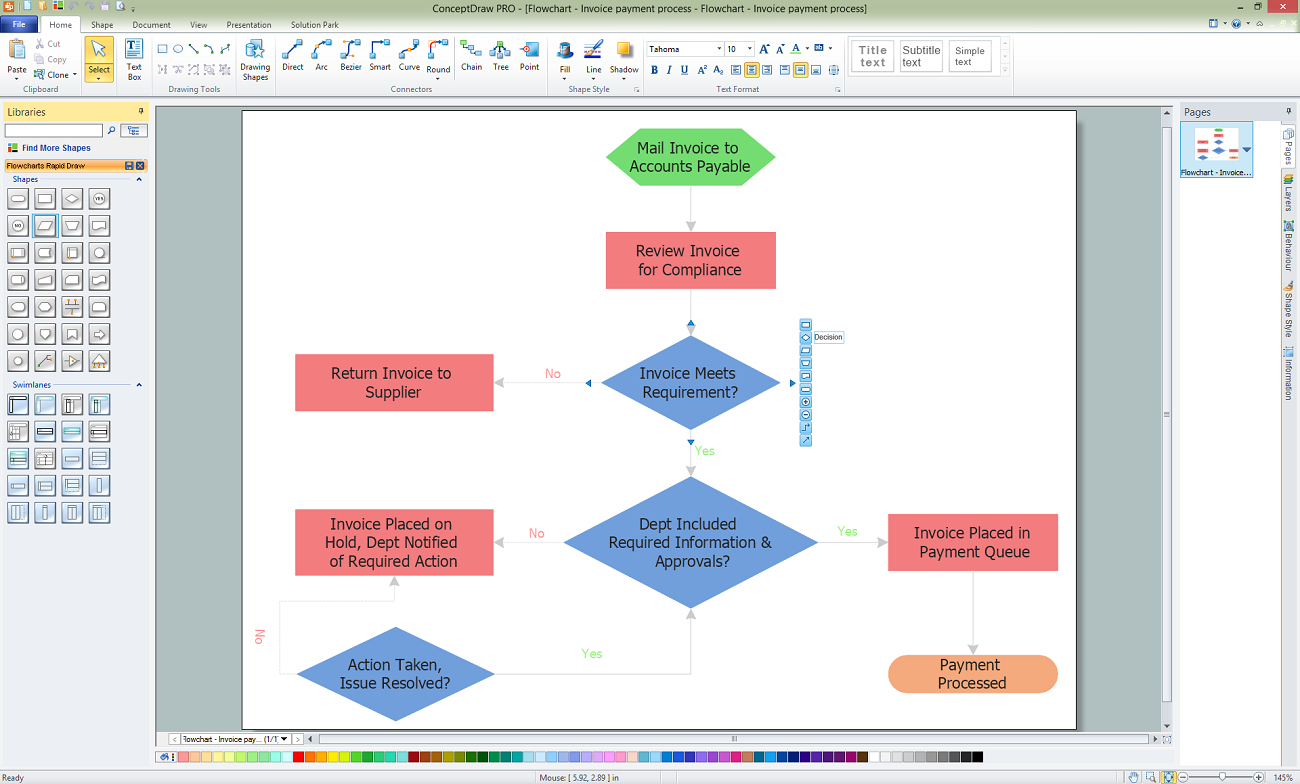
Cross-functional flowchart software helps you to visualize and communicate the operations of a business process flow step-by-step, with responsible people or departments for each operation. Professional flowchart maker ConceptDraw DIAGRAM includes a wide range of flowchart symbols for that. It also includes a collection of pre-made samples and templates.

Pic. 1. Cross Functional Flowchart Software
Cross Functional Flowchart Template
A set of predesigned quick-start templates is included in the Cross-functional Flowcharts solution. These Cross-Functional Flowchart templates are available for ConceptDraw users in two locations: from the ConceptDraw DIAGRAM application and from the ConceptDraw STORE.
The essential purpose of the pre-made templates is to simplify the process of creating flowcharts and help you diagram the relationship between a business process and the responsible party. ConceptDraw DIAGRAM supports both horizontal and vertical Cross-Functional flowcharts.
Should My Flow Chart Be Vertical or Horizontal
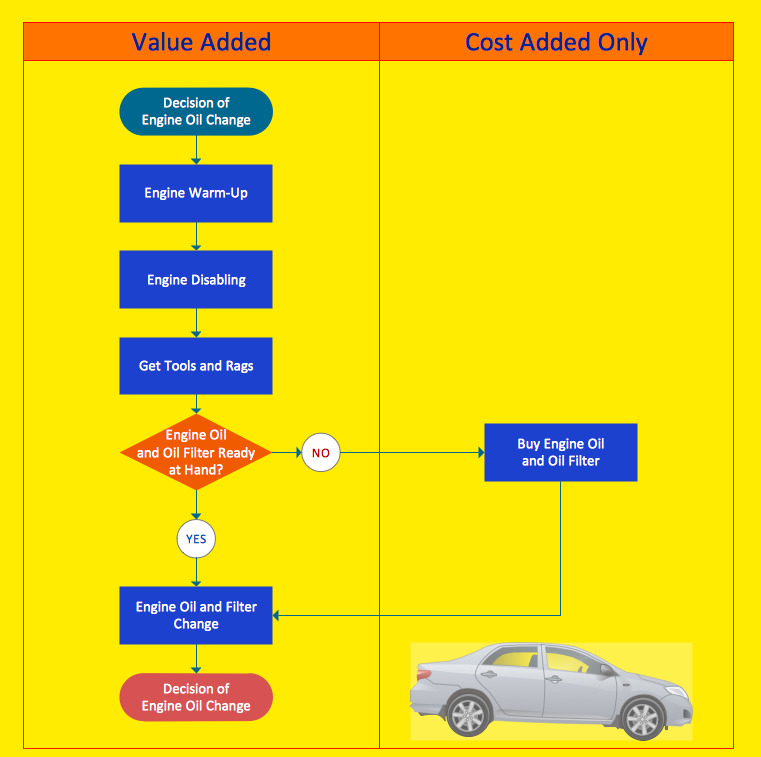
You can present any cross-functional process either vertically or horizontally. A vertical layout places slightly more emphasis on the functional units while a horizontal layout emphasizes the process. The orientation option you choose often depends on personal taste, rather than a strict requirement or guideline. You can also choose the number of bands that appear in the diagram when you create it. The best practice is to create enough bands to hold each step of the process you want to document.
|
Flowchart type |
Sample |
Purpose |
|
Cross-Functional Flowchart Horizontal |
|
In a horizontal layout, bands representing functional units run horizontally across the drawing page, highlighting the process. |
|
Cross-Functional Flowchart Vertical |
|
In a vertical layout, bands representing the functional units run vertically from the top to the bottom of the page, highlighting the functional units. |
What is the Difference Between Deployment Flowcharts & Cross-Functional Flowcharts
As far as I have seen, there is no significant difference between both. Actually, deployment flowcharts and cross-functional flow-charts seem to be two synonyms for the same concept, otherwise referenced in one paper as a "Process Map". Diagrammatically, Deployment chart diagrams seem to me more like UML Activity diagrams with Swim lanes (if you're familiar with UML you'll immediately understand what I mean). In other words, deployment diagrams are flowcharts that focus on showing "who does which activity". I've came across a definition that says "A Deployment Flowchart shows the actual process flow and identifies the people or groups involved at each step.
This type of chart shows where the people or groups fit into the process sequence, and how they relate to one another throughout the process." I also came across a paper that identifies both as being the same: "The process map-otherwise known as a cross-functional flowchart or deployment chart-is an excellent tool for clearly displaying process flows across organizational boundaries and identifying delays, repetitive steps, excessive control points, specialized tasks, and potential points of process failure." So, I believe it is plausible to assert that cross-functional charts and deployment charts both refer to the same concept.
Cross-Functional: display the workflow and the functional positions who are involved with each step in the workflow

Pic. 2. Cross-Functional Flowchart — Business Process
Create diagrams that illustrate the relationships between process and departments in the organization.
Cross Functional Flowchart: the tools
Most people associate process mapping with basic flowcharting. However, we actually use six different process mapping tools to help companies improve processes:
- Top-down flowchart
- Block diagram (decision tree or logic diagram)
- Flow process chart
- Work flow diagram
- Process map
- State change chart
The process map-otherwise known as a cross-functional flowchart or deployment chart-is an excellent tool for clearly displaying process flows across organizational boundaries and identifying delays, repetitive steps, excessive control points, specialized tasks, and potential points of process failure.
Building a process map is easy but the results may appear complex if many steps and players are involved. Begin by listing all process players (people or departments) down the left side of a sheet of paper. Separate each player with a horizontal line. Use a double line if the player is from outside your organization. The bottom access is time, moving left to right.
Write the first process step next to the name of the player who performs that task. If you'd like, you may draw a box around this description. Move from left to right as time elapses. Write and box the second process step on the appropriate row. Connect the two steps with a line. Continue to the right documenting each activity on the appropriate row. Any concurrent activities should be aligned vertically. When you are done, the "as is" process will be clearly documented. It can then be analyzed and improved.
Analyzing Cross-Functional Flowchart
A process can be an enlightening yet shocking experience. Processes typically evolve over time as people and business conditions change. The result is unneeded layers of complexity and inspection. Your first reaction may be, "Is that really what we do?"
Your second reaction will be to fix the process. Here's a list of what you should look for: Non-value added steps. Challenge each process step. Ask yourself, "What value does this activity add? Does our customer care?" Combine, simplify or eliminate activities that do not contribute value.Excessive control points. Inspections and supervisor approvals do not always add value. They evolve primarily due to a lack of confidence in the process. Eliminate control steps that are not critical for quality outcomes.
Excessive handoffs. Every time process activities move from one player to the next, there is potential for delay or miscommunication. Try to organize work so that each player becomes more of a generalist and less of a specialist. This will reduce the complexity of multiple handoffs.
Task specialization. Assembly line processing is giving way to cellular models for organizing work groups or teams, both on the plant floor and administrative offices. Information flows faster, with less distortion, improving both the quality and speed of work. Consolidate tasks where possible.
How to Create a Cross-Functional Flowchart
Using a Cross-Functional flowchart is a clear way of showing each team member’s responsibilities and how processes get shared or transferred between different teams and departments.
The ability to create Cross-functional diagrams is provided by the Cross-Functional Flowcharts solution. Open the ConceptDraw STORE, select the Cross-Functional Flowcharts solution and click “Install”. This solution extends ConceptDraw DIAGRAM with 2 libraries that contain 45 vector objects that can be used when representing the transferring of data, documents, and tasks during performance of a work process.
- Before creating a flowchart, click the Chain button
 (Win),
 (Mac)
on the toolbar.
(Mac)
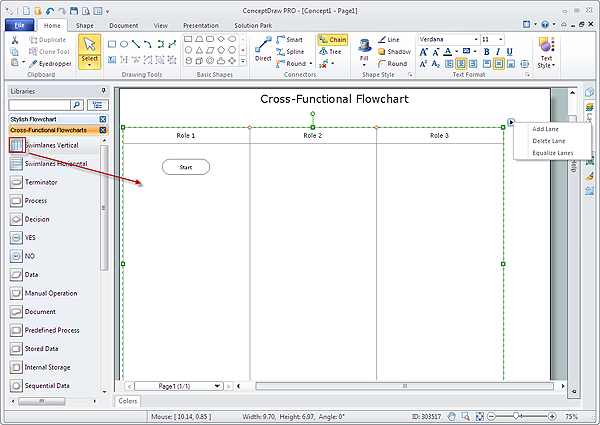
on the toolbar. - Drag the Swim Lanes Vertical object from the Cross-Functional Flowchart library to the document’s page.
- When releasing the mouse button, the object automatically resizes according to the page size. The Action button
 allows you to easily add lanes and then equalize them.
- Add the shapes to the diagram from the Cross-Functional Flowchart library. They appear on the flowchart as connected objects.
- Next add text to the diagram and format the objects.
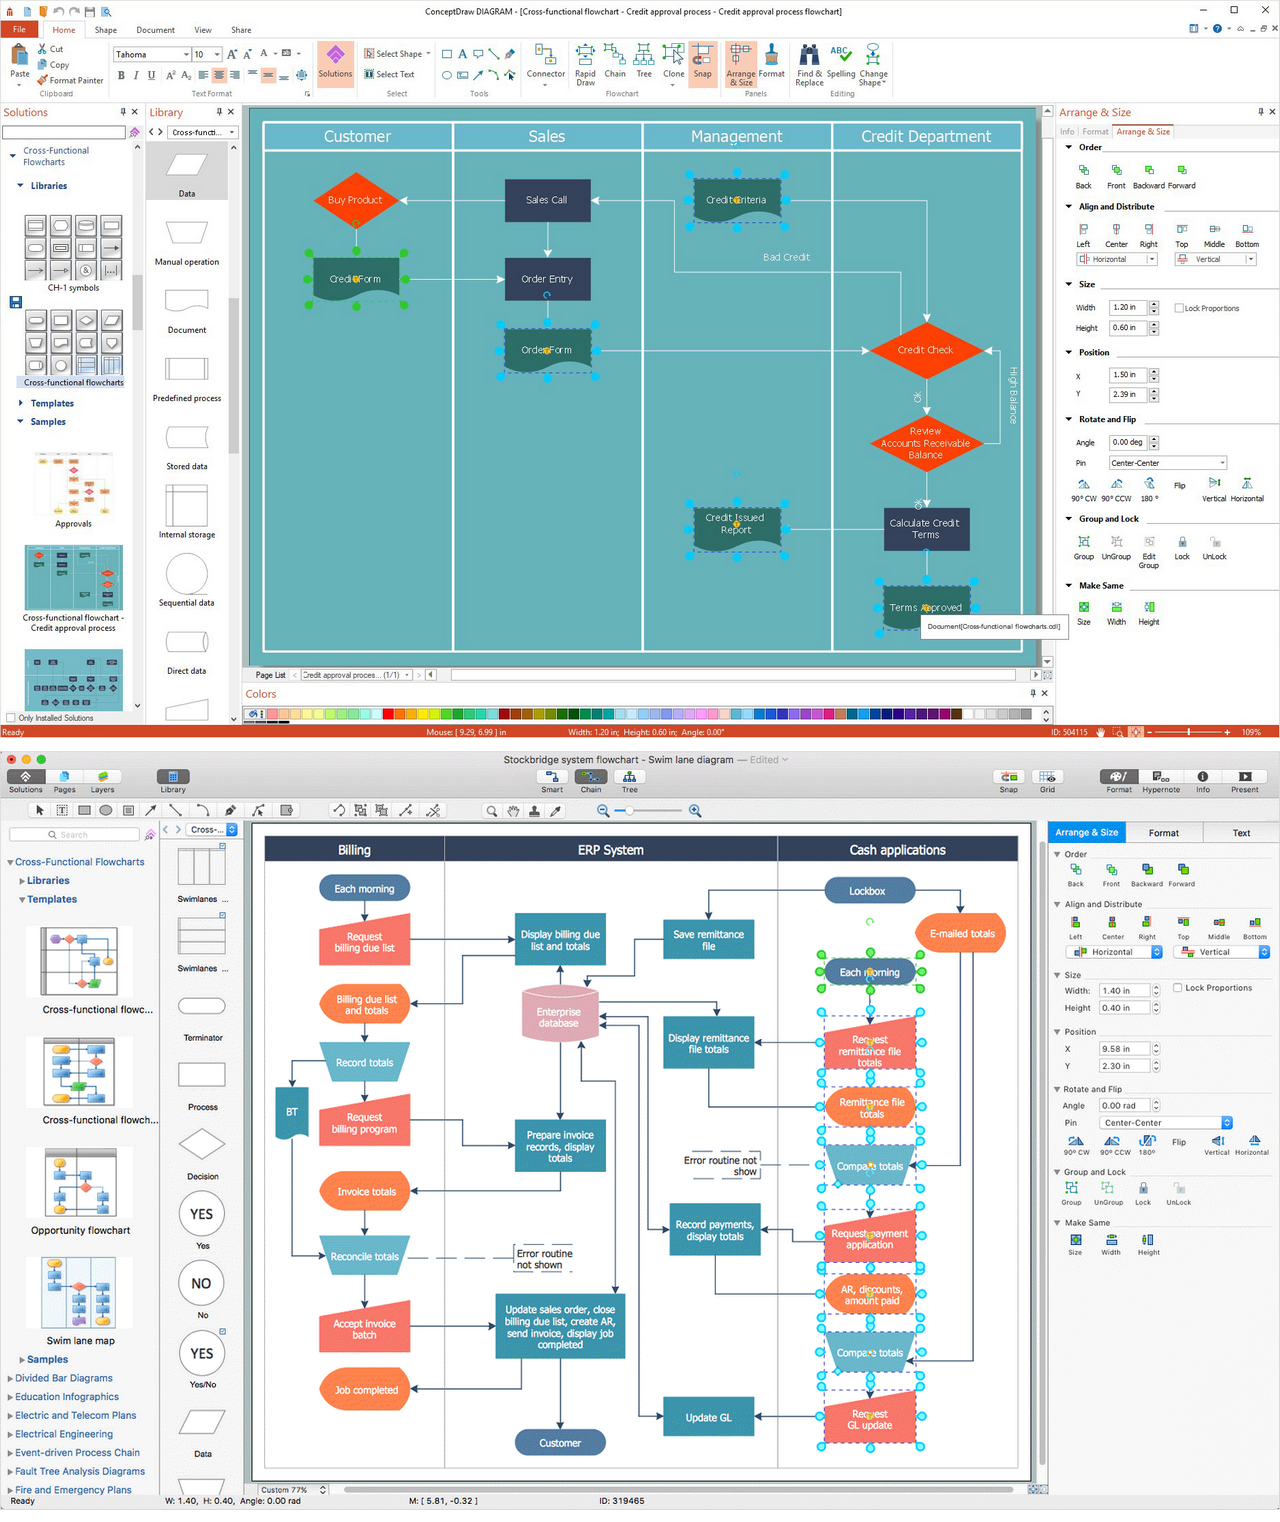
Result: Cross-Functional Flowchart (macOS and Windows)
All source documents are vector graphic documents. They are available for reviewing, modifying, or converting to a variety of formats (PDF file, MS PowerPoint, MS Visio, and many other graphic formats) from the ConceptDraw Solution Park. The Cross-Functional Flowcharts Solution is available for all ConceptDraw DIAGRAM users. The flowchart maker of ConceptDraw DIAGRAM - Drawing Software for Cross Functional Flowchart.