Made with
ConceptDraw
DIAGRAM 18

Data Flow Diagram

Data Flow Diagram (DFD) is the part of the SSADM method (Structured Systems Analysis and Design Methodology), intended for analysis and information systems projection. Data Flow Diagrams are intended for graphical representation of data flows in the information system and for analysis of data processing during the structural projection. By means of data flow diagrams, it is possible to show visually the work of the information system and the results of this work. Data Flow Diagram visualizes processes, data depositories, and external entities in information systems and data flow connecting these elements.

Data Flow Diagram consists of the following components:

  • Processes and functions which represent actions that happened in the information system;
  • External entities which represent in the system data ingoing and outgoing from it;
  • Data depositories which represent places in the system where data can be saved for a definite period of time;
  • Data flows, indicating the direction and character of data flowing in the considered information system.

Diagram element Graphical presentation
Process
External Entity
Data Store
Data Flow

This variant of presentation of Data Flow Diagram objects got the name of Yourdon – de Marco notation.

Objects of Data Flow Diagrams are interpreted in the following way:

  • Processes transform input data flows into output data flows;
  • Data depositories serve only for the keeping of ingoing data and do not change them;
  • Data flows changes in external entities do not considered.

Every diagram object should have a name. Each data flow is denoted with an indication of transferred data and with the possibility of an indication of the format of these data. Data Flow Diagram should not involve more than 10 objects, excluding arrows, representing data flows. In the case of a more complicated system, the totality of several objects (as a rule, processes) is united and represented on the diagram in the form of one object. This complicated compound object is presented in the form of a separate flow diagram. Each component has a number, at this, diagrams illustrating compound objects are numerated starting from the number of an object which they describe. For example components of the diagram of the description of an object with number 5 will be enumerated 5.1, 5.2, etc. Generally, Process Flow Diagram depicts just the major equipment without details.

For clearness, there is a possibility to duplicate notations of used data depositories and external entities. Processes can’t be duplicated. For example, if one the same data depository is used in several different processes it is better to duplicate it on the diagram but not to create several intricate data flow arrows from one object to several processes. This concerns external entities as well. Duplicates of data depositories are marked with the double line from the left side, external entities duplicates - with the asterisk.

Data flow on the diagram can ramify and merge which implies branching or confluence of data in the information system.

Data Flow Diagram *

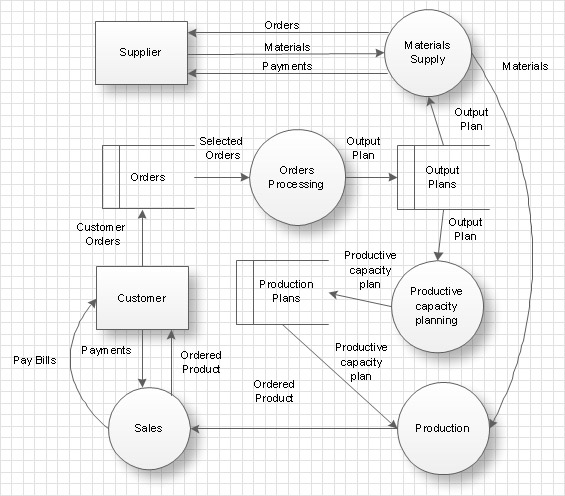
Example 1. Data Flow Diagram

Thus the information system is represented by a planner in the form of the high-level DFD in which objects are worked out in detail by diagrams of the lower level with the preset level of detailed elaboration. There is also another way of looking at which all events in the system are described at once and each event is represented in the form of process transforming data flows, further these sub runs are grouped for getting diagrams of the higher level.
process flow diagram

Example 2. Data Flow Diagram in ConceptDraw DIAGRAM

The following features make ConceptDraw DIAGRAM extended with Data Flow Diagrams Solution the best Data Flow Diagram software:

  1. You don't need to be an artist to draw professional-looking diagrams in a few minutes.
  2. Large quantity of ready-to-use vector objects makes your drawing diagrams quick and easy.
  3. A great number of predesigned templates and samples give you a good start for your own workflow diagram or process flow diagram.
  4. ConceptDraw DIAGRAM provides you the possibility to use the grid, rules, and guides. You can easily rotate, group, align, arrange the objects, use different fonts and colors to make your organizational workflow diagram exceptionally looking.
  5. All ConceptDraw DIAGRAM documents are vector graphic files and are available for reviewing, modifying, and converting to a variety of formats: image, HTML, PDF file, MS PowerPoint Presentation, Adobe Flash, MS Visio.
  6. Using ConceptDraw STORE you can navigate through ConceptDraw Solution Park, managing downloads and updates. You can access libraries, templates, and samples directly from the ConceptDraw STORE.
  7. If you have any questions, our free of charge support is always ready to come to your aid.


TEN RELATED HOW TO's:
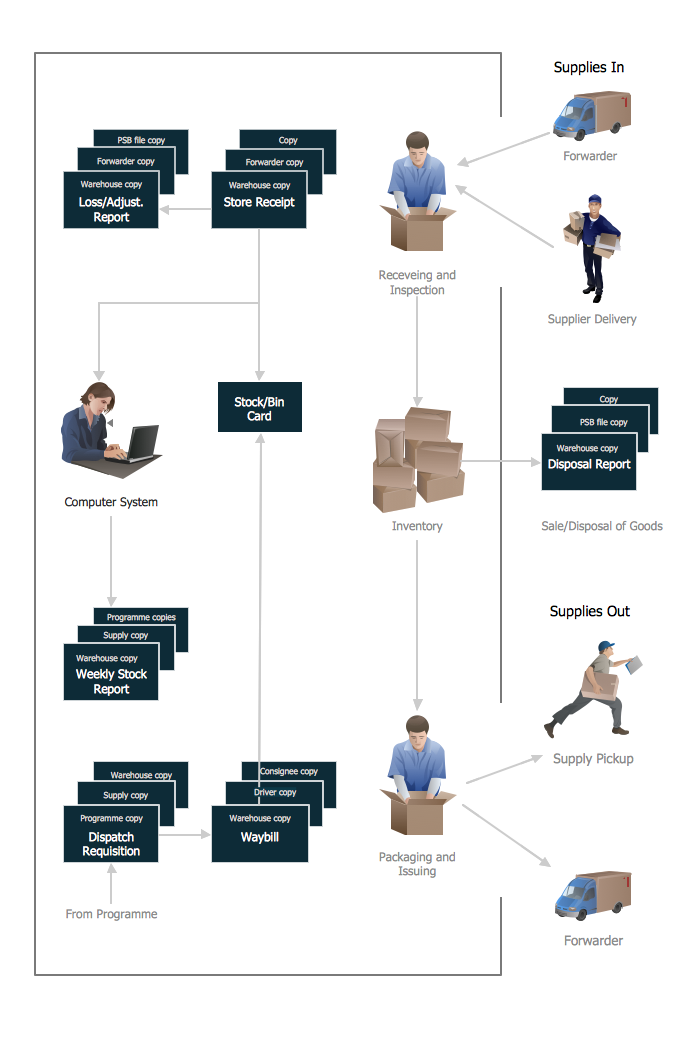
If you want to find a way to understand complex things in minutes, you should try to visualize data. One of the most useful tool for this is creating a flowchart, which is a diagram representing stages of some process in sequential order. There are so many possible uses of flowcharts and you can find tons of flow charts examples and predesigned templates on the Internet. Warehouse flowchart is often used for describing workflow and business process mapping. Using your imagination, you can simplify your job or daily routine with flowcharts. Warehouse flowcharts are used to document product and information flow between sources of supply and consumers. The flowchart provides the staged guidance on how to manage each aspect of warehousing and describes such aspects as receiving of supplies; control of quality; shipment and storage and corresponding document flow. Warehouse flowchart, being actual is a good source of information. It indicates the stepwise way to complete the warehouse and inventory management process flow. Also it can be very useful for an inventory and audit procedures.Warehouse Flowchart
Picture: Flow Chart Example: Warehouse Flowchart
Related Solution:
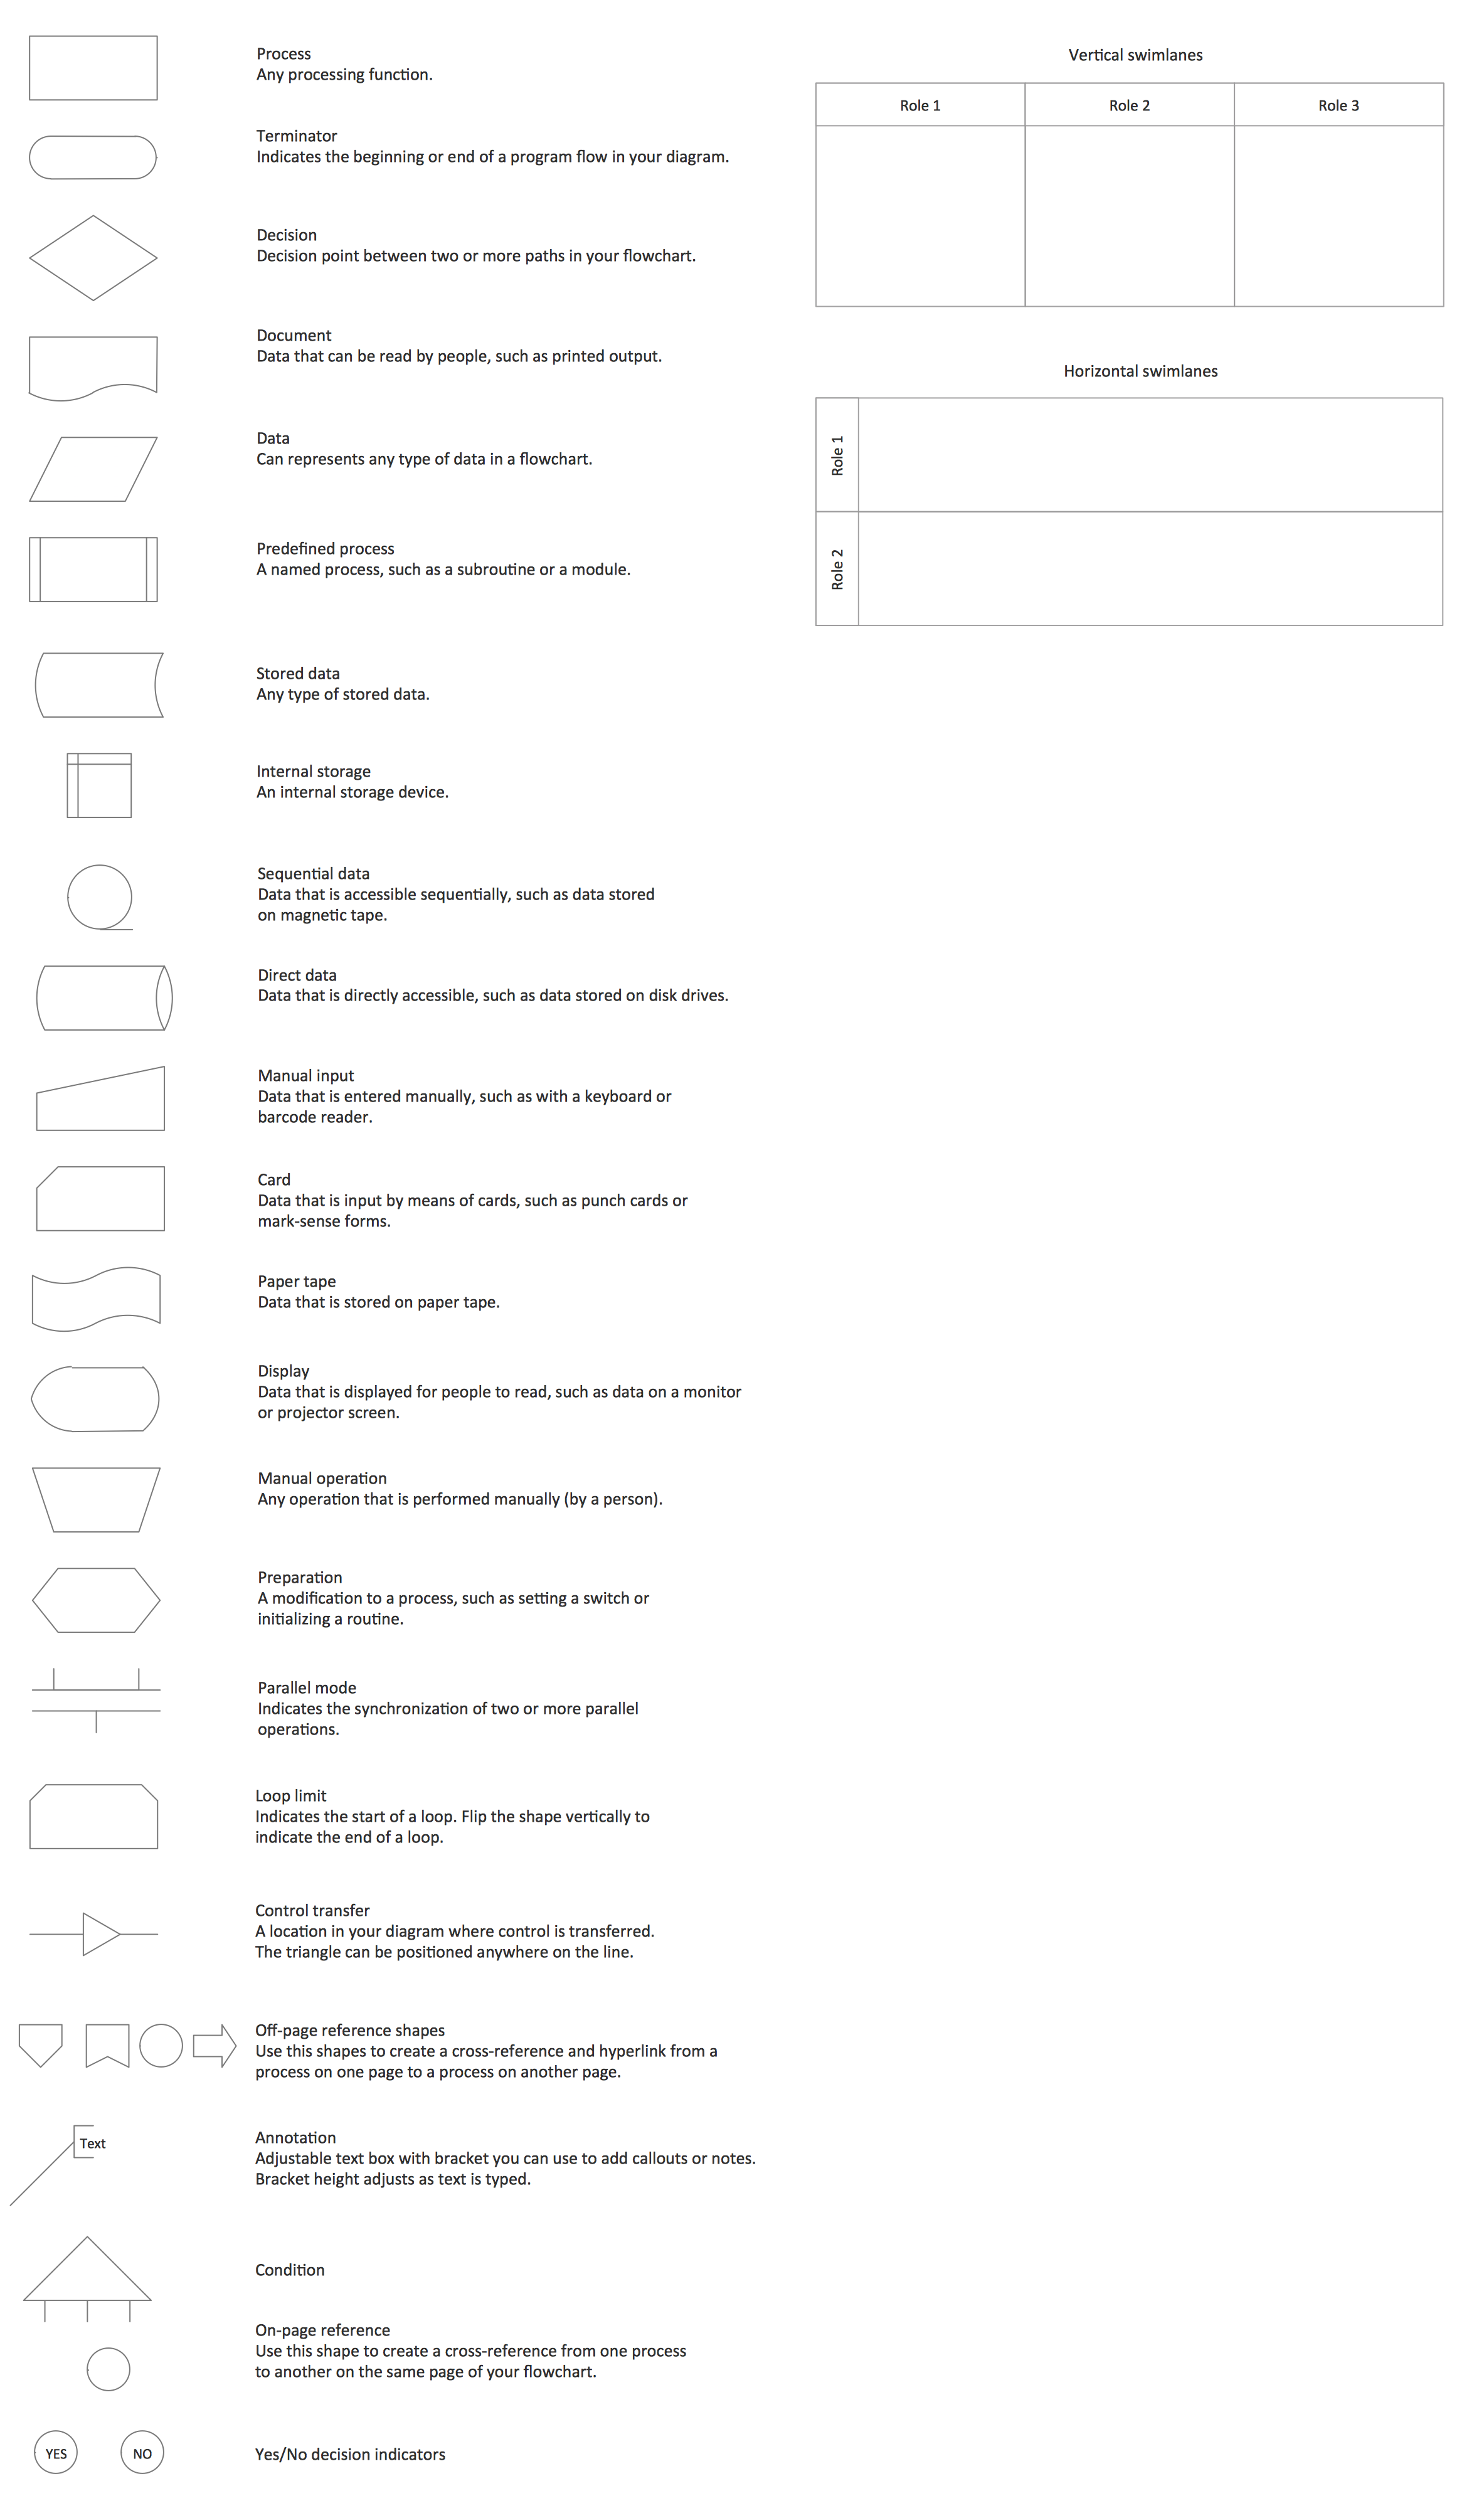
The excellent possibility to create attractive Cross Functional Flowcharts for step-by-step visualization the operations of a business process flow of any degree of detailing is offered by ConceptDraw’s Cross-Functional Flowcharts solution. The extensive selection of commonly used vector cross functional flowchart symbols allow you to demonstrate the document flow in organization, to represent each team member’s responsibilities and how processes get shared or transferred between different teams and departments.Cross Functional Flowchart Symbols *
Picture: Cross Functional Flowchart Symbols
Related Solution:
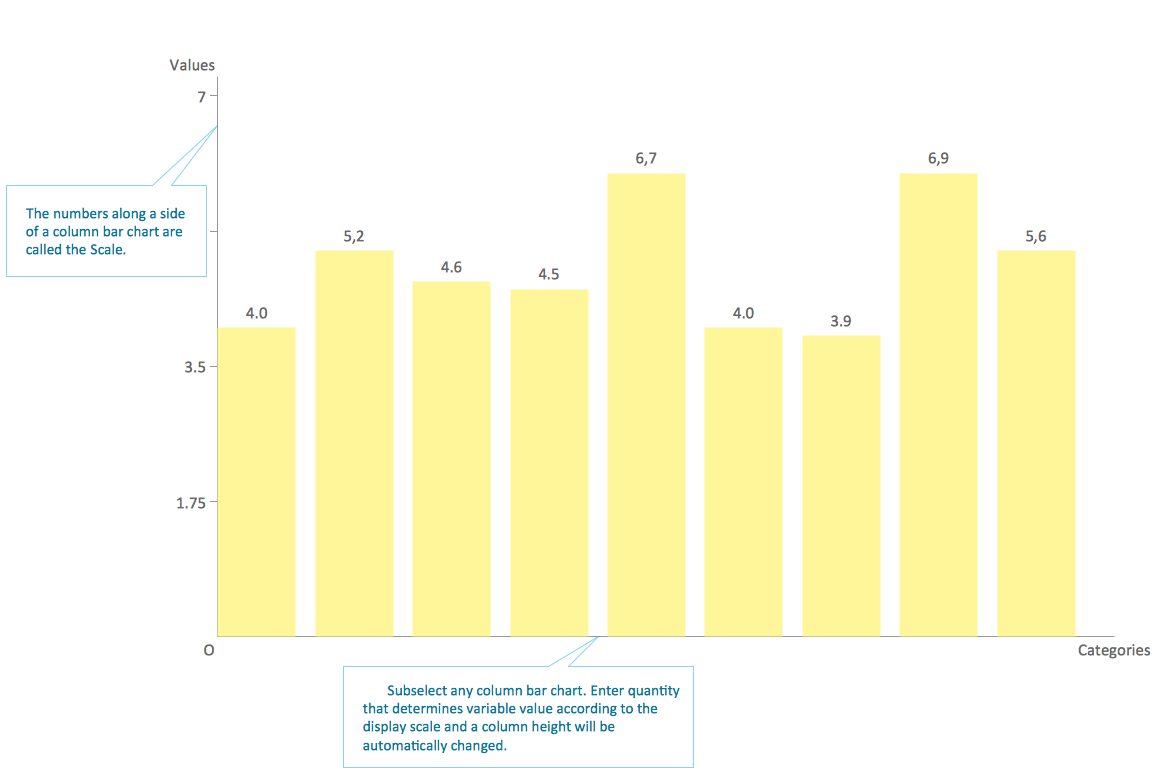
Any bar chart can be also called as a bar graph or a column chart or graph. Being a chart or a graph that is commonly used for presenting some categorical data with the rectangular bars having their lengths or heights proportional to the values that they represent, such drawings can be made with the help of the ConceptDraw DIAGRAM diagramming and drawing software. The created bars can be plotted either vertically or horizontally and any vertical bar chart can be also sometimes called as a line graph.Column Chart Template *
Picture: Column Chart Template
Related Solution:
SysML →
Systems Modeling Language (SysML) is a general-purpose modeling language for systems engineering applications. ConceptDraw DIAGRAM diagramming and vector drawing software was extended with SysML Solution from the Software Development Area of ConceptDraw Solution Park specially to help systems engineers design various model systems with SysML.SysML *
Picture: SysML
Related Solution:
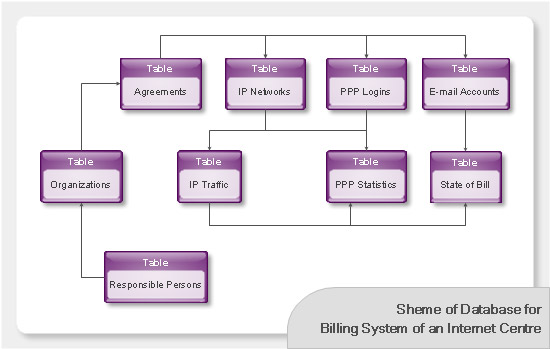
How-To-Guide/aom-dbDatabases Access Objects Model with ConceptDraw DIAGRAM  *
Picture: Databases Access Objects Model with ConceptDraw DIAGRAM
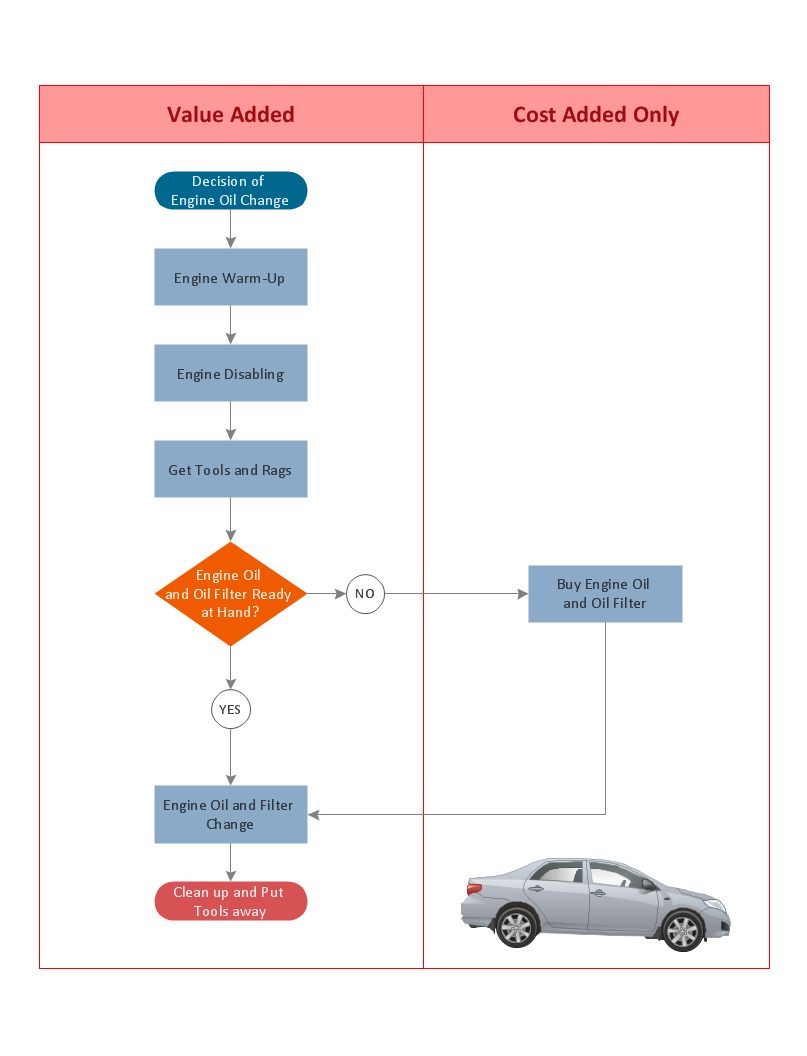
Start your business process mapping with conceptDraw DIAGRAM and its Arrows10 Technology. Creating a process map, also called a flowchart, is a major component of Six Sigma process management and improvement. Use Cross-Functional Flowchart drawing software for business process mapping (BPM). Use a variety of drawing tools, smart connectors and shape libraries to create flowcharts of complex processes, procedures and information exchange. Define and document basic work and data flows, financial, production and quality management processes to increase efficiency of you business.Cross Functional Flowchart for <br>Business Process Mapping *
Picture: Cross Functional Flowchart for Business Process Mapping
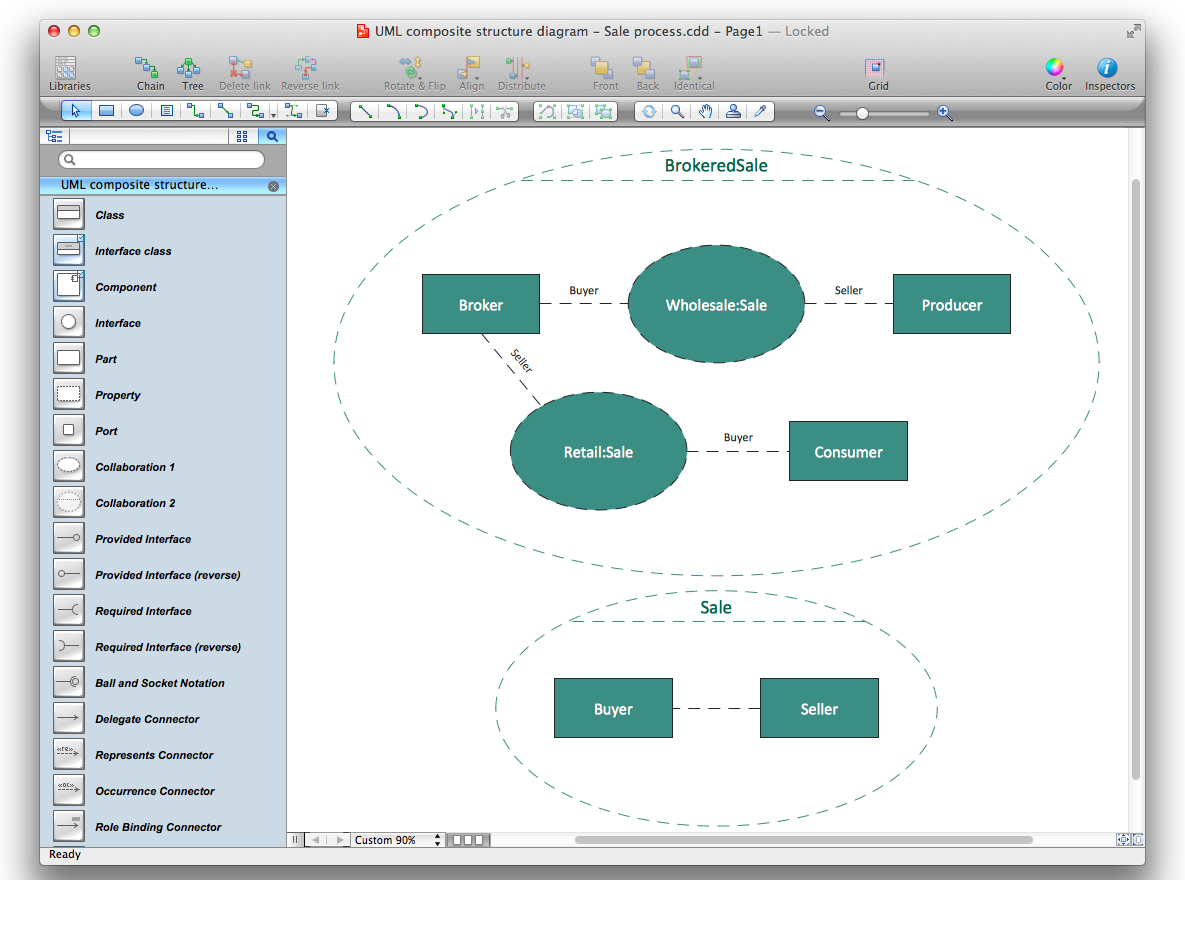
UML Composite Structure Diagram shows the internal structure of a class and the possible interactions at this structure.Diagramming Software for UML Composite Structure Diagrams *
Picture: Diagramming Software for UML Composite Structure Diagrams
Everything about Bookkeeping: Accounting flowchart process. Which symbols to use, how to make a chart.Introduction to bookkeeping: <br>Accounting flowchart process *
Picture: Introduction to bookkeeping: Accounting flowchart process
Related Solution:
Electrical plan is a document that is developed during the first stage of the building design. This scheme is composed of conventional images or symbols of components that operate by means of electric energy. To simplify the creation of these schemes you can use house electrical plan software, which will not require a long additional training to understand how to use it. You only need to install the necessary software ant it’s libraries and you’ll have one less problem during the building projection. Any building contains a number of electrical systems, including switches, fixtures, outlets and other lightening equipment. All these should be depicted in a building electrical plans and included to general building documentation. This home electrical plan displays electrical and telecommunication devices placed to a home floor plan. On the plan, each electrical device is referenced with the proper symbol. Electrical symbols are used for universal recognition of the building plan by different persons who will be working on the construction. Not all possible electric symbols used on a certain plan, so the symbols used in the current home plan are included to a legend. The electrical home plan may be added as a separate document to a complete set of building plans.House Electrical Plan Software
Picture: How To use House Electrical Plan Software
Related Solution:
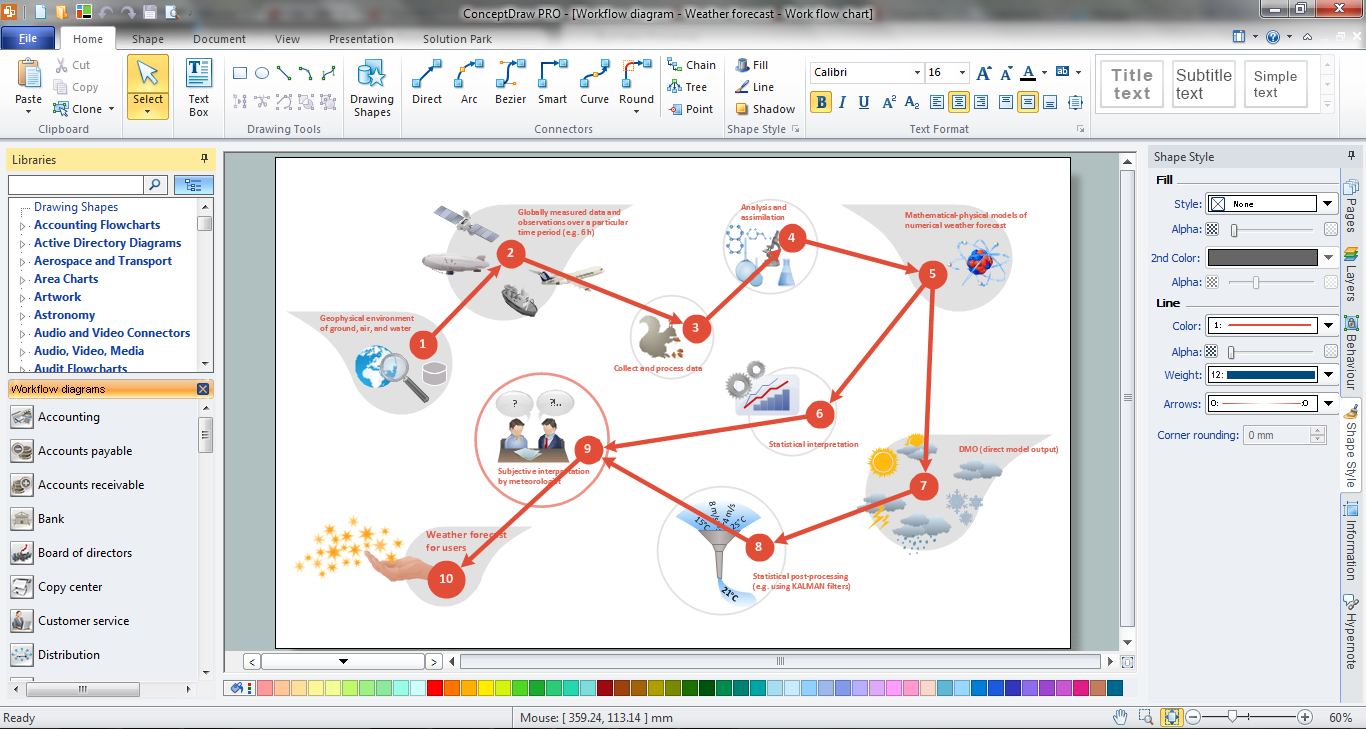
ConceptDraw DIAGRAM enhanced with Flowcharts Solution is the best flow chart maker online design software. Use it to ✔️ create clear and actionable Flowcharts, ✔️ improve decision-making, ✔️ enhance problem-solving in various scenarios, ✔️ enhance creativity and productivity across industries, ✔️ streamline workflowsFlow Chart Online
Picture: Flow Chart Online
Related Solution:
ConceptDraw
DIAGRAM 18