Made with
ConceptDraw
DIAGRAM 18

Data Flow Diagram (DFD)

Data flow diagrams (DFD)

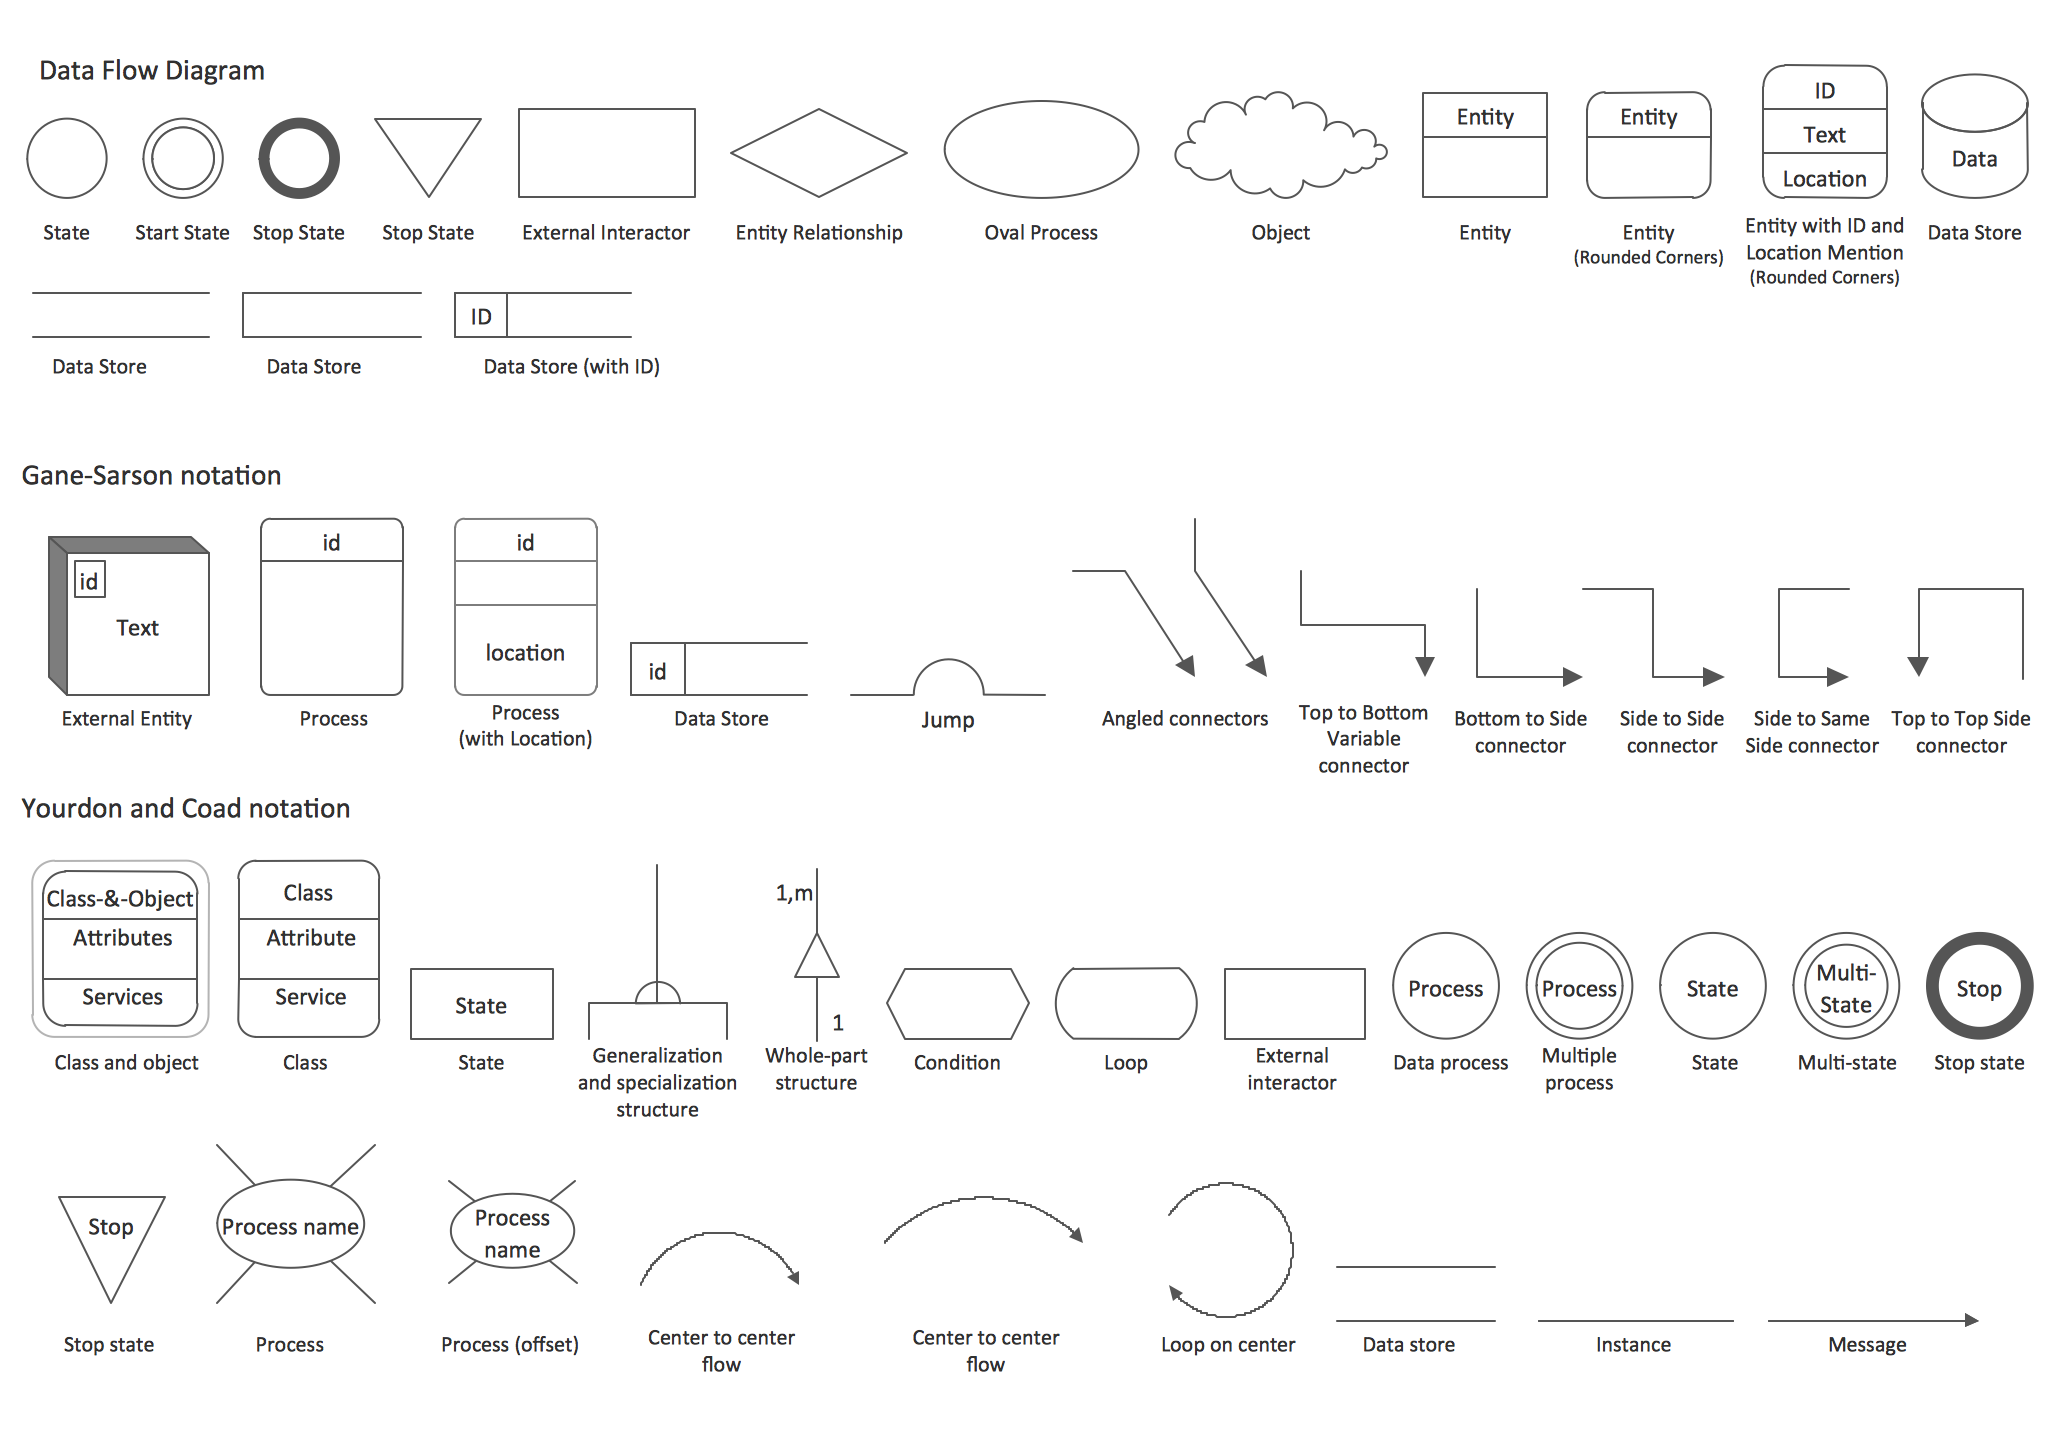
The Data Flow Diagrams solution from the Software Development area of ConceptDraw Solution Park provides the DFD templates, examples and libraries of vector stencils for drawing the DFDs according to either Gane and Sarson or Yourdon and Coad notation using the ConceptDraw DIAGRAM diagramming and vector drawing software.

“Flow Chart” is usually used for the purpose of illustrating a flow of some particular data and it includes the term of “data flow diagrams”. “Flow diagrams” can be “Unified Modelling Language” (or “UML”) diagrams, “Entity Relationship Diagrams” (or “ERD”), “Data Flows Diagrams” (or “DFD”), “Structured Systems Analysis and Design Method” (“SSADM”) or “Windows and Macintosh Graphics User Interface (GUI)” design diagrams. One of the most popular is a “data flow diagram”. “DFD” is simply a graphical representation of the "data flow" in an “information system”. With its help you can illustrate a system overview without going into details, but in outline.

The “data flow diagram” can also be used for the visualization and illustration of the data processing in a structured design. Any of the ConceptDraw DIAGRAM users can make any needed “data flow diagram” any time they want with a simplicity and in a very short period of time having the right solution especially. “Data flow diagrams” are popular for the reason: they show what particular kind of information can be input to as well as output from a system. They also show the way how this data, which has to be illustrated, can advance via this system. With the help of “data flow diagram” you can also show where this data can be stored.

These “data flow diagrams” are also known as “bubble charts”. The “context-level data flow diagram” includes a “Level 1 DFD”, which can be created for a purpose of showing some of the system details, which are being modelled. The “Level 1 data flow diagrams” show the way some system is or can be divided into the smaller “sub-systems”. They also allow to follow the way, in what each of these “sub-systems” deals with these “data flows”. “Data flow diagram” can also identify the internal data stores. These stores usually have to be presented in a way of such diagram.

“Data flow diagrams” are the ones of the three in total perspectives of the “SSADM”. The sponsor of the project and the end user can be consulted at each of the stages of a system's evolution and it is always convenient to tack this “evolution” with the aid of such DF diagram. Using this type of diagram, it is simpler to represent in what way this system can operate, what it accomplishes and how the plans for this system can be implemented. These diagrams can be also used for providing the end user with the information about the inputting data, in what the system can be developed both in analysis and design phases.

There are a few different notations, which you can use for drawing any of the needed data flow diagrams (for example, “Gane and Sarson”, “Yourdon and Coad” one). Use these notations to define the different visual representations for the data stores, data flows, external entities and different processes.

You can always make so-called “Logical Data Flow Diagram”, with the help of which you can capture the data flows, which are necessary for the system to operate. With this type of Data flow diagrams it is so simple to describe the needed processes as well as the data required. Another type of “Data flow diagrams” is so-called “Physical Data Flow Diagram”. With the help of this type you can show the way, in what some system is implemented at the moment and it is also known as a “Current Physical Data flow diagram”. Using it, it is also simple to show how the designer wants the system to look in the future: “Required Physical Data flow diagram”.

To sum up, “Data flow diagrams” are well known and commonly used for a reason of the need of representing some data flow in a system as a part of the “Structured Systems Analysis and Design Methodology”. These diagrams may consist of the different components (e.g., functions and processes), representing actions happened in an information system. All main “data flow diagram” elements are: processes, external entities, data flow and store (data store). “Yourdon – de Marco” notation can be used for illustration of the ”Data Flow Diagram” objects. These “objects” are interpreted in a way of processes transforming the input data flows into the output data flows as well as data depositories serving them only for keeping the “ingoing” data but no changing them; and “data flows” changes in external entities may not be considered.

In order to make any needed “flow chart” or “data flow diagram”, you need only to download ConceptDraw DIAGRAM software and start using it having very relaxing and entertaining process of creating any needed type diagrams, including those mentioned above. Using ConceptDraw DIAGRAM software as well as the needed solution from ConceptDraw STORE application, you can be sure that your final result will look simply great as well as professionally looking. The “Data Flow Diagrams Solution” will be very helpful for those ConceptDraw DIAGRAM users, who intend to make a great looking and smart diagrams, including the “data flow” ones. There is an “Object Library”, included in the “Data Flow Diagram Solution”. It contains lots of stencils, alongside all of the needed design symbols, such as icons, that can be used for representing data flows, processes, data storage, objects and other data flow entities.

Data Flow Diagram (DFD) Solution

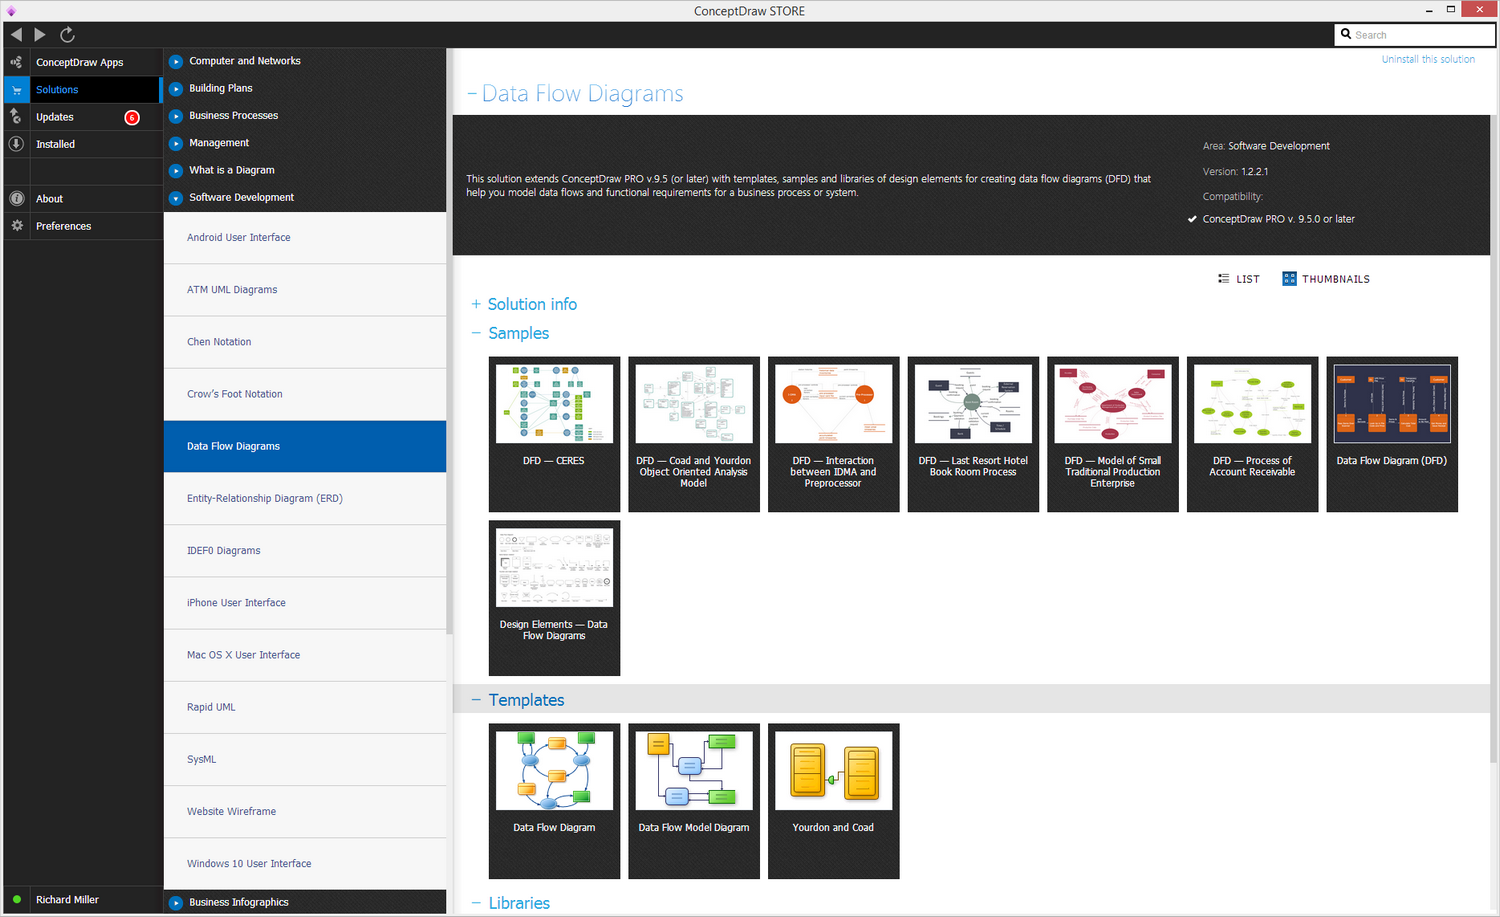
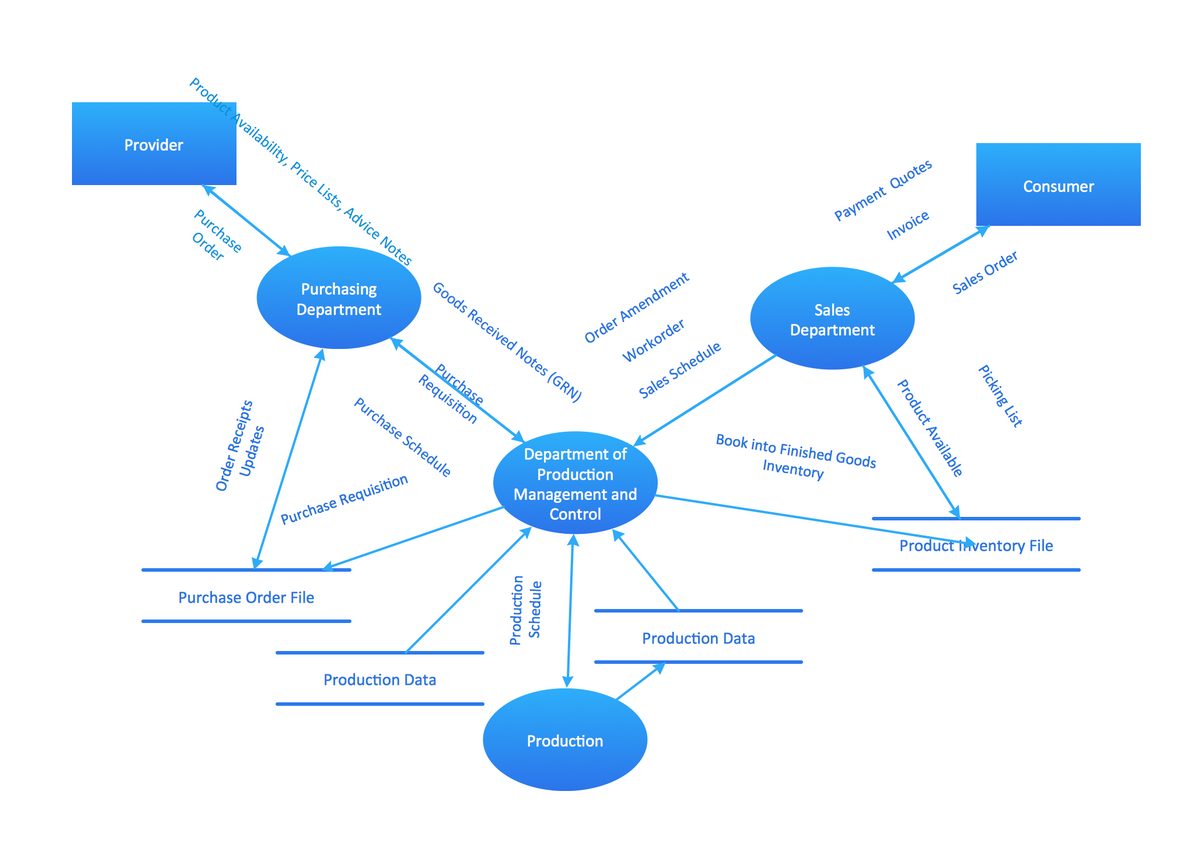
Example 1. Data Flow Diagrams (DFD) Solution

You can always use this “Data Flow Diagrams” solution, which can be found and downloaded from the Software Development area of ConceptDraw Solution Park on this site, or either from ConceptDraw STORE application (which can be also downloaded from this site) for drawing your own “context-level” and other DFDs while working in ConceptDraw DIAGRAM diagramming and vector drawing software. You will definitely find the “Data Flow Diagrams” solution from the Software Development area of ConceptDraw Solution Park very useful as it provides the “DFD” templates, samples as well as mentioned vector stencils libraries for drawing the “DFDs”, according to “Gane and Sarson” or “Yourdon and Coad” notation. Get this unique software today and make sure you get the right solution so you have no problems after to make the needed diagram, but to use the pre-made examples from the solution as your drafts.

Data Flow Diagram (DFD) *

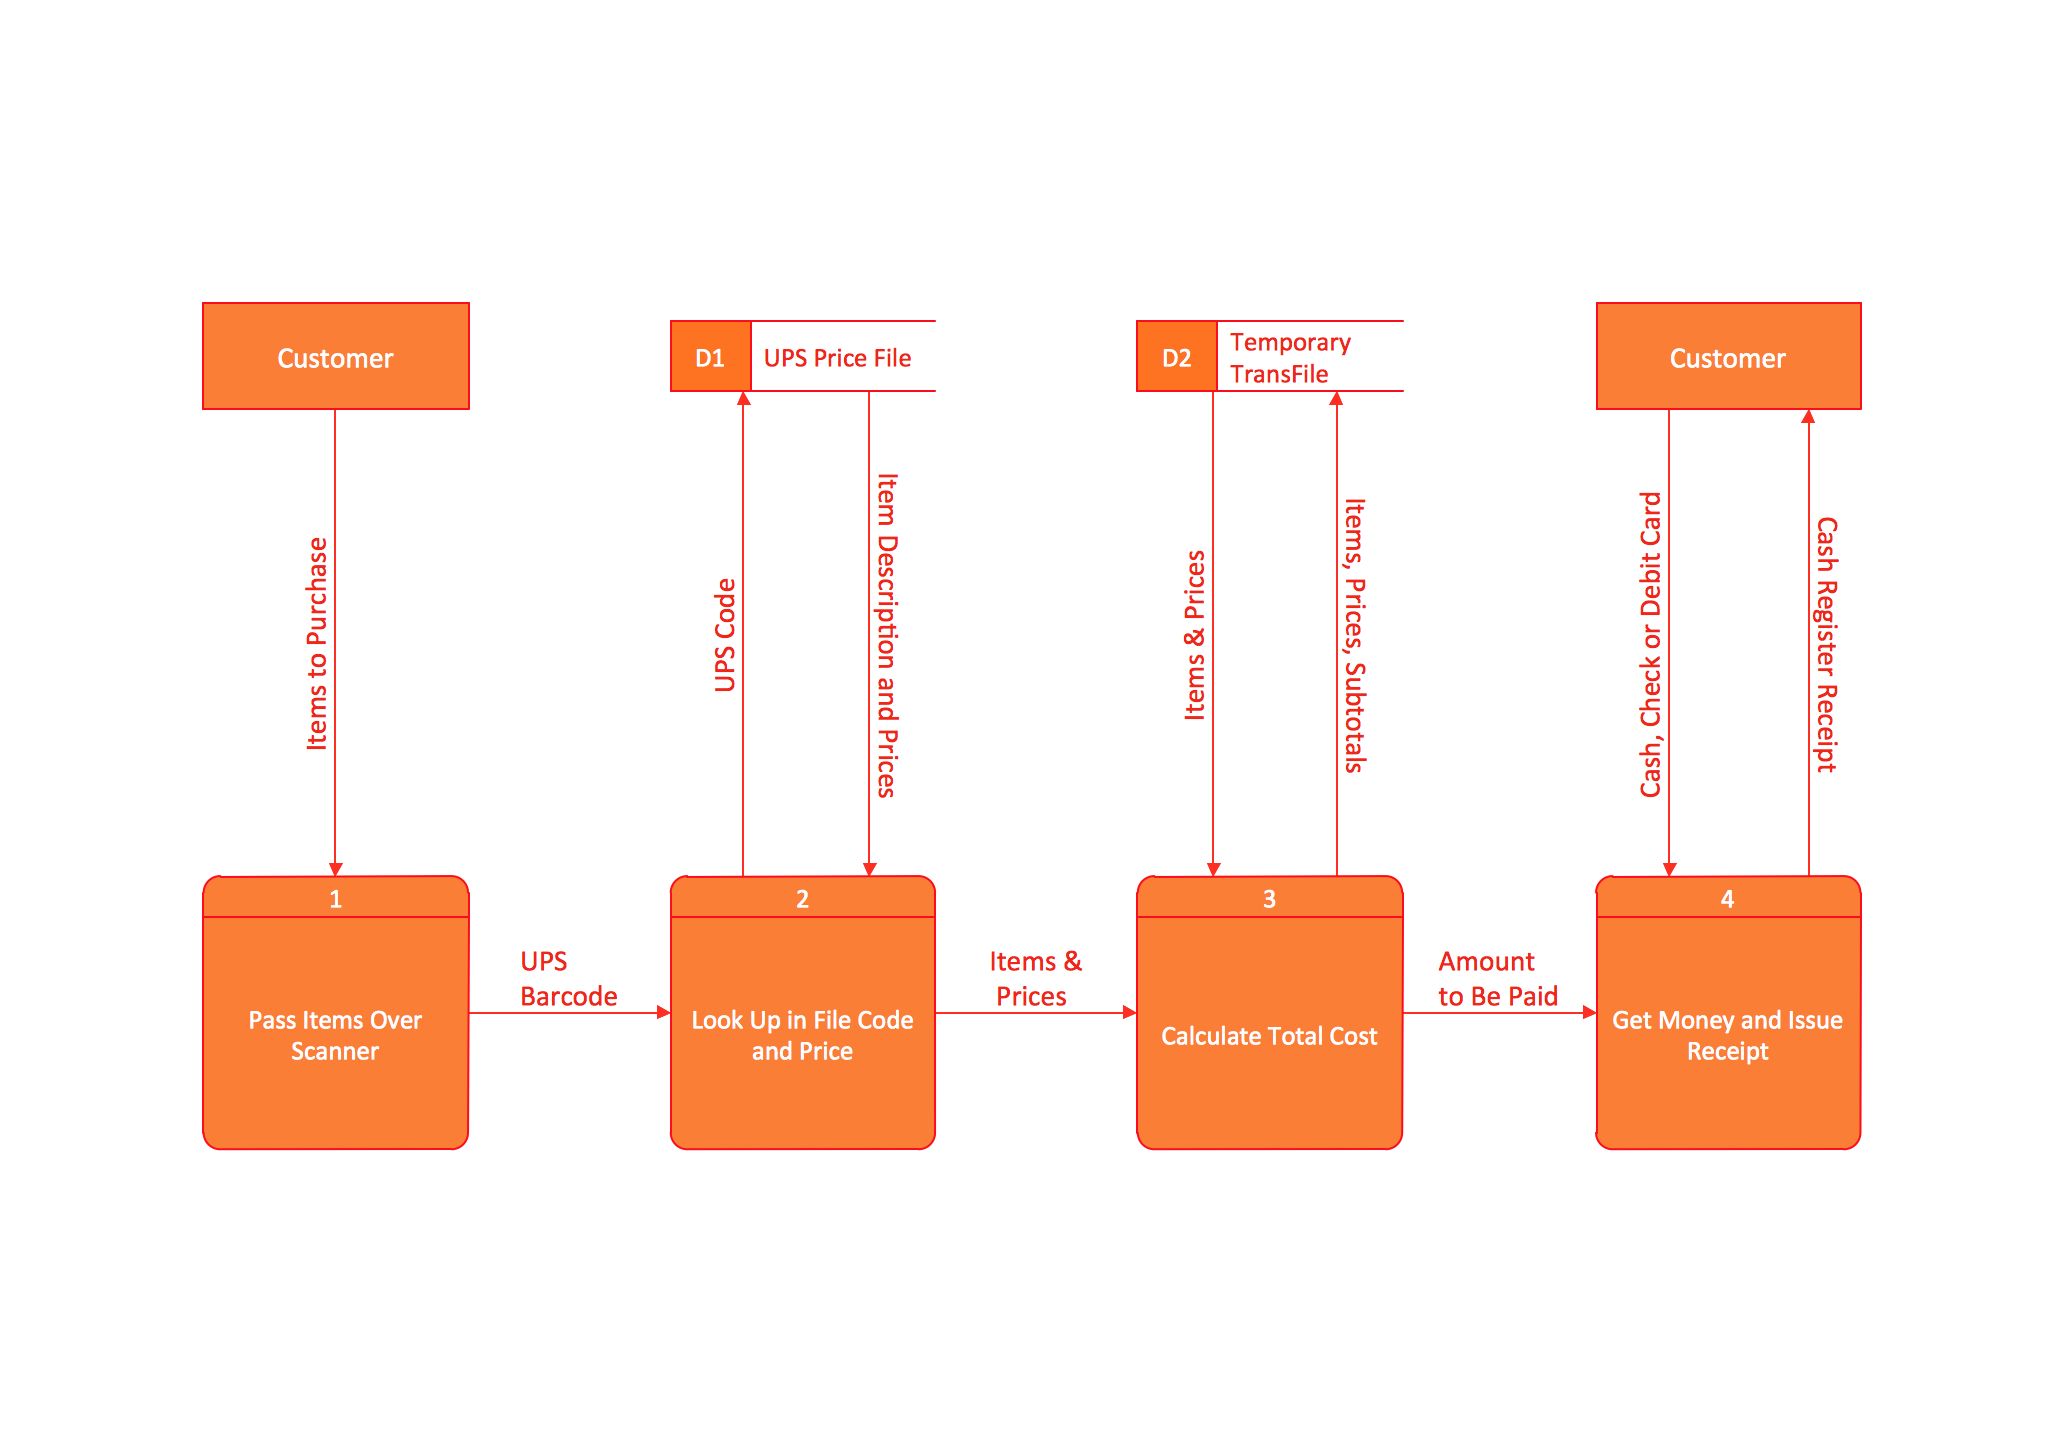
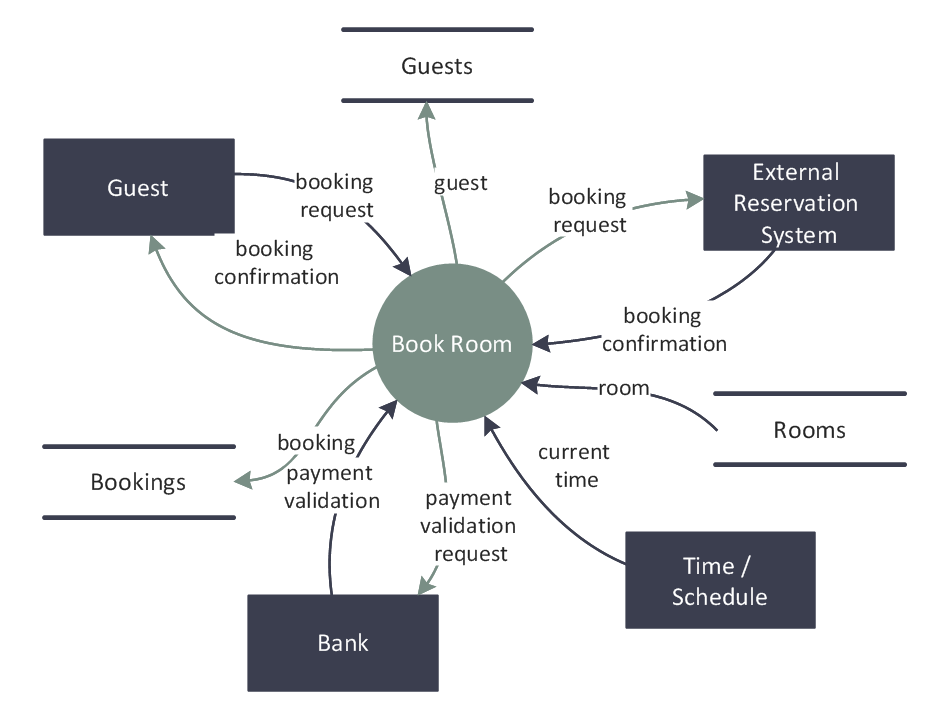
Example 2. Data Flow Diagram (DFD)

This example is created using ConceptDraw DIAGRAM enhanced with solution Data Flow Diagrams. This diagram shows one of the business processes to simplify and accelerate understanding, analysis, and representation.


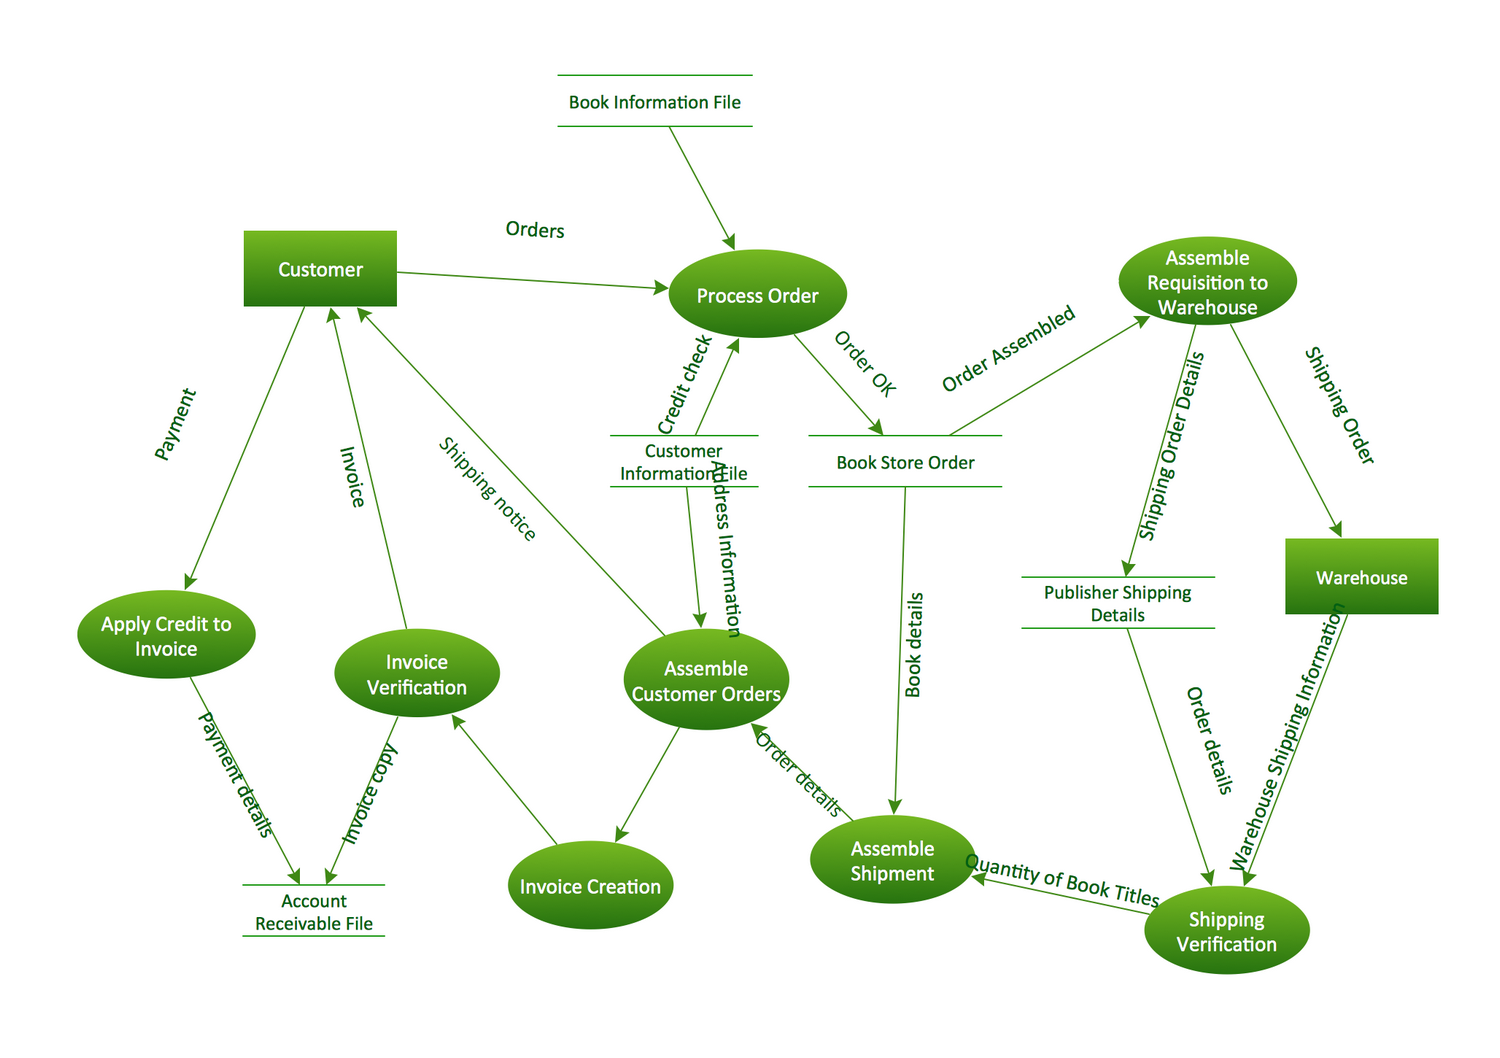
Data Flow Diagrams Sample:
TEN RELATED HOW TO's:
Diagramming software for Mac and PC - create flowcharts and presentations for Social Media Organizing.Social Media Response DFD Flowcharts - diagramming software ( Mac PC ) *
Picture: Social Media Response DFD Flowcharts - diagramming software ( Mac PC )
Related Solution:
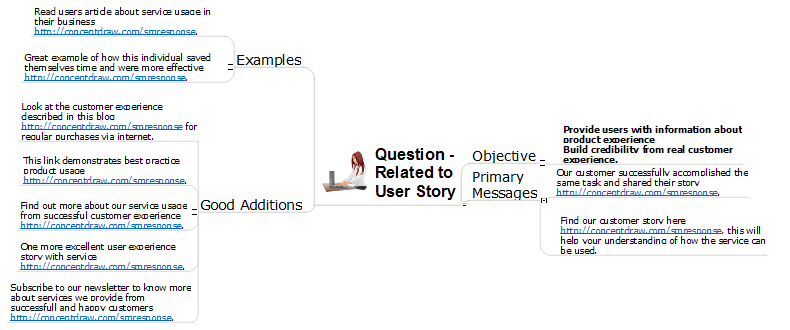
Interactive tool helps you find the appropriate response to social media mentions quickly. There are materials to help trainers and consultants develop a social media strategy and provide training for social media groups on how to effectively accomplish their daily work.How to Present a Social Media Response Plan DFD to Your Team *
Picture: How to Present a Social Media Response Plan DFD to Your Team
Related Solution:
The UML diagram is a powerful tool which lets visually represent all system's components, the interactions between them and relationships with external user interface. The Rapid UML solution for ConceptDraw DIAGRAM software offers diversity of UML flowchart symbols for drawing all types of UML diagrams.UML Flowchart Symbols *
Picture: UML Flowchart Symbols
Related Solution:
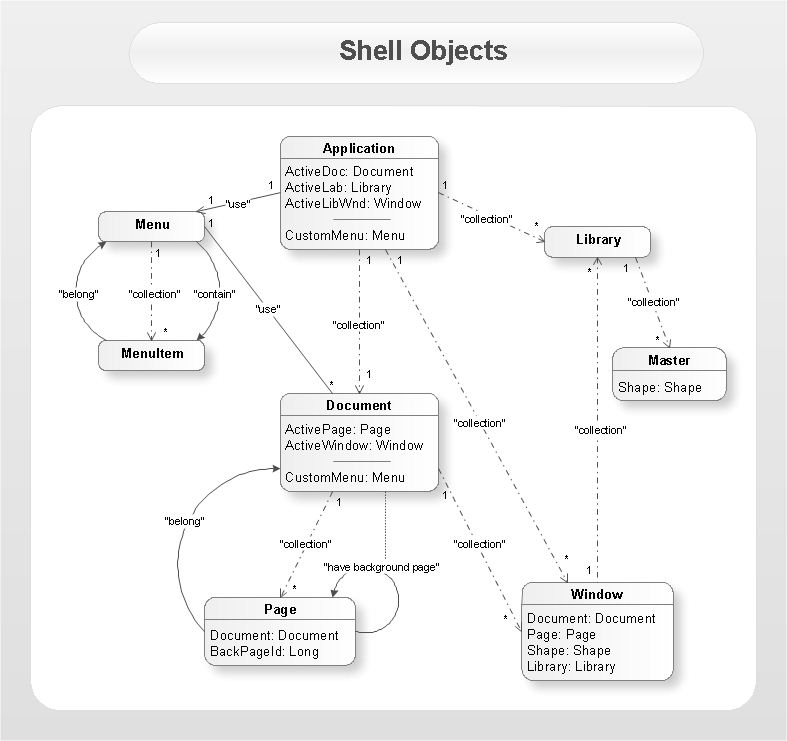
Data structure diagram (DSD) is intended for description of conceptual models of data (concepts and connections between them) in the graphic format for more obviousness. Data structure diagram includes entities description, connections between them and obligatory conditions and requirements which connect them. Create Data structure diagram with ConceptDraw DIAGRAM.Data structure diagram with ConceptDraw DIAGRAM
Picture: Data structure diagram with ConceptDraw DIAGRAM
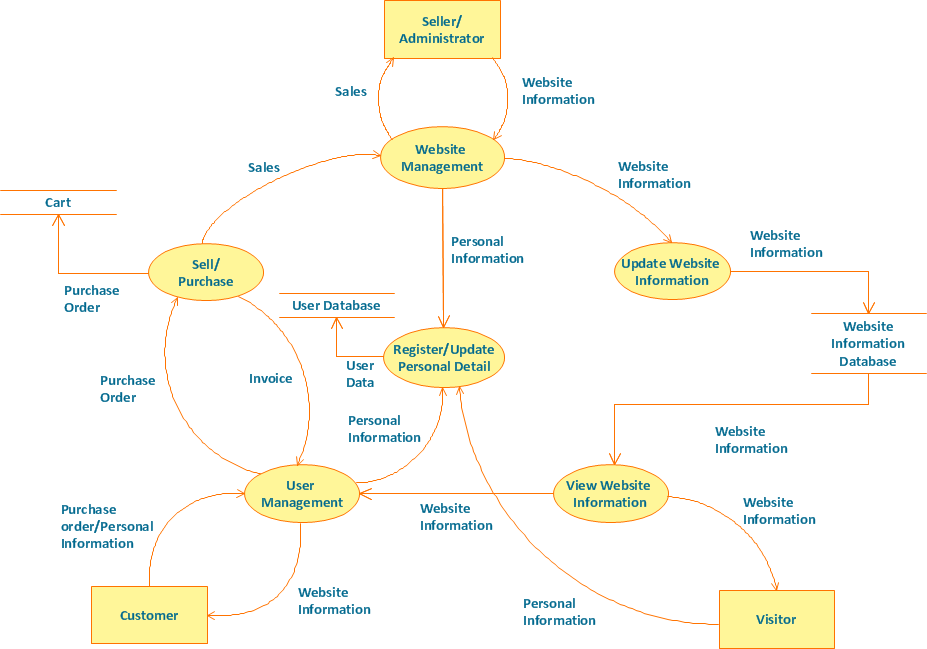
Structured-systems analysis and design method uses data flow diagrams to represent the process of data flowing through a system. Talking about this might be useless without a proper example of DFD for online store (Data Flow Diagram). This DFD example shows all the distinctness that a diagram can bring into a scattered data structure. Data flow diagrams are used to show how data is processed within some business processes. Making DFD is a common practice for business process modeling and analysis. This diagram represents the online store business flow. It describes inputs and outputs within online selling process and depicts the interactions between its participants. This DF diagram can be used by system analysts to create an overview of a business, to study and discover its inherent strengths and weak points.Example of DFD for Online Store
Picture: Example of DFD for Online Store (Data Flow Diagram)
Related Solution:
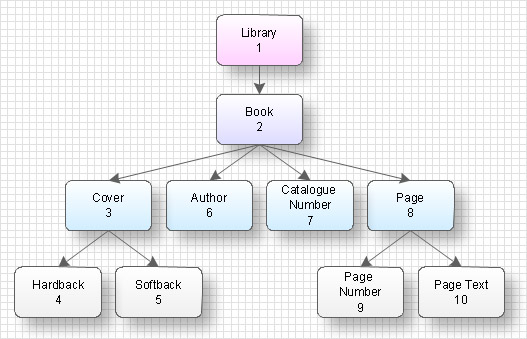
The diagrams with highest level in the hierarchy define the main processes or subsystems with external and internal data sources. To detail them, DFD Library is used to build a system of lower level diagrams. This decomposition continues hereinafter it is meaningless. This data flow diagram of a system of a library management is a context-level DFD. The data flow diagram of this type depicts the large system as a solid process, and does not input any explanation of its content. It is an ordinary practice - creation of a context-level data flow diagram when starting system development. This DFD was made using ConceptDraw solution designed especially for data flow diagrams development. One can find out Data Flow Diagrams Solution in a Solution Park of ConceptDraw and can use in as addition to the common Conceptdraw DIAGRAM diagramming tools.DFD Library System *
Picture: DFD Library System
Related Solution:
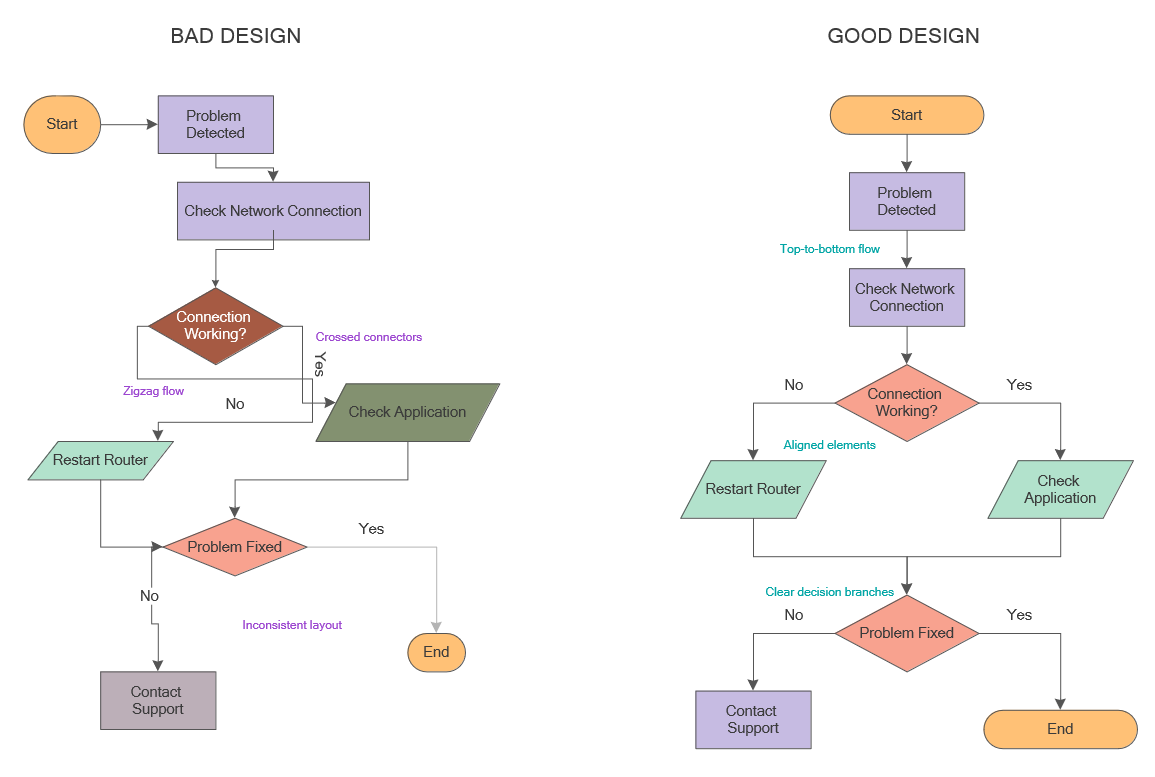
When thinking about data visualization, one of the first tools that comes to mind is a flowchart design. You can find flowchart symbols, shapes, stencils and icons easily on the Internet, but it might take time to systematize this information. Nevertheless, once you start flowcharting, you’ll love its simplicity and efficiency. This diagram consists from standard flowchart symbols, approved by ANSI (American National Standard Institute) for drawing flowcharts. A flowchart is a diagram that represents a step-by-step algorithm of any process, displaying the process stages as boxes that are connected with arrows. Flowchart design makes it clear and readable. Flowchart designed using ConceptDraw DIAGRAM flowchart software allows to make attractive and clear process presentation, it makes interpretation of the business process flow fresh and versatile. Great flowchart design view is a big advantage over the diagram created manually on a paper.Comparison of bad and good flowchart design showing zigzag flow, crossed connectors, and aligned elements
Picture: Flowchart Design: Principles, Layout, Symbols and Best Practices
Related Solution:
Data flow diagrams are the graphical tool, used in the visualization of data flow of some data processing systems. It is the valuable process modeling tool. Also designing DFD is the important component of the initial part of any information system development project. The standard symbols are used to represent the interaction of a system components and how various kinds of components influence on data flow. The ConceptDraw Data Flow Diagrams solution is design to assist professional software engineers in making DFDs according to Gane and Sarson, and Yourdon and Coad notations. Do you imagine yourself as a successful IT specialist? To your mind, they all use data flow diagram examples to learn and to get inspired. Aren’t you still with us?Data Flow Diagram Examples *
Picture: Data Flow Diagram Examples
Related Solution:
This pyramid chart example is supplied with the ConceptDraw Pyramid Diagrams solution. This is a model of Information Management Systems classification. It is made in a form of a four-level pyramid. The top level shows the information system developed for an executive management. Below, there is a level depicting the system of decision making process for the managers of the senior level. A schematic representation of the middle management information system, following to logic, is in the middle of the pyramid. And at least, the lowermost level represents an information processing system for employees.Pyramid Diagram *
Picture: Pyramid Diagram
Related Solutions:
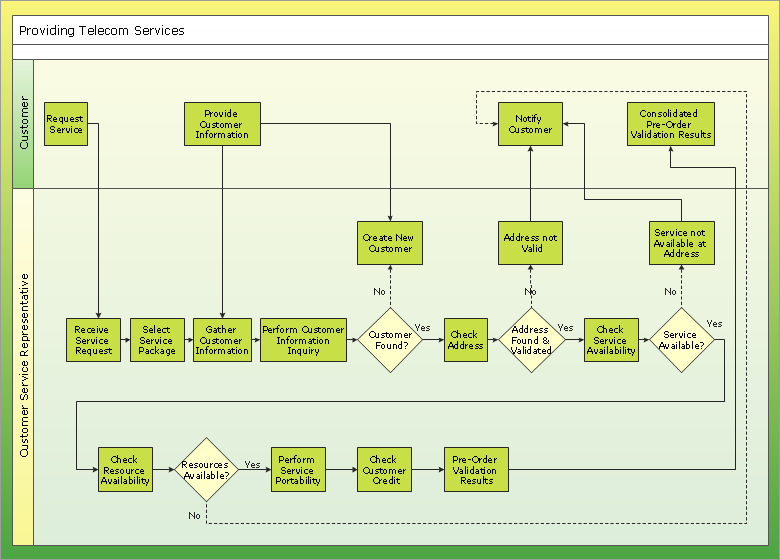
Working with information can be quite tedious, furthermore, some data can be quite difficult to perceive without any graphic representation. So, to facilitate your work, you can use business diagrams, such as simple flowcharts or Gantt charts for project management and orgcharts for clarifying your company structure. You can use a proper software, like ConceptDraw Pro, draw them on paper, or use whiteboards, but it is more convenient to use a digital tool. This diagram shows a cross-functional flowchart that was made fore telecom service provider. A workflow of a common telecommunication service provider has a rather branched structure. Thus, it is useful to have a flow chart to visualize the sequences and interrelations of the work flow steps. Business process flowchart contains 17 processes and 4 decision points,that are distributed through 2 lines depicting the participants involved. Also there are connectors that show the data flow within processes. This flowchart displays a detailed model of the telecom service trading process, as well as all participants in the process and how they interact with each other.Business diagrams & Org Charts with ConceptDraw DIAGRAM  *
Picture: Business diagrams & Org Charts with ConceptDraw DIAGRAM
ConceptDraw
DIAGRAM 18