Data Flow Diagram Software
When studying a business process or system involving the transfer of data, it is common to use a Data Flow Diagram (DFD) to visualize how data are processed. Being initially used exclusively in regards to the flow of data through a computer system, now DFDs are employed as the business modeling tools. They are applied to describe the business events and interactions, or physical systems involving data storage and transfer.
ConceptDraw DIAGRAM is a powerful Data Flow Diagram software thanks to the Data Flow Diagrams solution from the Software Development area of ConceptDraw Solution Park.
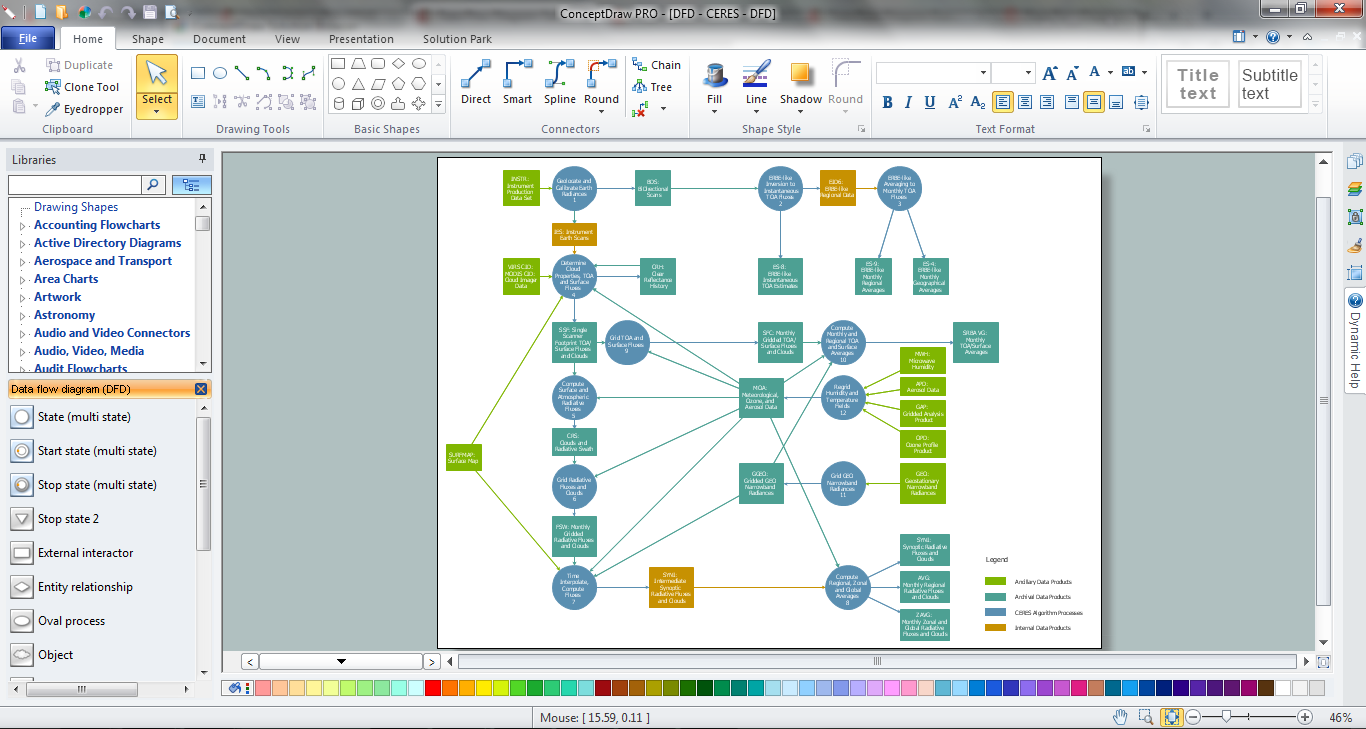
Example 1. Data Flow Diagram Software
Data Flow Diagrams solution extends ConceptDraw DIAGRAM software with predesigned templates, samples and libraries of design elements for drawing professional-looking Data Flow Diagrams (DFDs). All Data Flow Diagram examples, templates, and samples are available from ConceptDraw STORE at any moment. You can find the Model of Small Traditional Production Enterprise, Process of Account Receivable, Coad/Yourdon Object Oriented Analysis Model, and many more samples.

Example 2. Data Flow Diagrams Solution in ConceptDraw STORE
Moreover, any of the offered examples is easily changed for your needs. The predesigned DFD vector objects grouped in 3 libraries of the Data Flow Diagrams solution are used for this:
- Data Flow Diagrams Library
- Gane-Sarson Notation Library
- Yourdon and Coad Notation Library

Example 3. Data Flow Diagrams Library Design Elements
The Data Flow Diagrams designed in ConceptDraw DIAGRAM will help you effectively model the data flows and functional requirements for a designed system. It supports you in successful communication with your colleagues in business questions.

Example 4. Data Flow Diagram Software - DFD Interaction between IDMA and preprocessor.
The following features make ConceptDraw DIAGRAM the best Data Flow Diagram software:
- You don't need to be an artist to draw professional-looking diagrams in a few minutes.
- Large quantity of ready-to-use vector objects makes your drawing diagrams quick and simple.
- Great number of predesigned templates and samples give you a good start for your own diagrams.
- ConceptDraw DIAGRAM provides you the possibility to use the grid, rules, and guides. You can easily rotate, group, align, arrange the objects, use different fonts and colors to make your diagram exceptionally looking.
- All ConceptDraw DIAGRAM documents are vector graphic files and are available for reviewing, modifying, and converting to a variety of formats: image, HTML, PDF file, MS PowerPoint Presentation, Adobe Flash, MS Visio.
- Using ConceptDraw STORE you can navigate through ConceptDraw Solution Park, managing downloads and updates. You can access libraries, templates, and samples directly from the ConceptDraw STORE.
- If you have any questions, our free of charge support is always ready to come to your aid.
TEN RELATED HOW TO's:
Job duties in small companies are usually spread randomly among workers, causing lots of problems and misunderstanding. One of the ways to restore order in business processing is to create a cross-functional flowchart with swim lanes that would represent every step in production system. Another advantage of using swim lanes flowchart is that it represents not only processes, but people responsible for them.
Swim lane diagram is a kind of a process flow diagram. Its special feature is that it joins the features of process flow diagrams with organizational charts. Thus, a swim lane diagram display a participant of the business process in a conjunction with general flow of the business system. A swim lane diagram is looks similar to a swimming pool's lanes. Lanes can be horizontal and vertical. The lanes are pointed out relatively to resource name, which is assigned on implementation of the given part of the business process. ConceptDraw Business Process Mapping solution delivers the ability to design develop swim lanes flowcharts using the vector graphic objects of Swim Lanes library.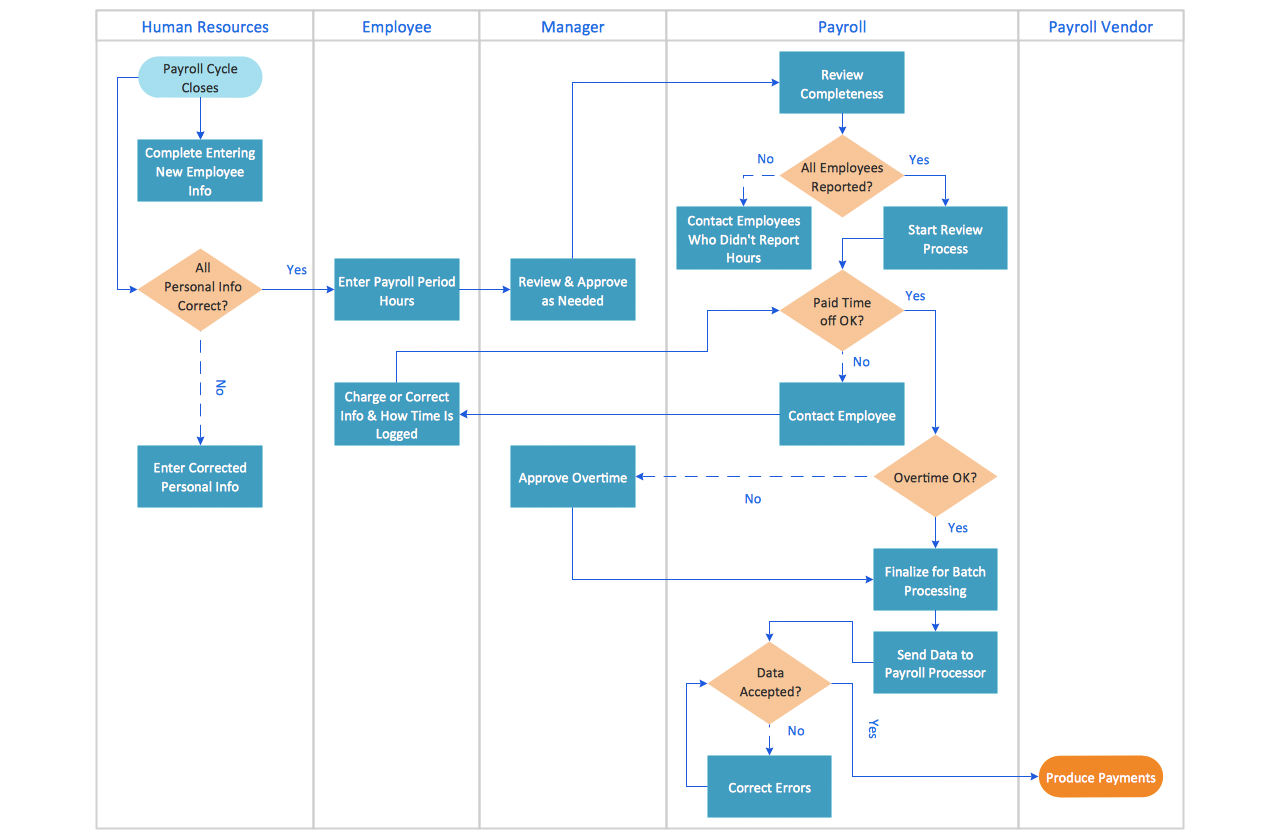
Picture: Swim Lane Diagrams
Related Solution:
Organizing and Selecting Social Media Response Messages.
Interactive Flowcharts can change the way one creates and organizes their social media response process.
Picture: What is Interactive Flowcharts
Related Solution:
Network Security Architecture Diagram visually reflects the network's structure and construction, and all actions undertaken for ensuring the network security which can be executed with help of software resources and hardware devices. You dream to find powerful software for easy designing Network Security Architecture Diagram? We recommend to use ConceptDraw DIAGRAM extended with Network Security Diagrams Solution from the Computer and Networks Area of ConceptDraw Solution Park.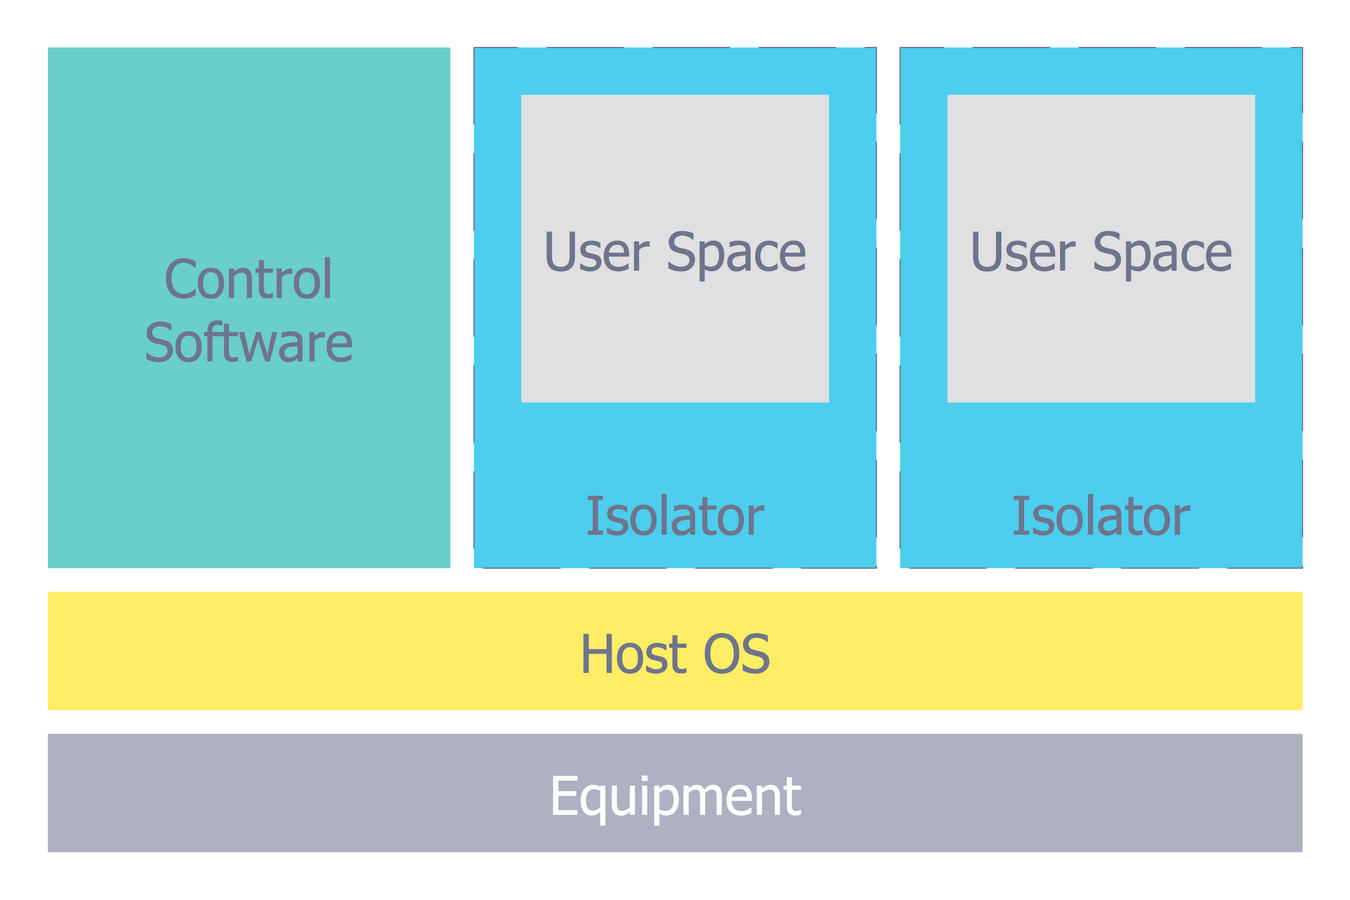
Picture: Network Security Architecture Diagram
Related Solution:
What's the best ERD tool for the Mac? ConceptDraw DIAGRAM on Mac OS X supplied with Entity-Relationship Diagram (ERD) Solution from the Software Development Area for ConceptDraw Solution Park is the best ERD tool! This solution offers for ConceptDraw users so powerful drawing tools, libraries with numerous ERD objects, which will help design ER diagrams of any complexity and any design you want.
Picture: What's the best ERD tool for the Mac?
Related Solution:
This sample was created in ConceptDraw DIAGRAM diagramming and vector drawing software using the Computer and Networks solution from Computer and Networks area of ConceptDraw Solution Park.
This is example of the Toroidal network topology
Network topology is the topological structure of the computer network.
Picture: Toroidal Network Topology
Related Solution:
Architectural drawing allows to show the location of a building or ensemble of buildings on the ground, indicating the cardinal points. For centuries, people had been studying architecture in universities to learn how to draw building plans and now everyone can do it easily just using appropriate software. While developing the building plan, its graphic part, you can display the part of the floor or the entire floor of a building with an indication of the exact location of the drawn premise.
Small-sized apartments does not restrict the advanced interior design opportunities. Here is a detailed and precise floor plan of a pretty small apartment. A furniture objects are added to show possible interior of this home. This plan can be used to help somebody with a floor layout and furniture arrangement. Having this floor plan in a pocket while shopping would be useful to check if there is enough rooms for a new furniture.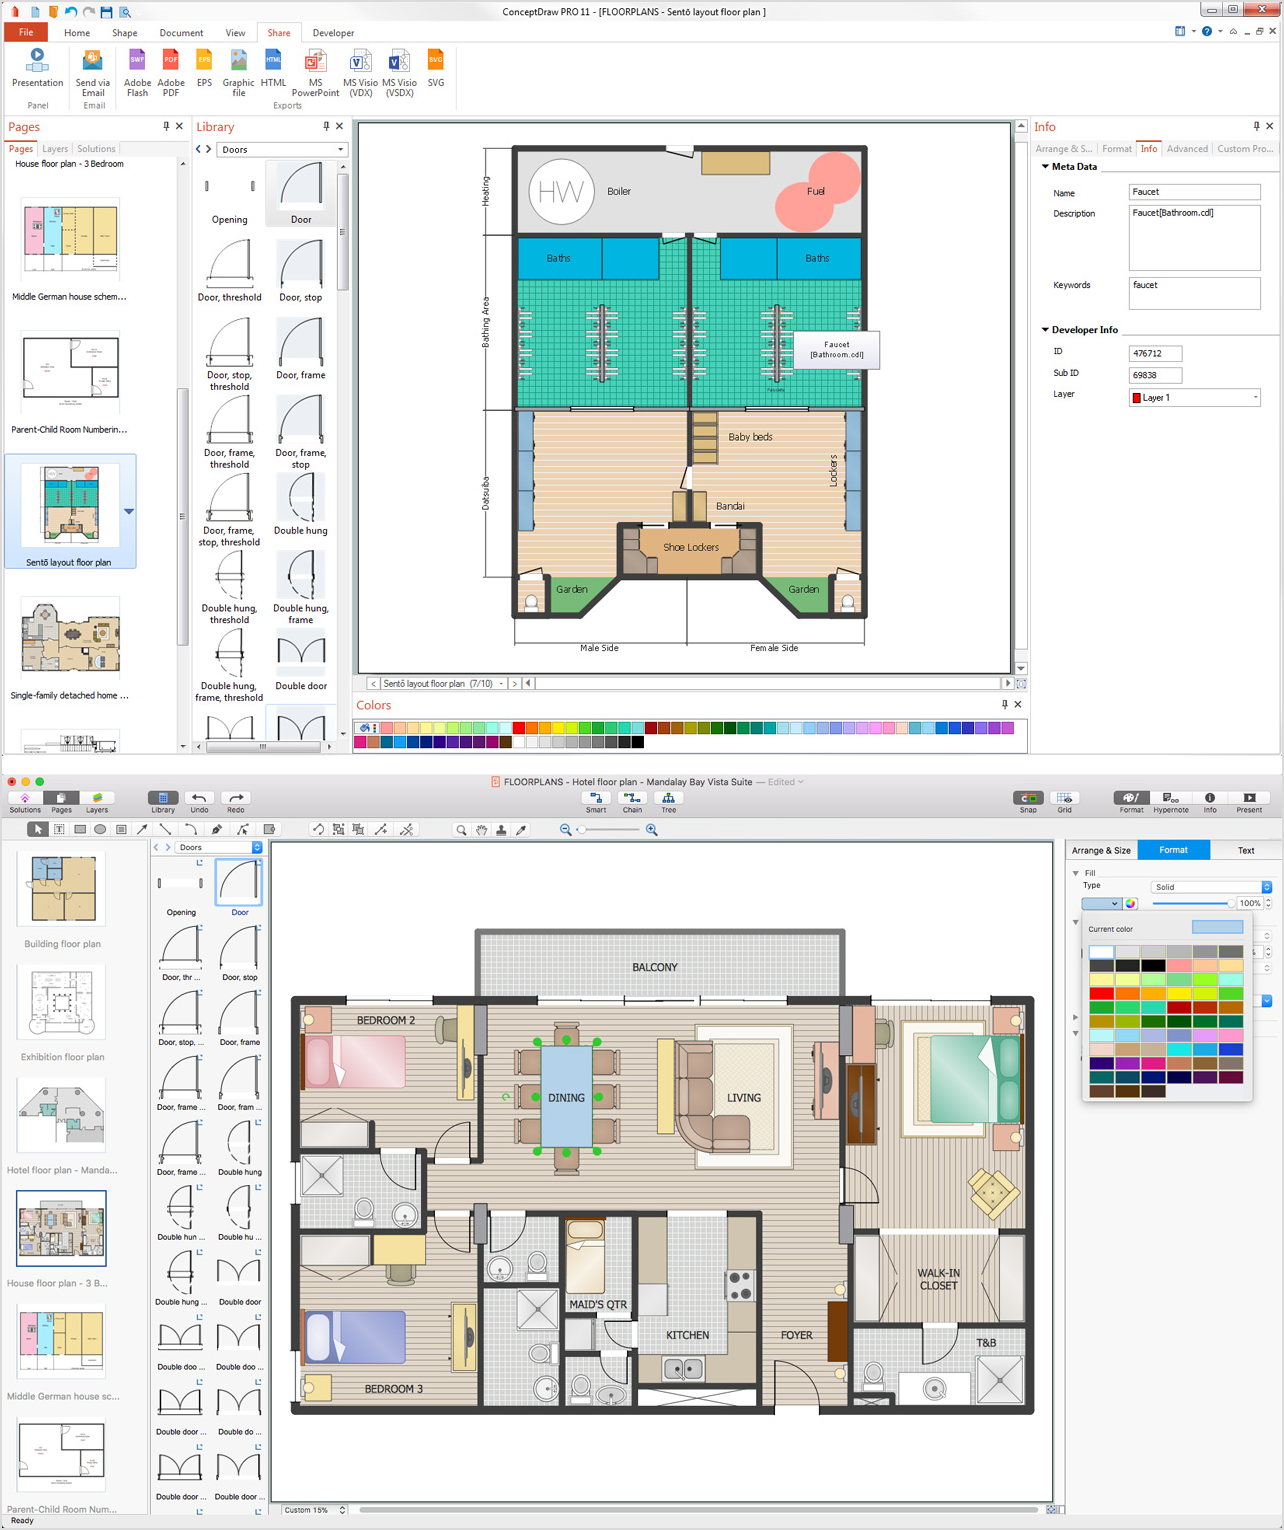
Picture: How To Draw Building Plans
Related Solution:
A Flow Map is a type of thinking maps, which help organize and understand information easily. Use ConceptDraw DIAGRAM software to ✔️ create a Flow Map of any degree of complexity in a few minutes, ✔️ display the interrelated information, ✔️ structure information sequentially or chronologically, ✔️ represent manufacturing or engineering processes
Picture: Flow Map: A Step-by-Step Guide
Related Solution:
Variable delay elements are often used to manipulate the rising or falling edges of the clock or any other signal in integrated circuits. Delay elements are also used in delay locked loops and in defining a time reference for the movement of data within those systems.
26 libraries of the Electrical Engineering Solution of ConceptDraw DIAGRAM make your electrical diagramming simple, efficient, and effective. You can simply and quickly drop the ready-to-use objects from libraries into your document to create the electrical diagram.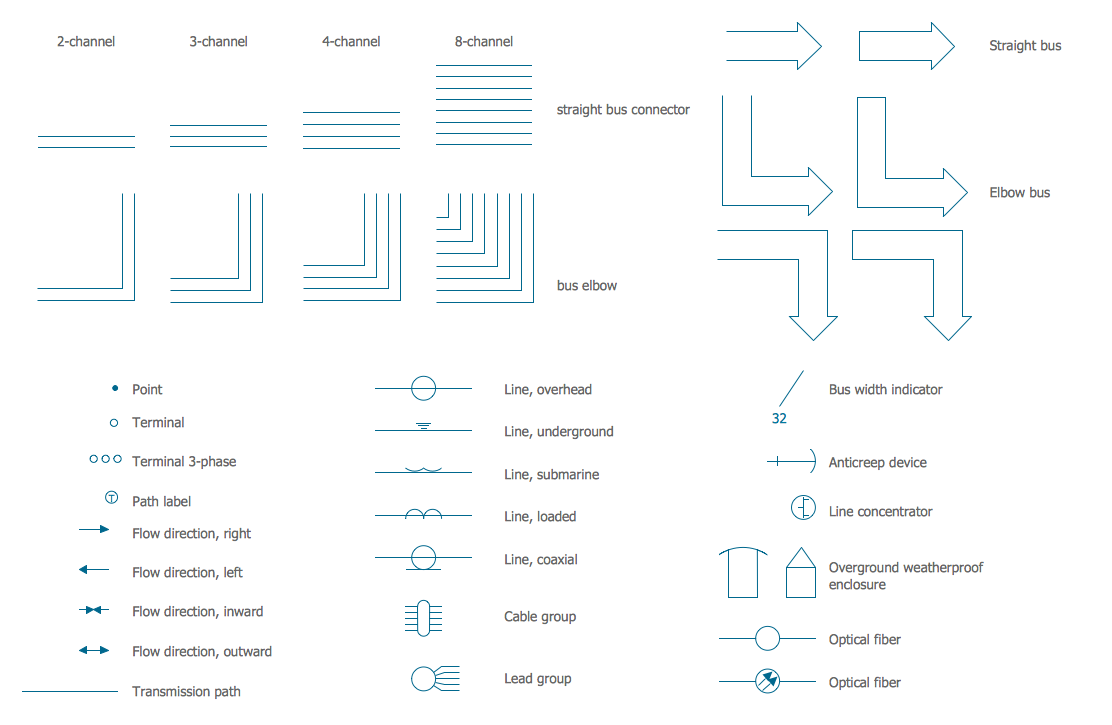
Picture: Electrical Symbols — Transmission Paths
Related Solution:


