TEN RELATED HOW TO's:
ConceptDraw DIAGRAM software extended with Matrices Solution from the Marketing Area of ConceptDraw Solution Park offers you the possibility to develop the Ansoff Matrix of any complexity.
Picture: Ansoff Matrix
Related Solution:
SWOT Analysis solution extends ConceptDraw MINDMAP and ConceptDraw DIAGRAM products with easy-to-use SWOT Analysis tools.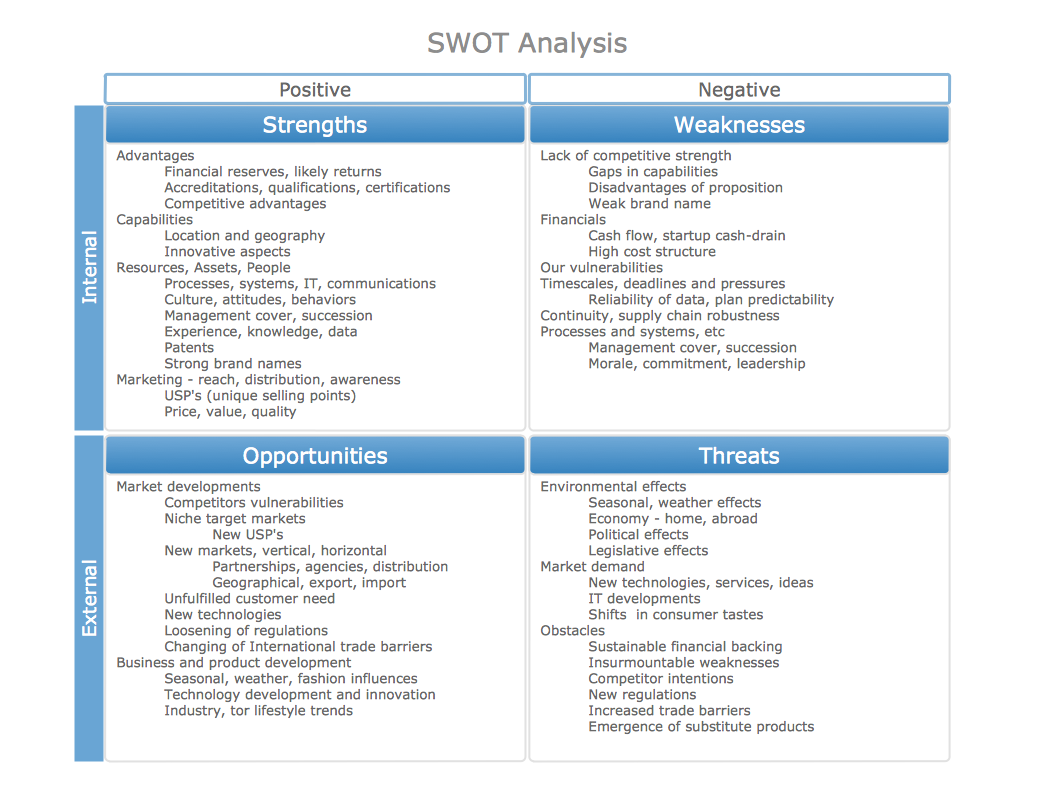
Picture: SWOT Analysis matrix templates and samples
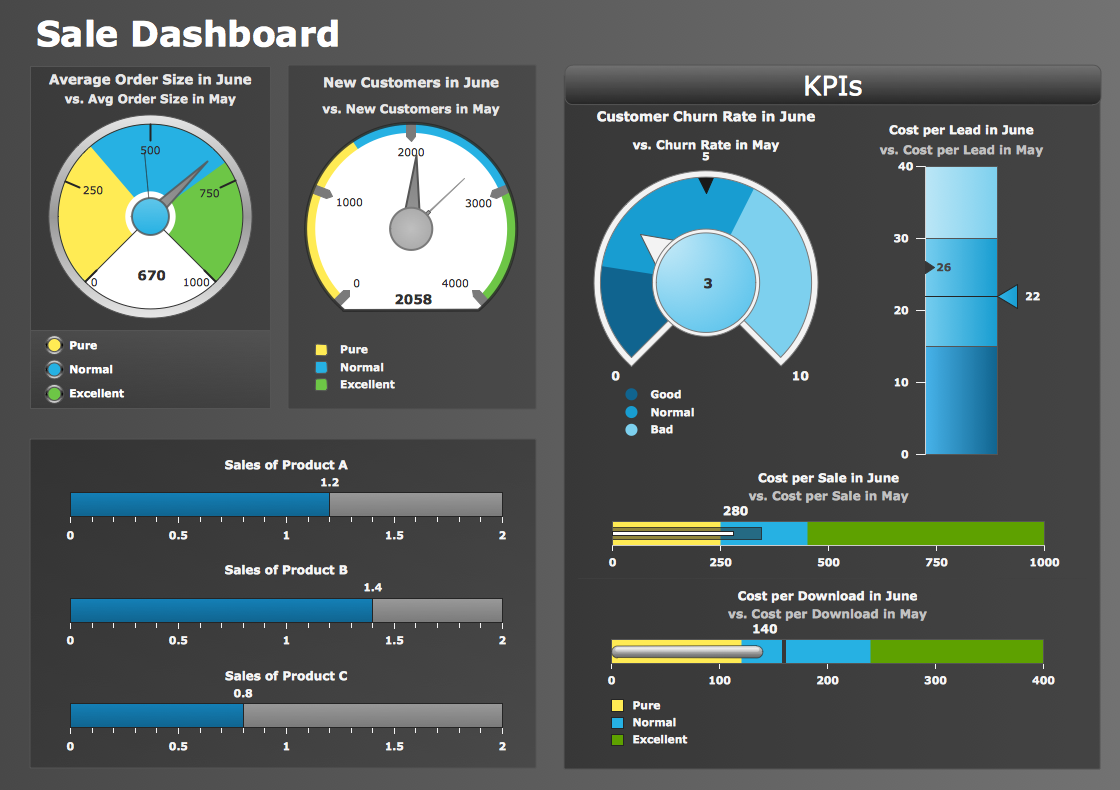
Visualizing sales data using Sales Dashboard solution for ConceptDraw DIAGRAM helps you measure the progress of your sales team. You can measure corporate, team and personal progress combining different KPI on your sales dashboard.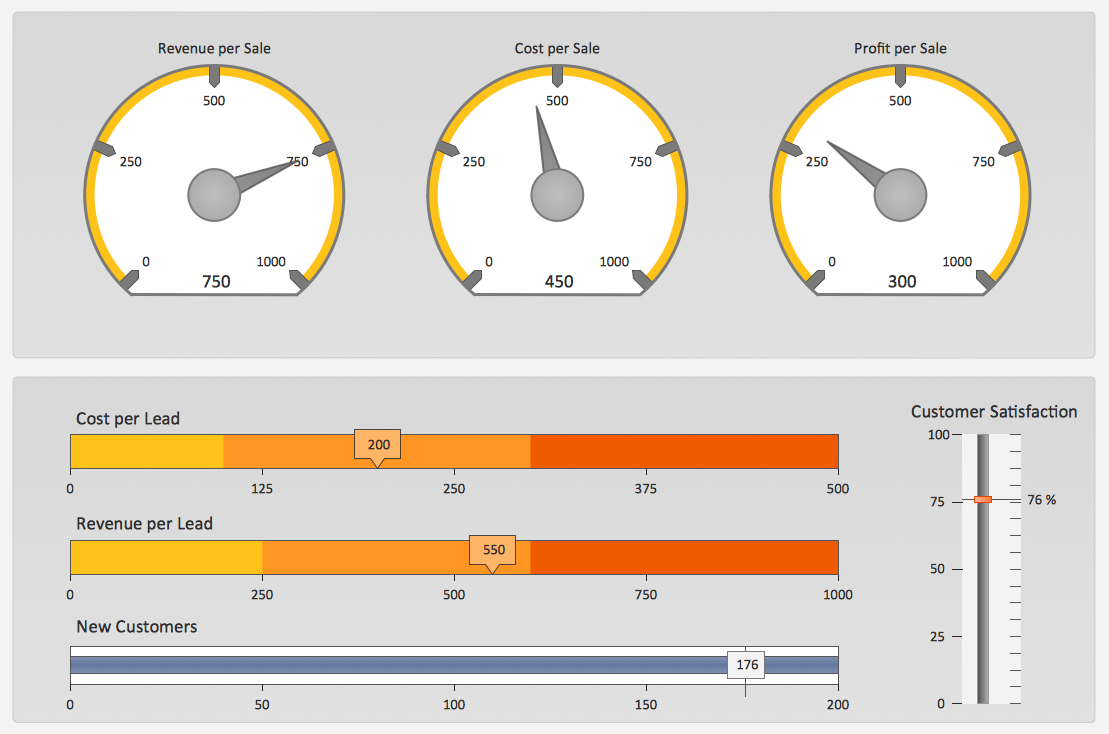
Picture: Measure the Progress
ConceptDraw Sales Dashboard is an automatically updated sales dashboard you can customize to see KPI you need. You can access sales dashboard anywhere to get fresh data and use any minute to see how your business can improve.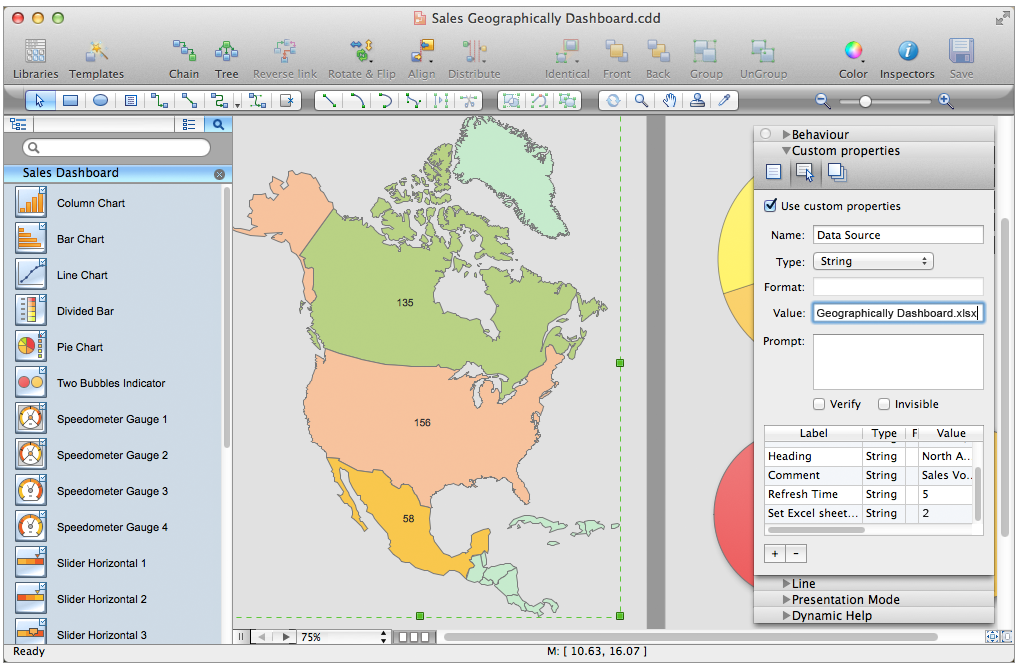
Picture: Sales Dashboard - Access Anywhere
In your work activity you need regularly draw the line graphs? And each time you ask yourself a question How to Draw a Line Graph easier and faster?. The desire to automate the line graphs drawing process led to the creation of Line Graphs solution from Graphs and Charts area of ConceptDraw Solution Park.
Picture: How to Draw a Line Graph
Related Solution:
ConceptDraw DIAGRAM diagramming and vector drawing software enhanced with powerful HR Flowcharts Solution perfectly suits for Human Resource Management.
Picture: Human Resource Management
Related Solution:
Sales process management is a business discipline which focuses on the development and practical application of various sales techniques, and on the management of sales operations of the company.
It is effective to use professional software for the sales process management. ConceptDraw DIAGRAM diagramming and vector drawing software extended with Sales Flowcharts solution from the Marketing area of ConceptDraw Solution Park is the best choice.

Picture: Sales Process Management
Related Solution:
A combination of sales KPI on a one dashboard helps you track sales activities and results. Visualizing sales data using ConceptDraw DIAGRAM software extended with the Sales Dashboard solutiongives you flexibility in choosing and tuning KPIs.
Picture: Sales KPI Dashboards
While creating flowcharts and process flow diagrams, you should use special objects to define different statements, so anyone aware of flowcharts can get your scheme right. There is a short and an extended list of basic flowchart symbols and their meaning. Basic flowchart symbols include terminator objects, rectangles for describing steps of a process, diamonds representing appearing conditions and questions and parallelograms to show incoming data.
This diagram gives a general review of the standard symbols that are used when creating flowcharts and process flow diagrams. The practice of using a set of standard flowchart symbols was admitted in order to make flowcharts and other process flow diagrams created by any person properly understandable by other people. The flowchart symbols depict different kinds of actions and phases in a process. The sequence of the actions, and the relationships between them are shown by special lines and arrows. There are a large number of flowchart symbols. Which of them can be used in the particular diagram depends on its type. For instance, some symbols used in data flow diagrams usually are not used in the process flowcharts. Business process system use exactly these flowchart symbols.
Picture: Flowchart Symbols: Meaning and Examples
Related Solution:
No science can't exist without illustrations, and especially astronomy! Illustrations help to visualize knowledge, natural phenomenons which are studied by astronomy, they equally effective help in work, during the learning process and on the conferences.
Now we have professional astronomy illustration software - ConceptDraw DIAGRAM illustration and sketching software with templates, samples and libraries of a variety of astronomy symbols, including constellations, galaxies, stars, and planet vector shapes; a whole host of celestial bodies. When drawing scientific and educational astronomy illustrations, astronomy pictures and diagrams, can help you reach for the stars!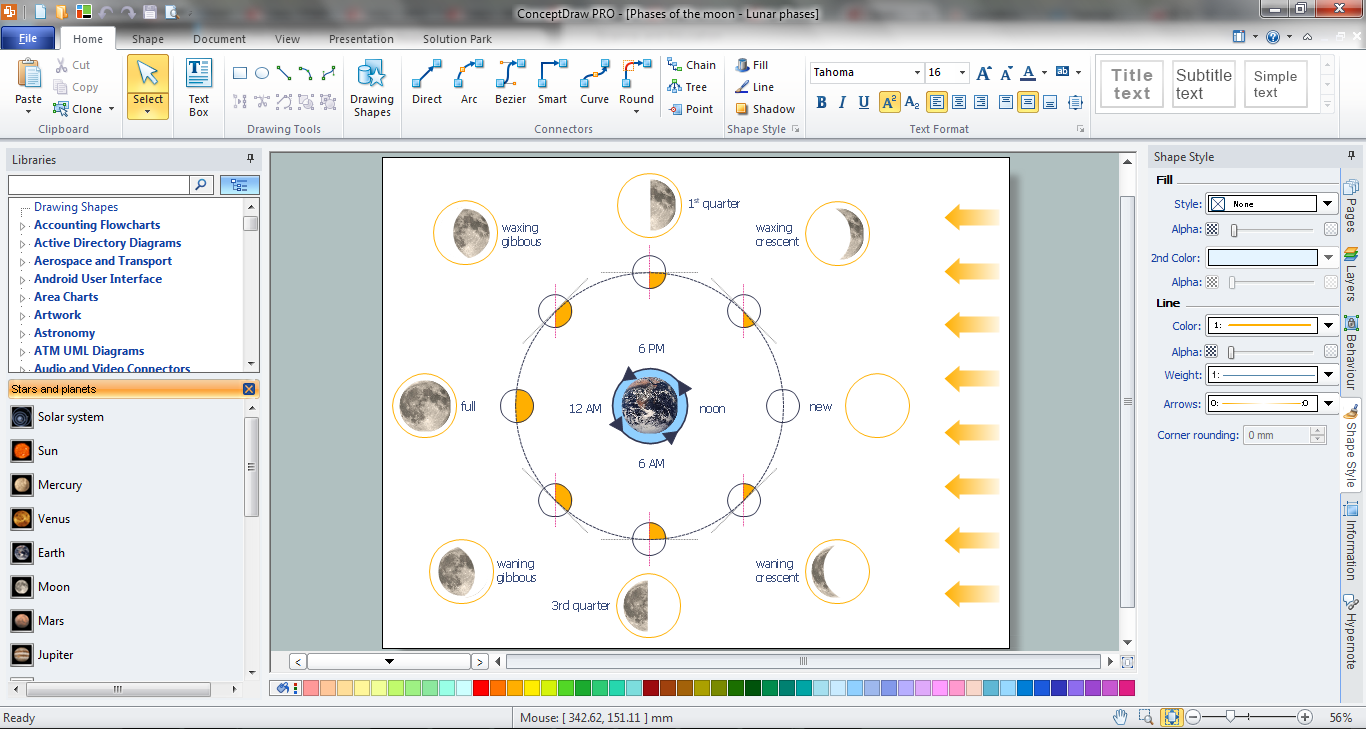
Picture: Illustration Software
Related Solution: