Database Model Diagram
Since the most of applications keep their data in databases, the database design and database modeling play highly important role during the process of applications development, at this the time of recording and retrieving data from the database has a great value. In addition, software developers and database designers are well aware that only properly and accurately built data models allow to construct effective databases permitting to retrieve and write data quickly, that ultimately contributes to significant increase of applications performance, as well as ensures the scalability and flexibility of development. Therefore, during the process of applications development, it is recommended to pay special attention and sufficient amount of time to the database modeling and drawing the database model diagram.
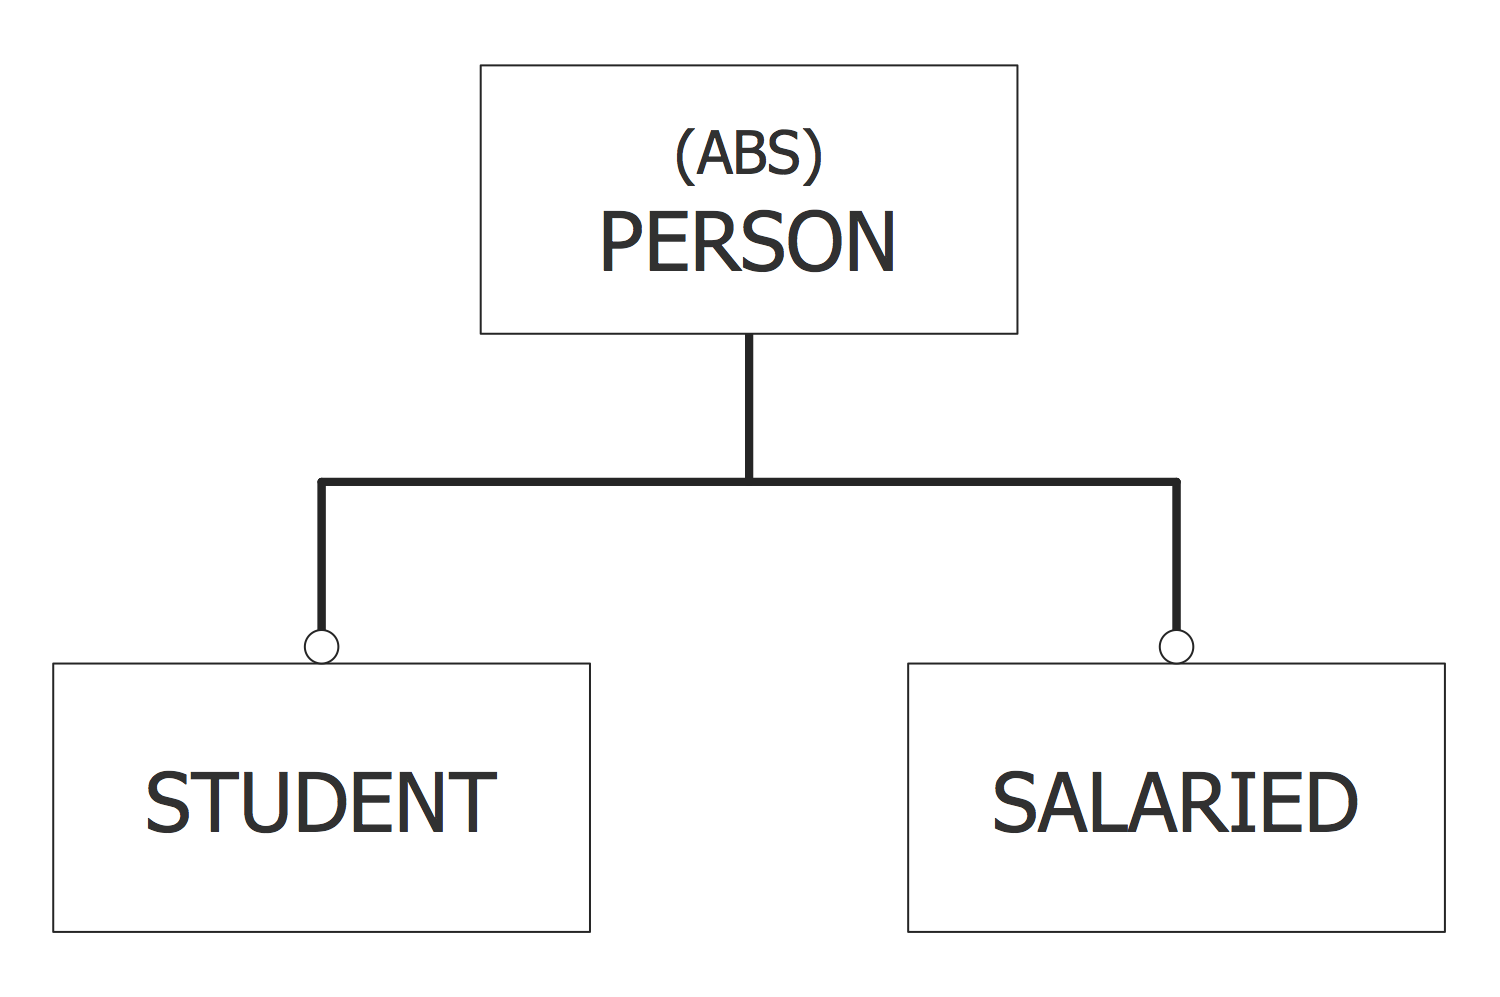
EXPRESS-G Database model diagram
A database model is a type of data model, which is intended for determining the logical structure of a database, for setting relationships and constraints that define the ways of storing, organizing, accessing and also manipulating the data within a given database. The database models are built according to the established rules and concepts of their construction, and typically with help of data modeling notations defined by standard data modeling languages, such as EXPRESS and EXPRESS-G.
Database model diagram - Audio Compact Disc Collection
The database modeling is a fairly simple process, especially at the use of notations specified by standard data modeling languages EXPRESS or EXPRESS-G, and also powerful data modeling tools, such as, for example, ConceptDraw DIAGRAM diagramming and vector graphics software enhanced with EXPRESS-G data Modeling Diagram solution from the Software Development area of ConceptDraw Solution Park.
EXPRESS-G Database model diagram samples in ConceptDraw STORE
The ConceptDraw DIAGRAM software perfectly suits for construction the database models representing the data structures required for design and creation the databases, for reconstruction earlier built databases into the database models and designing professional-looking Database model diagrams and schematics.
THREE RELATED HOW TO's:
When we start to speak about databases, we must always mention database structure visualization. One of the most common ways to do it is to create an entity relationship diagram, and to put appropriate symbols on it. It is important either for database projecting and for its' future maintenance.
Entity Relationship Diagram describes data elements and their relationships within a database. There are a set of special symbols that depict each element of an entity relationship diagram. Entities - represents some stable components such as supplier, employee, invoice, client, etc. Relation symbols show how the entities interact. Attributes define characteristics of the relationships. Attributes can be one-to-one or many-to-many. Physical symbols is used in the physical models. They represent items such as fields, tables, types and keys. ERD physical symbols are the building material for the database. Notation lines are used to illustrate the relationships. The most common method is Crow’s Feet notation. You can use ConceptDraw Entity-Relationship Diagram (ERD) solution to represent a database using the Entity-Relationship model.Picture: Entity Relationship Diagram Symbols
Related Solution:
The vector stencils library Crow's Foot Notation from the solution Entity-Relationship Diagrams (ERD) contains specific symbols of the Crow's foot notation such as relationship symbols and entity symbols for ConceptDraw DIAGRAM diagramming and vector drawing software. The Entity-Relationship Diagrams (ERD) solution is contained in the Software Development area of ConceptDraw Solution Park.Picture: Martin ERD Diagram
Related Solution:
It is easy to recreate any informational system structure using diagrams. There are three main components of any ER diagram: entity, attribute and relationship. Basing on these three components, one can define other, less used elements, such as weak entity or relationship, derived attribute, recursive relationship etc.
This is the set of graphic elements of ERD Chen's notation. This ERD notation is used to represent an entity–relationship models. It involves the set of geometric forms: rectangles - depicting entities, ovals - representing attributes and diamonds depicting relationships assigned for first-class objects, that can have relationships and attributes of their own. Connections are displayed with arrowed lines. It is known that the Chen's ERD notation is used to show a detailed view of entities and relationships. ConceptDraw Entity-Relationship Diagram solution from the Software Development section of Solution Park provides the ability to create ERD of database structure for software development purposes using the Chen’s notation elements.Picture: Components of ER Diagram
Related Solution: