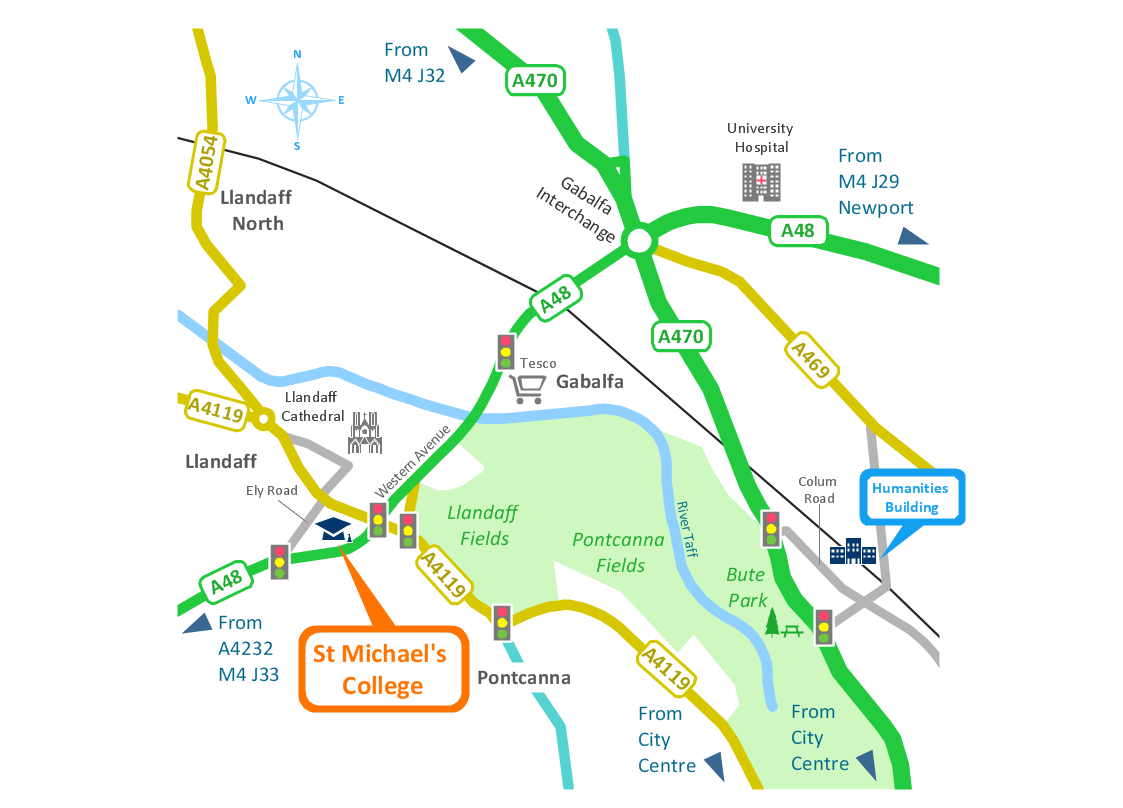
Sample 1. Spatial infographics - Conference centre location map.
Solution Spatial Infographics from ConceptDraw Solution Park extends ConceptDraw DIAGRAM ector diagramming and business graphics software with easy-to-use spatial infographics drawing tools.
This solution contains spatial infographics samples, map templates to be filled in, and libraries of vector stencils for main design elements of spatial infographics.
Use this solution to draw your own geospatial infographics documents with thematic maps, road maps, directional maps and transport maps.
NINE RELATED HOW TO's:
Subway infographic design elements of MetroMap and ConceptDraw software tools.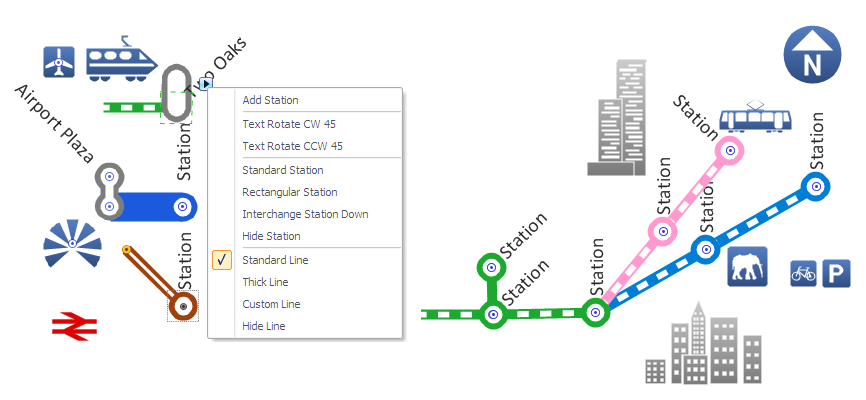
Picture: Subway infographic design elements - software tools
Related Solution:
As restaurant industry is growing rapidly nowadays, researches show that almost half of the adults have worked in a restaurant or a cafe. Moreover, many of them dream to start their own someday. Unfortunately, it takes a lot of time to write a business plan and to find a great location, although some know how to create a restaurant floor plan in minutes or how to plan budget effortlessly. Hiring employees can also cause a lot of headache, but this is crucial for further success, because every guest comes to restaurant for a good service and delicious food. It is also worth noting that restaurant concept is also important, because it defines target audience and influences the menu.
This diagram represents the floor plan of an ongoing sports-theme establishment - restaurant, cafe, or other food service. A number of widescreen monitors installed along the perimeter provide visitors the opportunity to follow the course of a match from anywhere in the dining room of restaurant or cafe. The most of sports fans believe that food and alcohol is a big part of any sports show. That is why the dining room takes the most space - almost 60% of the total establishment space. Nearly all sports fans consume beverages while watching sports - beer, soda or water at least. Thus, the restaurant floor plan designers added a large lavatory there. Moreover, project developers considered unnecessary the gender division of such delicate place - perhaps they guess that only men are watching football, or believe that alcohol will eliminate the most of gender differences.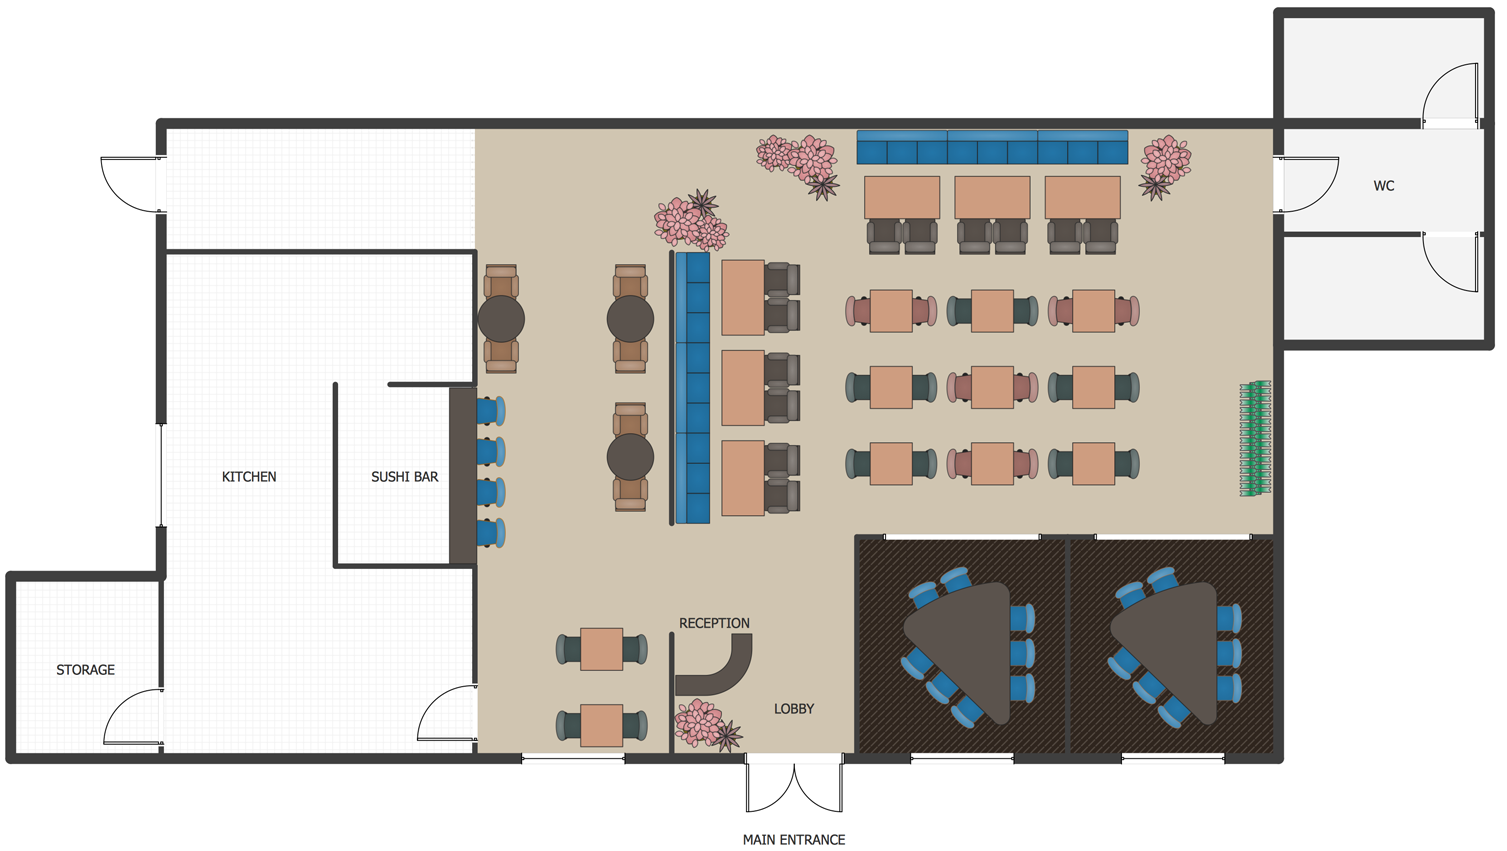
Picture: How To Create Restaurant Floor Plan in Minutes
Related Solution:
TOWS Matrix is an effective tool which allows to analize the external opportunities and threats by means of analyzing the internal strengths and weaknesses of a company. ConceptDraw DIAGRAM diagramming and vector drawing software extended with SWOT and TOWS Matrix Diagrams Solution from the Management Area will help design TOWS Matrix for your company without efforts.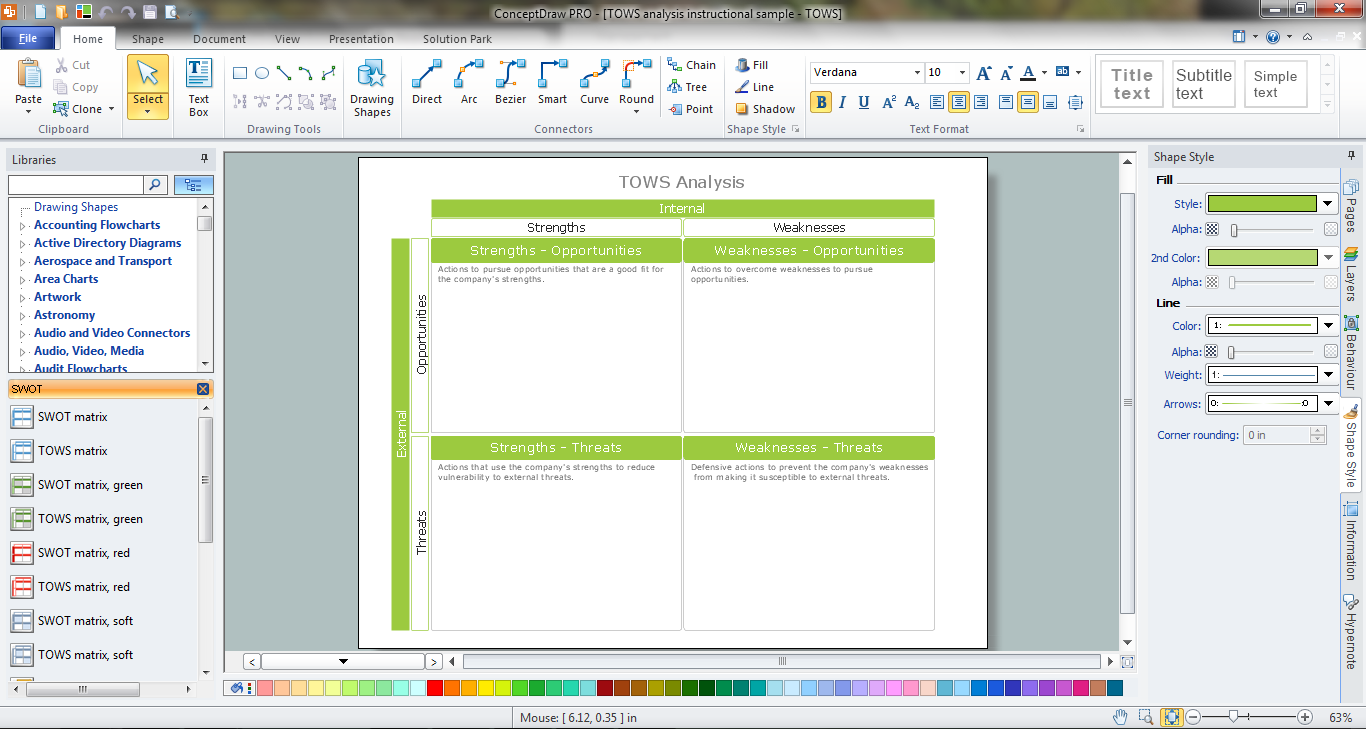
Picture: TOWS Matrix
Related Solution:
How to draw Metro Map style infographics of New York subway.
New York Subway has a long history starting on October 27, 1904. Since the opening many agencies have provided schemes of the subway system. At present time are 34 lines in use. This page present New York City subway map construct with Metro Map Solution in Conceptdraw DIAGRAM software. This is a one-click tool to add stations to the map. It lets you control the direction in which you create new stations, change lengths, and add text labels and icons. It contains Lines, Stations, and Landmarks objects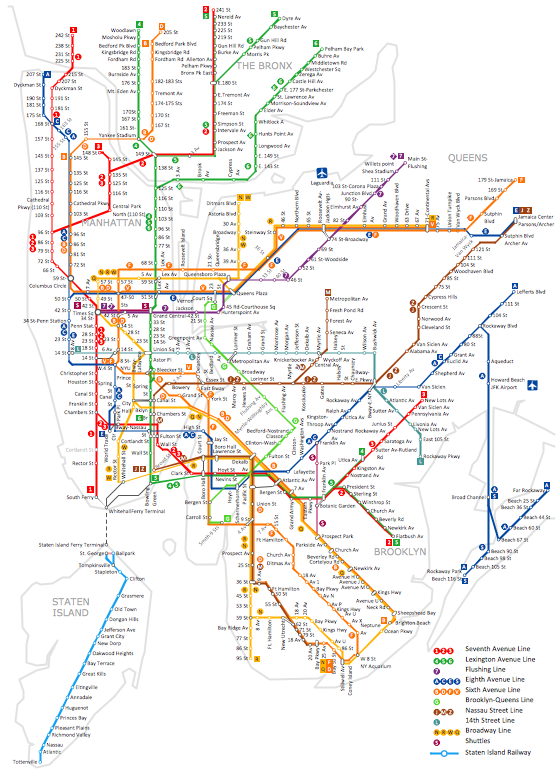
Picture: How to draw Metro Map style infographics? (New York)
Related Solution:
There are many tools to manage a process or to illustrate an algorithm or a workflow. Flowcharting is one of those tools. However, it may be difficult to show complex processes that require multiple attributes or several people in a simple flowchart, so a cross-functional flowchart would be a solution for that situation. To create such flowchart, group processes and steps to labeled rows or columns, and divide those groups with horizontal or vertical parallel lines. It is worth mentioning that there are different types of cross-functional flowcharts, like opportunity or deployment flowchart.
This diagram shows a cross-functional flowchart that was made for a trading process. It contains 14 processes, distributed through 5 lines depicting the participants who interact with the process. Also there are connectors that show the data flow of information between processes. The cross-functional flowchart displays a detailed model of the trading process, as well as all participants in the process and how they interact with each other. The lines in the flowchart indicates the position, department and role of the trading process participants.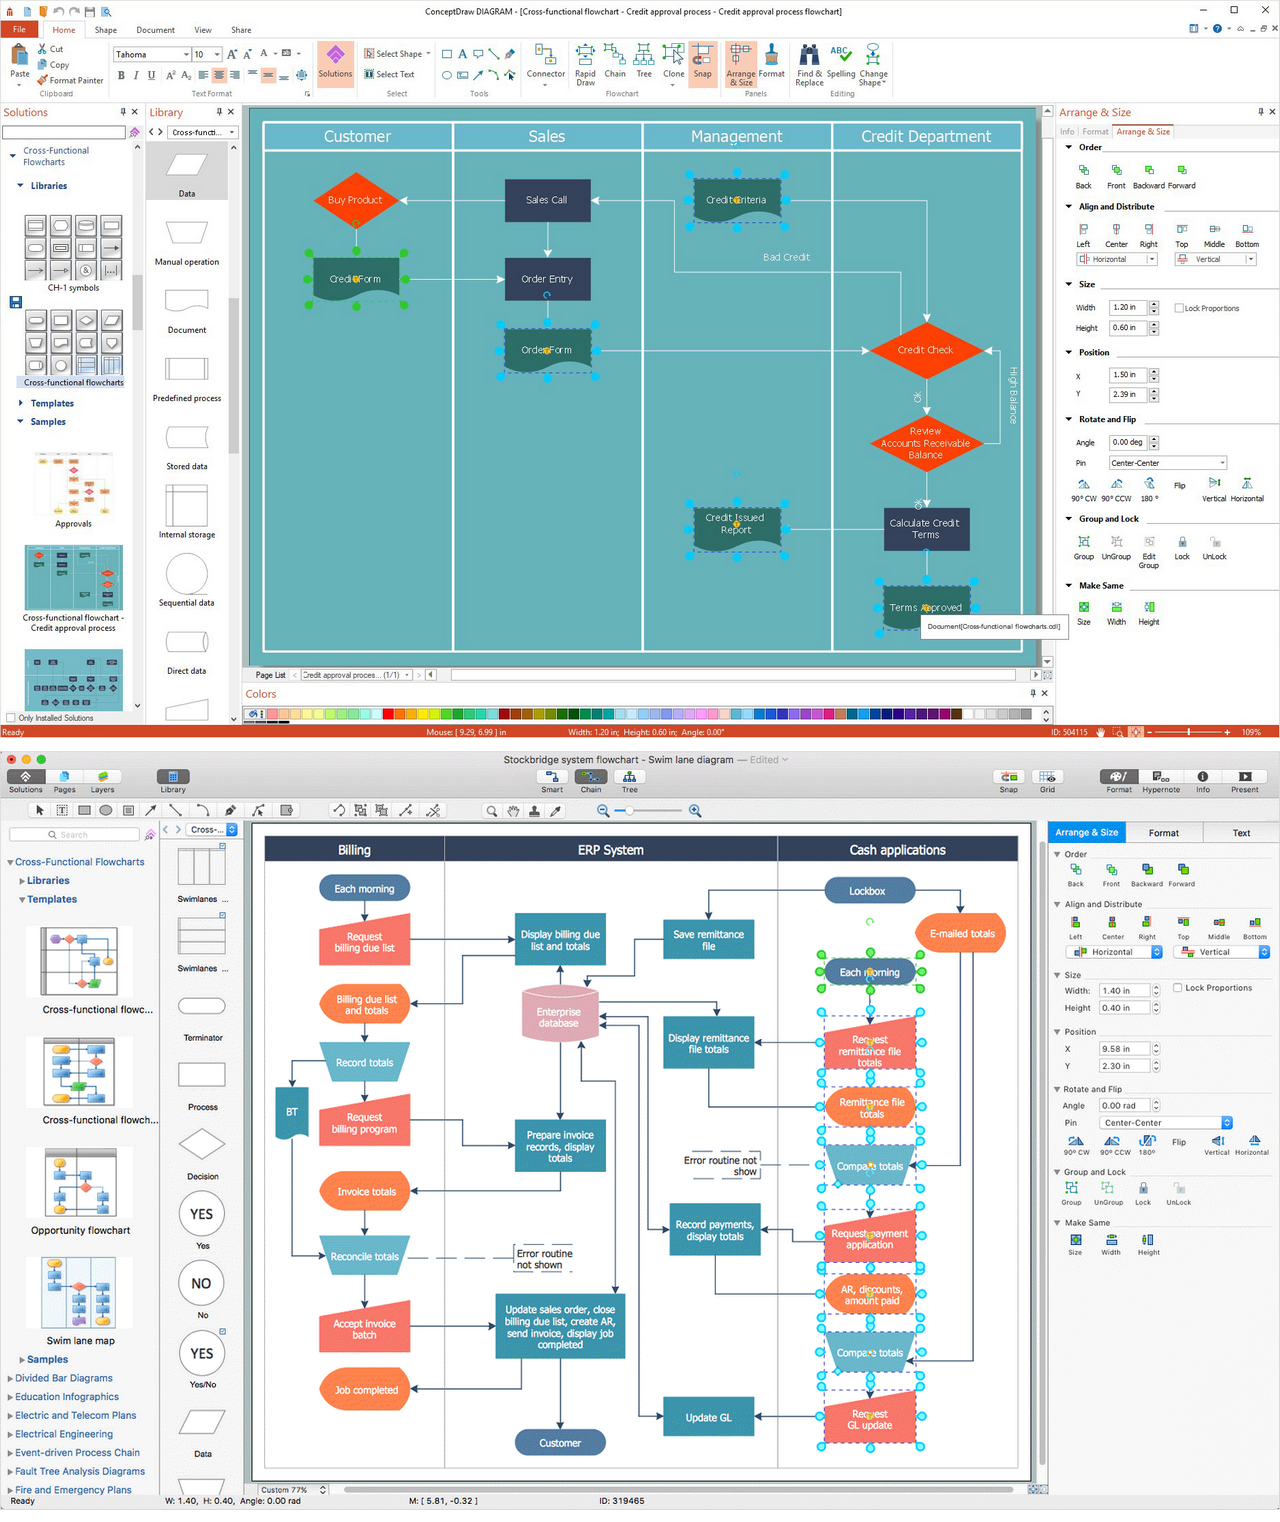
Picture: Cross-Functional Flowchart
Related Solution:
Infographics can be created with the help of ConceptDraw DIAGRAM diagramming and drawing software same way any other scheme or flowchart can be made: by using the appropriate solution taken from the ConceptDraw STORE application which consists of the needed tools such as the stencil libraries with the design elements that all can be used by the ConceptDraw DIAGRAM users.
Picture: Information Graphics
Related Solution:
Over the past few centuries, data visualization has evolved so much that we use it every day in all areas of our lives. Many believe that infographic is an effective tool of storytelling, as well as analytics, and that it is able to overcome most of the language and educational barriers. Understanding the mechanisms of human perception will help you to understand how abstract forms and colors used in data visualization can transmit information more efficient than long paragraphs of text.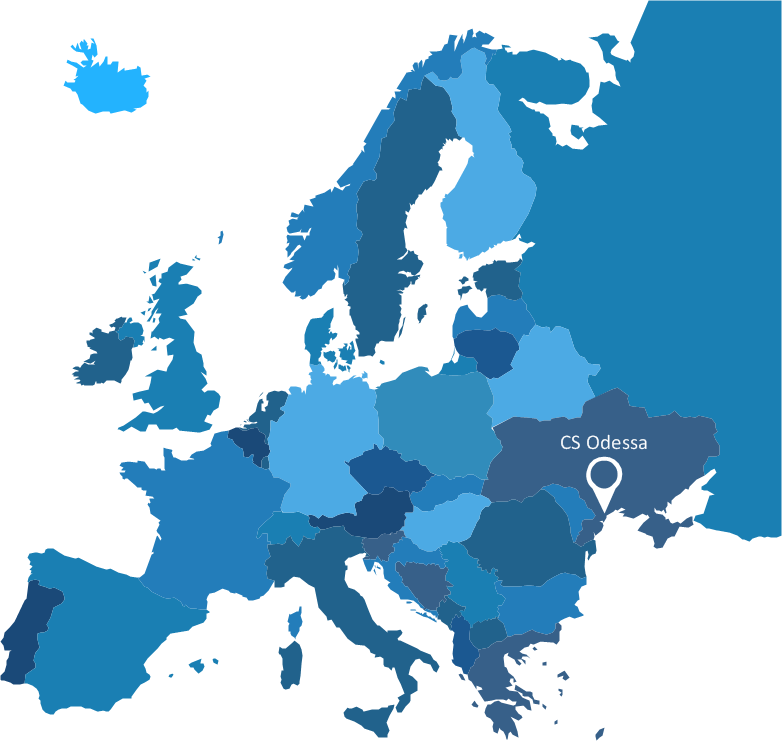
Picture: Tools to Create Your Own Infographics
The vector stencils library Industrial transport contains clipart of industrial vehicles for ConceptDraw DIAGRAM diagramming and vector drawing software.
Use it to draw illustrations of industrial vehicles, transportation, lifting and moving materials using machines.
Picture: Industrial transport - Design elements
Related Solution:
The critical importance of house electrical plans. 🔸 Learn how to create efficient electrical layouts using the ConceptDraw DIAGRAM app. Enhance ✔️ safety, ✔️ functionality, and ✔️ compliance with electrical codes in your home projects with our comprehensive guide
Picture:
Importance of House Electrical Plans.
How to Create Electrical Layouts
with ConceptDraw DIAGRAM App
Related Solution: