Create a Flow Chart
ConceptDraw DIAGRAM is a powerful business and technical diagramming software tool that enables you to design professional-looking graphics, diagrams, flowcharts, floor plans and much more in just minutes. Maintain business processes performance with clear visual documentation. Effectively present and communicate information in a clear and concise manner with ConceptDraw DIAGRAM
Start creating your own flowcharts with ConceptDraw DIAGRAM and accomplish great results in the moment. The software contains built-in object libraries of vector stencils that allow you use RapidDraw technology.
Sample 1. RapidDraw Flowchart Template
Clicking on direction arrows you can add new objects to the flowchart. Users can start drawing their own flowchart diagrams in fast and simple way.
ConceptDraw DIAGRAM is the only professional diagramming software that works on both Windows and Macintosh platforms. All its documents and libraries are 100% compatible and can be exchanged hassle-free between the platforms.

Sample 1. Flow Charts
With ConceptDraw Office ConceptDraw DIAGRAM provides you with the tools you need to generate reports documentation and presentations that entirely reflect project performance.
Comprehensive tools for information visualization
Vector Drawing Tools
The huge set of vector drawing tools can compete with any professional illustration program. Customizable Grid and Snap tools help to position your shapes precisely. Alignment, Distribution and Make Same tools will automate routine operations with multiple shapes.
Libraries and Cliparts
Wide collections of shapes and Cliparts help you create a different types of diagrams, such as Business Process, Network Diagram, Organization Chart as well as various sorts of technical drawings.
Smart Connectors and Custom Connection Points
Lines stay linked to their shapes, so you don't need to redraw your diagram every time you move something. Smart connectors can follow shapes around, as well as display gaps or bridges where they cross other connectors. Every shape can be turned into a connector. You can easily add connection points to any part of the shape.
Layers and Texture fill
You can use unlimited number of layers to organize related shapes in one document page. Use one of the preset textures fill to create professionally looking objects.
Presentation mode
With Presentation Mode you can perform an attractive full screen presentation from ConceptDraw documents without a need to use any special application.
TEN RELATED HOW TO's:
Acquaintance with flowcharting starts from getting into basic terms. First of all, flowchart definition is quite clear – a flowchart is a graphical representation of a process or an algorithm made of special symbols. Secondly, flowcharting is an irreplaceable tool for IT specialists, project managers, and anyone who wants a clear understanding of any imaginable process.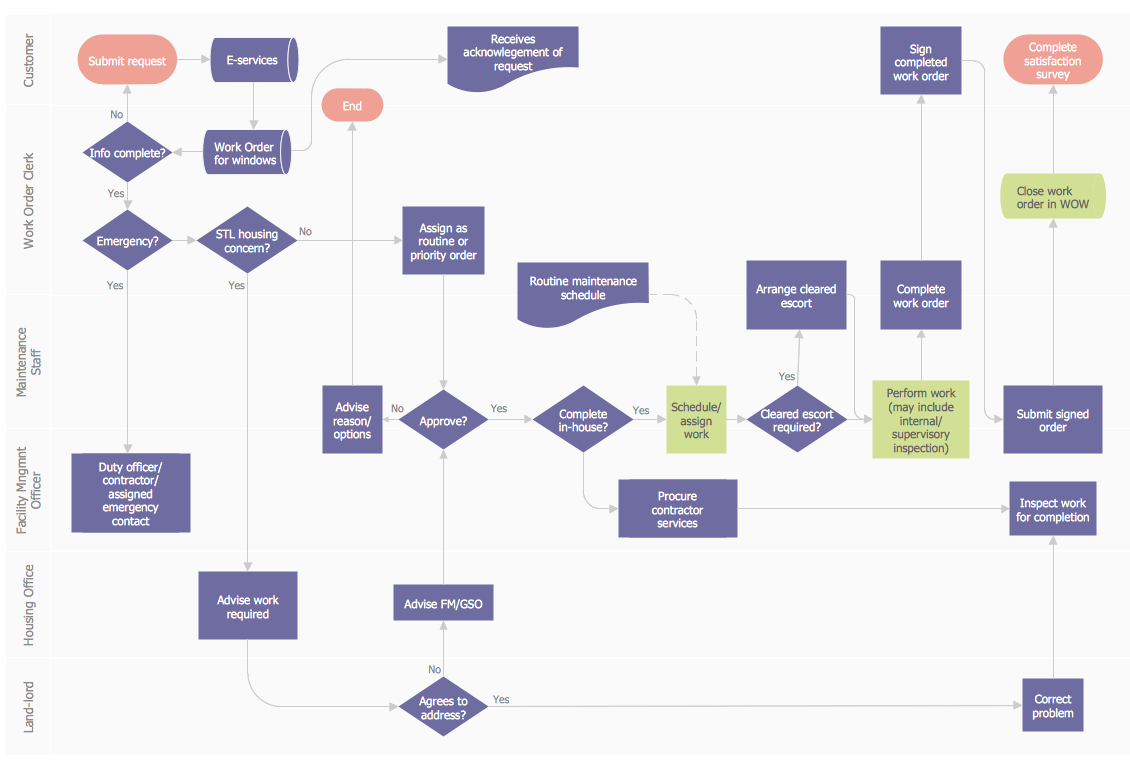
Picture: Flowchart Definition
Related Solution:
The world-best Entity Relationship Diagram software suitable for professional ERD drawing is ConceptDraw DIAGRAM software extended with the Entity-Relationship Diagram (ERD) solution. This solution contains all libraries, templates and samples you may need for professional ERD drawing.
Picture: Entity Relationship Diagram Software
Related Solution:
ConceptDraw provides some interactive xy chart and scatter graph symbols that offers advanced features yet is simple to use.
Picture: Scatter Graph Charting Software
Related Solution:
A triangular graphic representing Graham's hierarchy of disagreement, based on Paul Graham's March 2008 essay How to Disagree.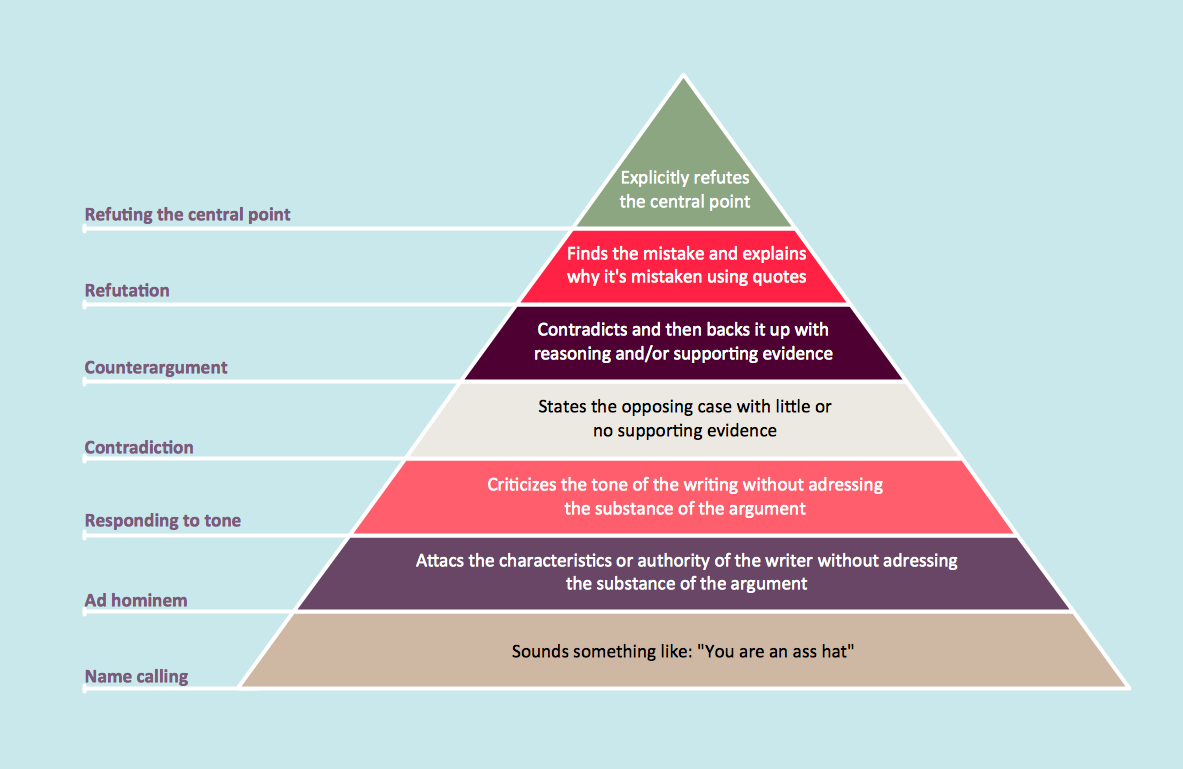
Picture: Pyramid Diagram
Related Solutions:
The Total Quality Management Diagram solution helps you and your organization visualize business and industrial processes. Create Total Quality Management diagrams for business process with ConceptDraw software.
Picture: Organizational Structure Total Quality Management
Related Solution:
Cisco Intelligent Services Gateway ISG
Picture: Cisco Intelligent Services Gateway
Related Solution:
Using the Business Diagrams Solution you can create your own professional-looking Venn Diagrams quick and easy.
Picture: 3 Circle Venn Diagram. Venn Diagram Example
Related Solution:
ConceptDraw gives the ability to draw Flowchart documents. Flowcharts solutionis a powerful tool that extends ConceptDraw application for drawing business flowcharts.
ConceptDraw DIAGRAM vector diagramming and business graphics software enhanced with with templates, green and interactive flowchart makers, samples and stencil libraries from ConceptDraw Solution Park which all focused to help with drawing flowcharts, block diagrams, bar charts, histograms, pie charts, divided bar diagrams, line graphs, area charts, scatter plots, circular arrows diagrams, Venn diagrams, bubble diagrams, concept maps, and others.
Picture: The Best Flowchart Software Available
Related Solution:
A flowchart can take any process and distil it into a series of actions or decisions; it is a versatile and simple form of diagram that can be used to describe situations in any field, and is easily understood by everyone. They are used frequently in business to document workflows from all areas of a company - they can show accounting purchase orders, human resource recruitment strategy, or a product life cycle.
ConceptDraw DIAGRAM diagramming and vector drawing software extended with Flowcharts Solution from the Diagrams Area of ConceptDraw Solution Park is a perfect powerful tool for extremely easy designing professional looking Flow Diagram.
Picture: Flow Diagram
Related Solution:
