Create Process Flowcharts
What is a Process Flowchart?
A process flowchart is a picture of the separate steps of a process in sequential order.
When to Use a Flowchart:
- Analyzing complex processes
- Designing complex processes
- Communication in Complex processes
- Managing complex processes
- Representing process operations
- Plan the process steps
Use ConceptDraw DIAGRAM
ConceptDraw DIAGRAM is Process Flowcharts creating software. The built-in examples allow users to start drawing any type of flowchart simply. The vector stencils from object libraries are designed objects you can use adding to process flowcharts for the best result.
Commonly Used Symbols in Detailed Process Flowcharts:
| Symbol |
Shape Name |
Symbol Description |
| Common Symbols |
 |
Process |
Show a Process or action step. This is the most common symbol in both process flowcharts and business process maps |
 |
Flow Line (Arrow, Connector) |
Flow line connectors show the direction that the process flows |
 |
Decision |
Indicates a question or branch in the process flow. Typically, a Decision flowchart shape is used when there are 2 options (Yes/No, No/No-Go, etc.) |
 |
Connector (Inspection) |
In process maps, this symbol is full sized and shows an Inspection point in the process flow |
 |
Document |
Pretty self explanatory - the Document flowchart symbol is for a process step that produces a document |
 |
Delay |
The Delay flowchart symbol depicts any waiting period that is part of a process. Delay shapes are common in process mapping |
Process Flowchart Example
This flowchart sample provides a structure for business analysis that identifies a set of common stages in the life of a commercial product. This diagram is visually divided by blocks that describe the life cycle phases. For easier reading of the process definition each shape has its own color.
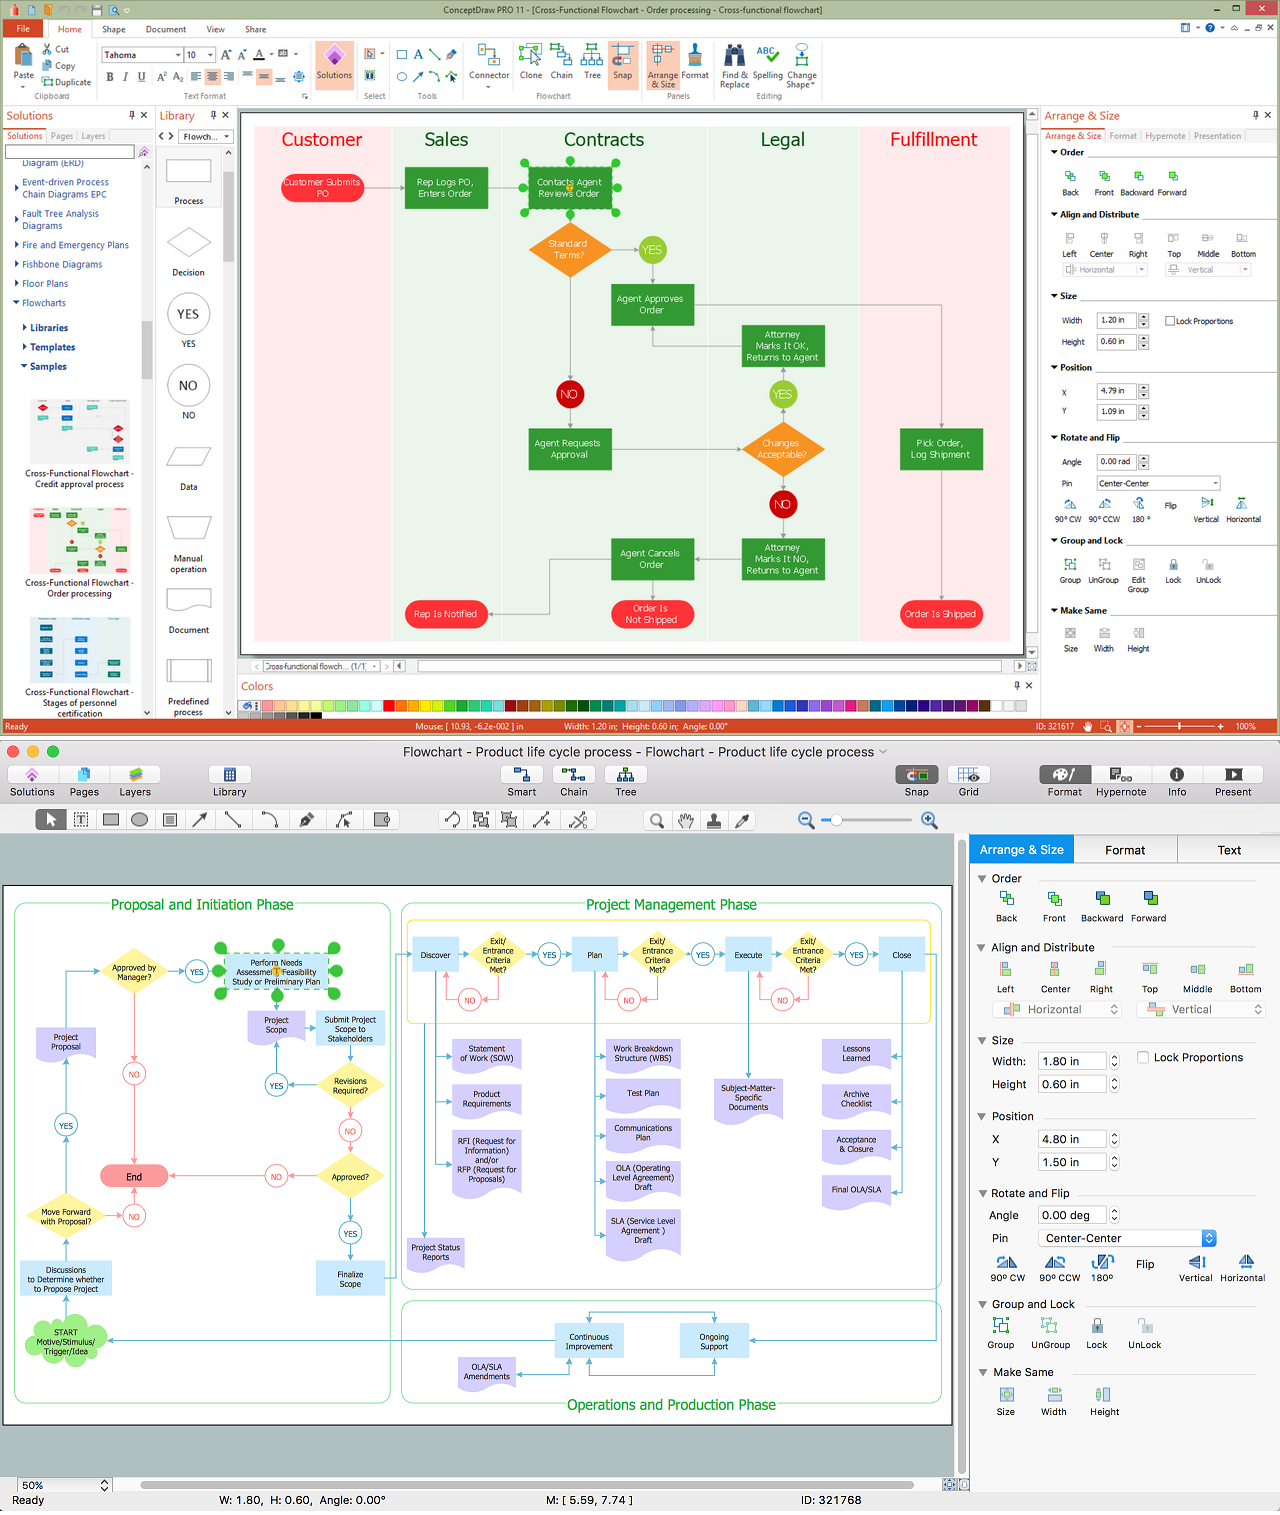
Example 1. Process Flowchart: Product life cycle process
Product life cycle is a business analysis that attempts to identify a set of common stages in the life of commercial products, for example, introduction, promotion, growth, maturity and decline. (Product lifecycle, Wikipedia)
Use ConceptDraw DIAGRAM software for drawing your own product life cycle flowcharts.
TEN RELATED HOW TO's:
The Ring Network Topology Diagram examples was created using ConceptDraw DIAGRAM software with Computer and Networks solution.
Picture: Ring Network Topology
Related Solution:
To design the professional looking flowchart diagrams use ConceptDraw DIAGRAM software extended with Flowchart maker solutions.
Picture: Flowchart Software
Related Solution:
The Total Quality Management Diagram solution helps you and your organization visualize business and industrial processes. Create Total Quality Management diagrams for business process with ConceptDraw software.
Picture: Organizational Structure Total Quality Management
Related Solution:
This sample was created in ConceptDraw DIAGRAM software using the Flowcharts solution.
Picture:
Copying Service Process Flowchart.
Flowchart Examples
Related Solution:
This sample was created in ConceptDraw DIAGRAM diagramming and vector drawing software using the Business Process Diagram Solution from the Business Processes area of ConceptDraw Solution Park. The Business Process Solution is based on the standard BPMN 2.0 and includes the set of libraries of ready-to-use objects.
Picture: BPR Diagram. Business Process Reengineering Example
Related Solution:
Easy charting software comes with beautiful chart templates and examples. This makes it easy to create professional charts without prior experience.
Picture: Chart Examples
Related Solutions:
Create flowcharts, flow charts, and more with ConceptDraw flowchart software.
Picture: Basic Diagramming. Flowchart Software
Related Solution:
To draw a good diagram of a business workflow you should have a ready-to-use set of pre-designed objects you may drag-and-drop to your document focusing on the workflow structure and meaning, not drawing tools. ConceptDraw DIAGRAM with Workflow Diagrams solution provides complete set of design element you may use to draw a good diagram of a business workflow.
Picture: How to Draw a Good Diagram of a Business Workflow?
Related Solution:
The most easier way of creating the visually engaging and informative Sales Process Flowchart is to create the new ConceptDraw document and to use the predesigned vector symbols offered in 6 libraries of the Sales Flowchart Solution. There are more than six types of sales process flow diagrams, ConceptDraw DIAGRAM software is flowchart maker which include six collections of extended flowchart symbols for effective diagramming. There are main collections of color coded flowchart symbols: Sales Department, Sales Steps, Sales Workflow, Sales Symbols and special set of Sales Arrows and Sales Flowchart.
Picture: Sales Process Flowchart Symbols
Related Solution: