
Sample 1. Diagram Flow Chart: Selection sorting method.
"In mathematics and computer science, an algorithm ... is a step-by-step procedure for calculations. Algorithms are used for calculation, data processing, and automated reasoning.
An algorithm is an effective method expressed as a finite list of well-defined instructions for calculating a function. Starting from an initial state and initial input (perhaps empty), the instructions describe a computation that, when executed, proceeds through a finite number of well-defined successive states, eventually producing "output" and terminating at a final ending state. The transition from one state to the next is not necessarily deterministic; some algorithms, known as randomized algorithms, incorporate random input." [Algorithm. Wikipedia]
The algorithm flow chart example "Selection sorting method" was created using the ConceptDraw DIAGRAM diagramming and vector drawing software extended with the Flowcharts solution from the area "Diagrams" of ConceptDraw Solution Park.
TEN RELATED HOW TO's:
Create flowcharts, flow charts, and more with ConceptDraw flowchart software.
Picture: Basic Diagramming. Flowchart Software
Related Solution:
This sample shows the Booch OOD diagram of the environment. The Booch method (developed by Grady Booch) is an object modeling language and methodology used in software engineering.
This sample was created in ConceptDraw DIAGRAM diagramming and vector drawing software using the Rapid UML Solution from the Software Development area of ConceptDraw Solution Park.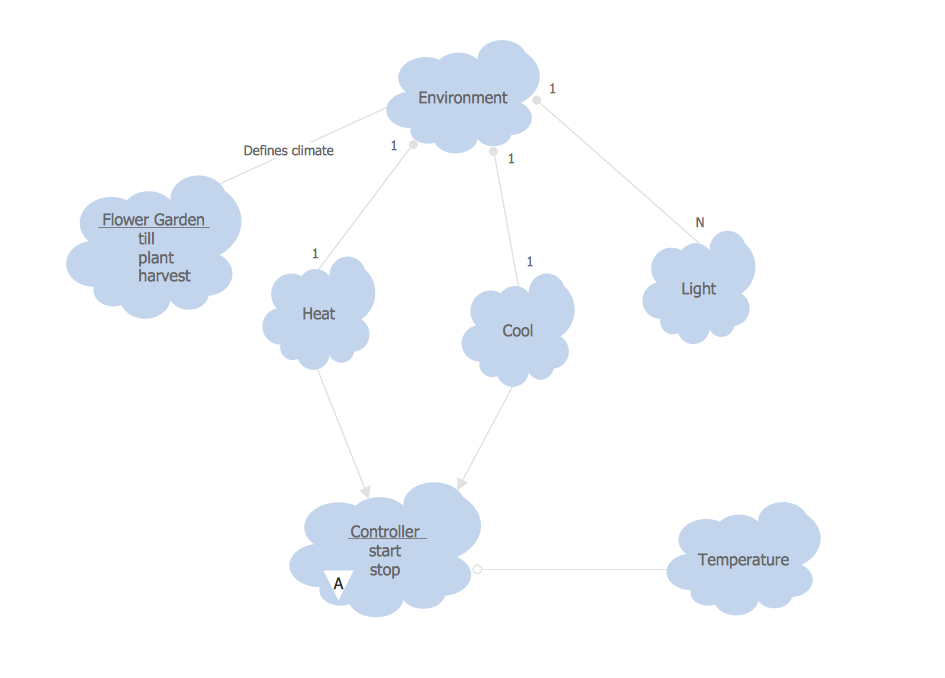
Picture: Object-Oriented Development (OOD) Method
Related Solution:
How to draw pictorial chart quick, easy and effective? ConceptDraw DIAGRAM offers the unique Pictorial Infographics Solution that will help you!
Pictorial Infographics solution contains large number of libraries with variety of predesigned vector pictograms that allows you design infographics in minutes. There are available 10 libraries with 197 vector pictograms.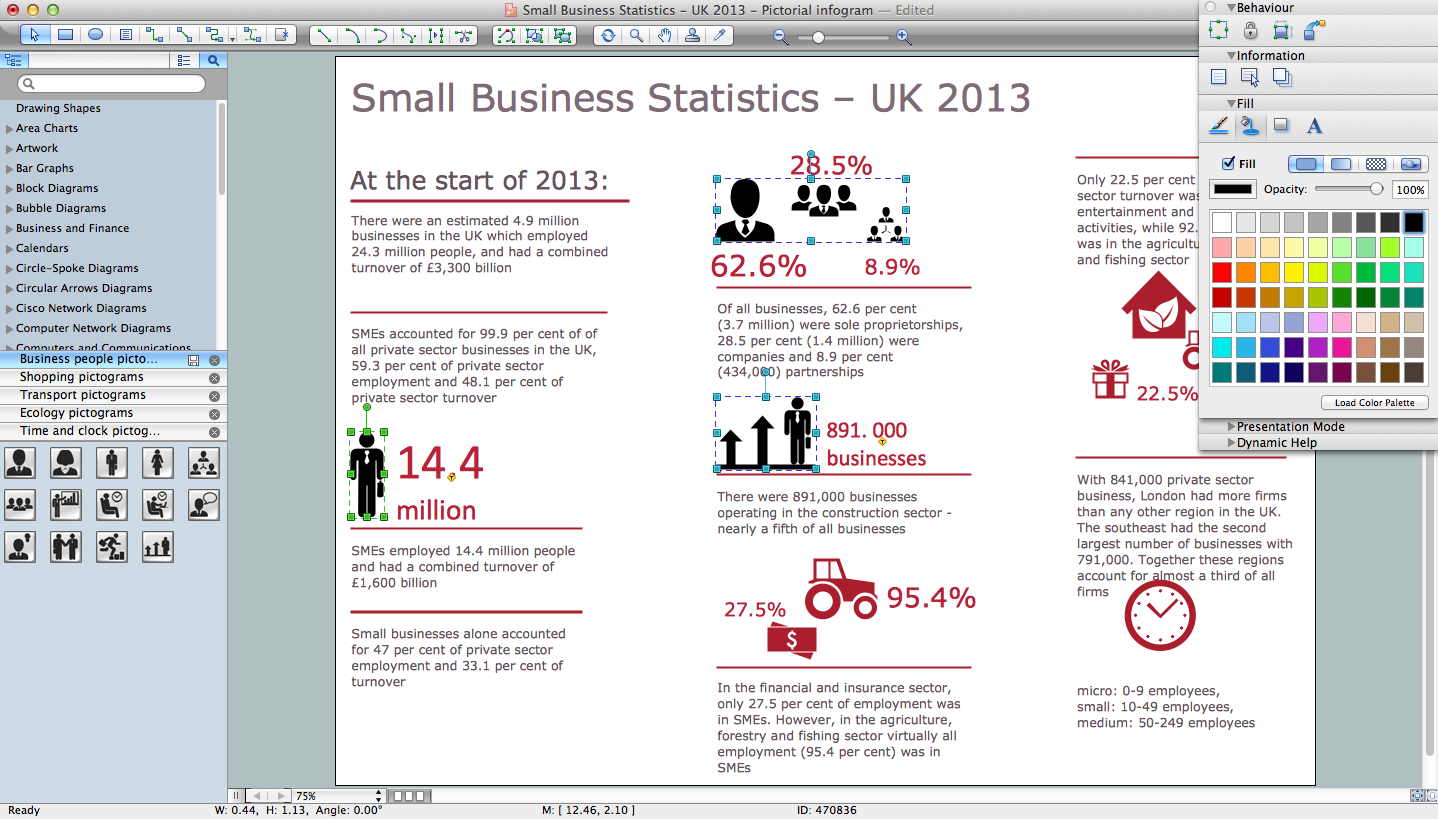
Picture: How to Draw Pictorial Chart. How to Use Infograms
Related Solution:
For vector shapes and connector tools for quick and easy drawing diagrams for business, technology, science and education - The best choice for Diagramming is ConceptDraw DIAGRAM.
Picture: Diagram Software - The Best Choice for Diagramming
The excellent possibility to create attractive Cross Functional Flowcharts for step-by-step visualization the operations of a business process flow of any degree of detailing is offered by ConceptDraw’s Cross-Functional Flowcharts solution. The extensive selection of commonly used vector cross functional flowchart symbols allow you to demonstrate the document flow in organization, to represent each team member’s responsibilities and how processes get shared or transferred between different teams and departments.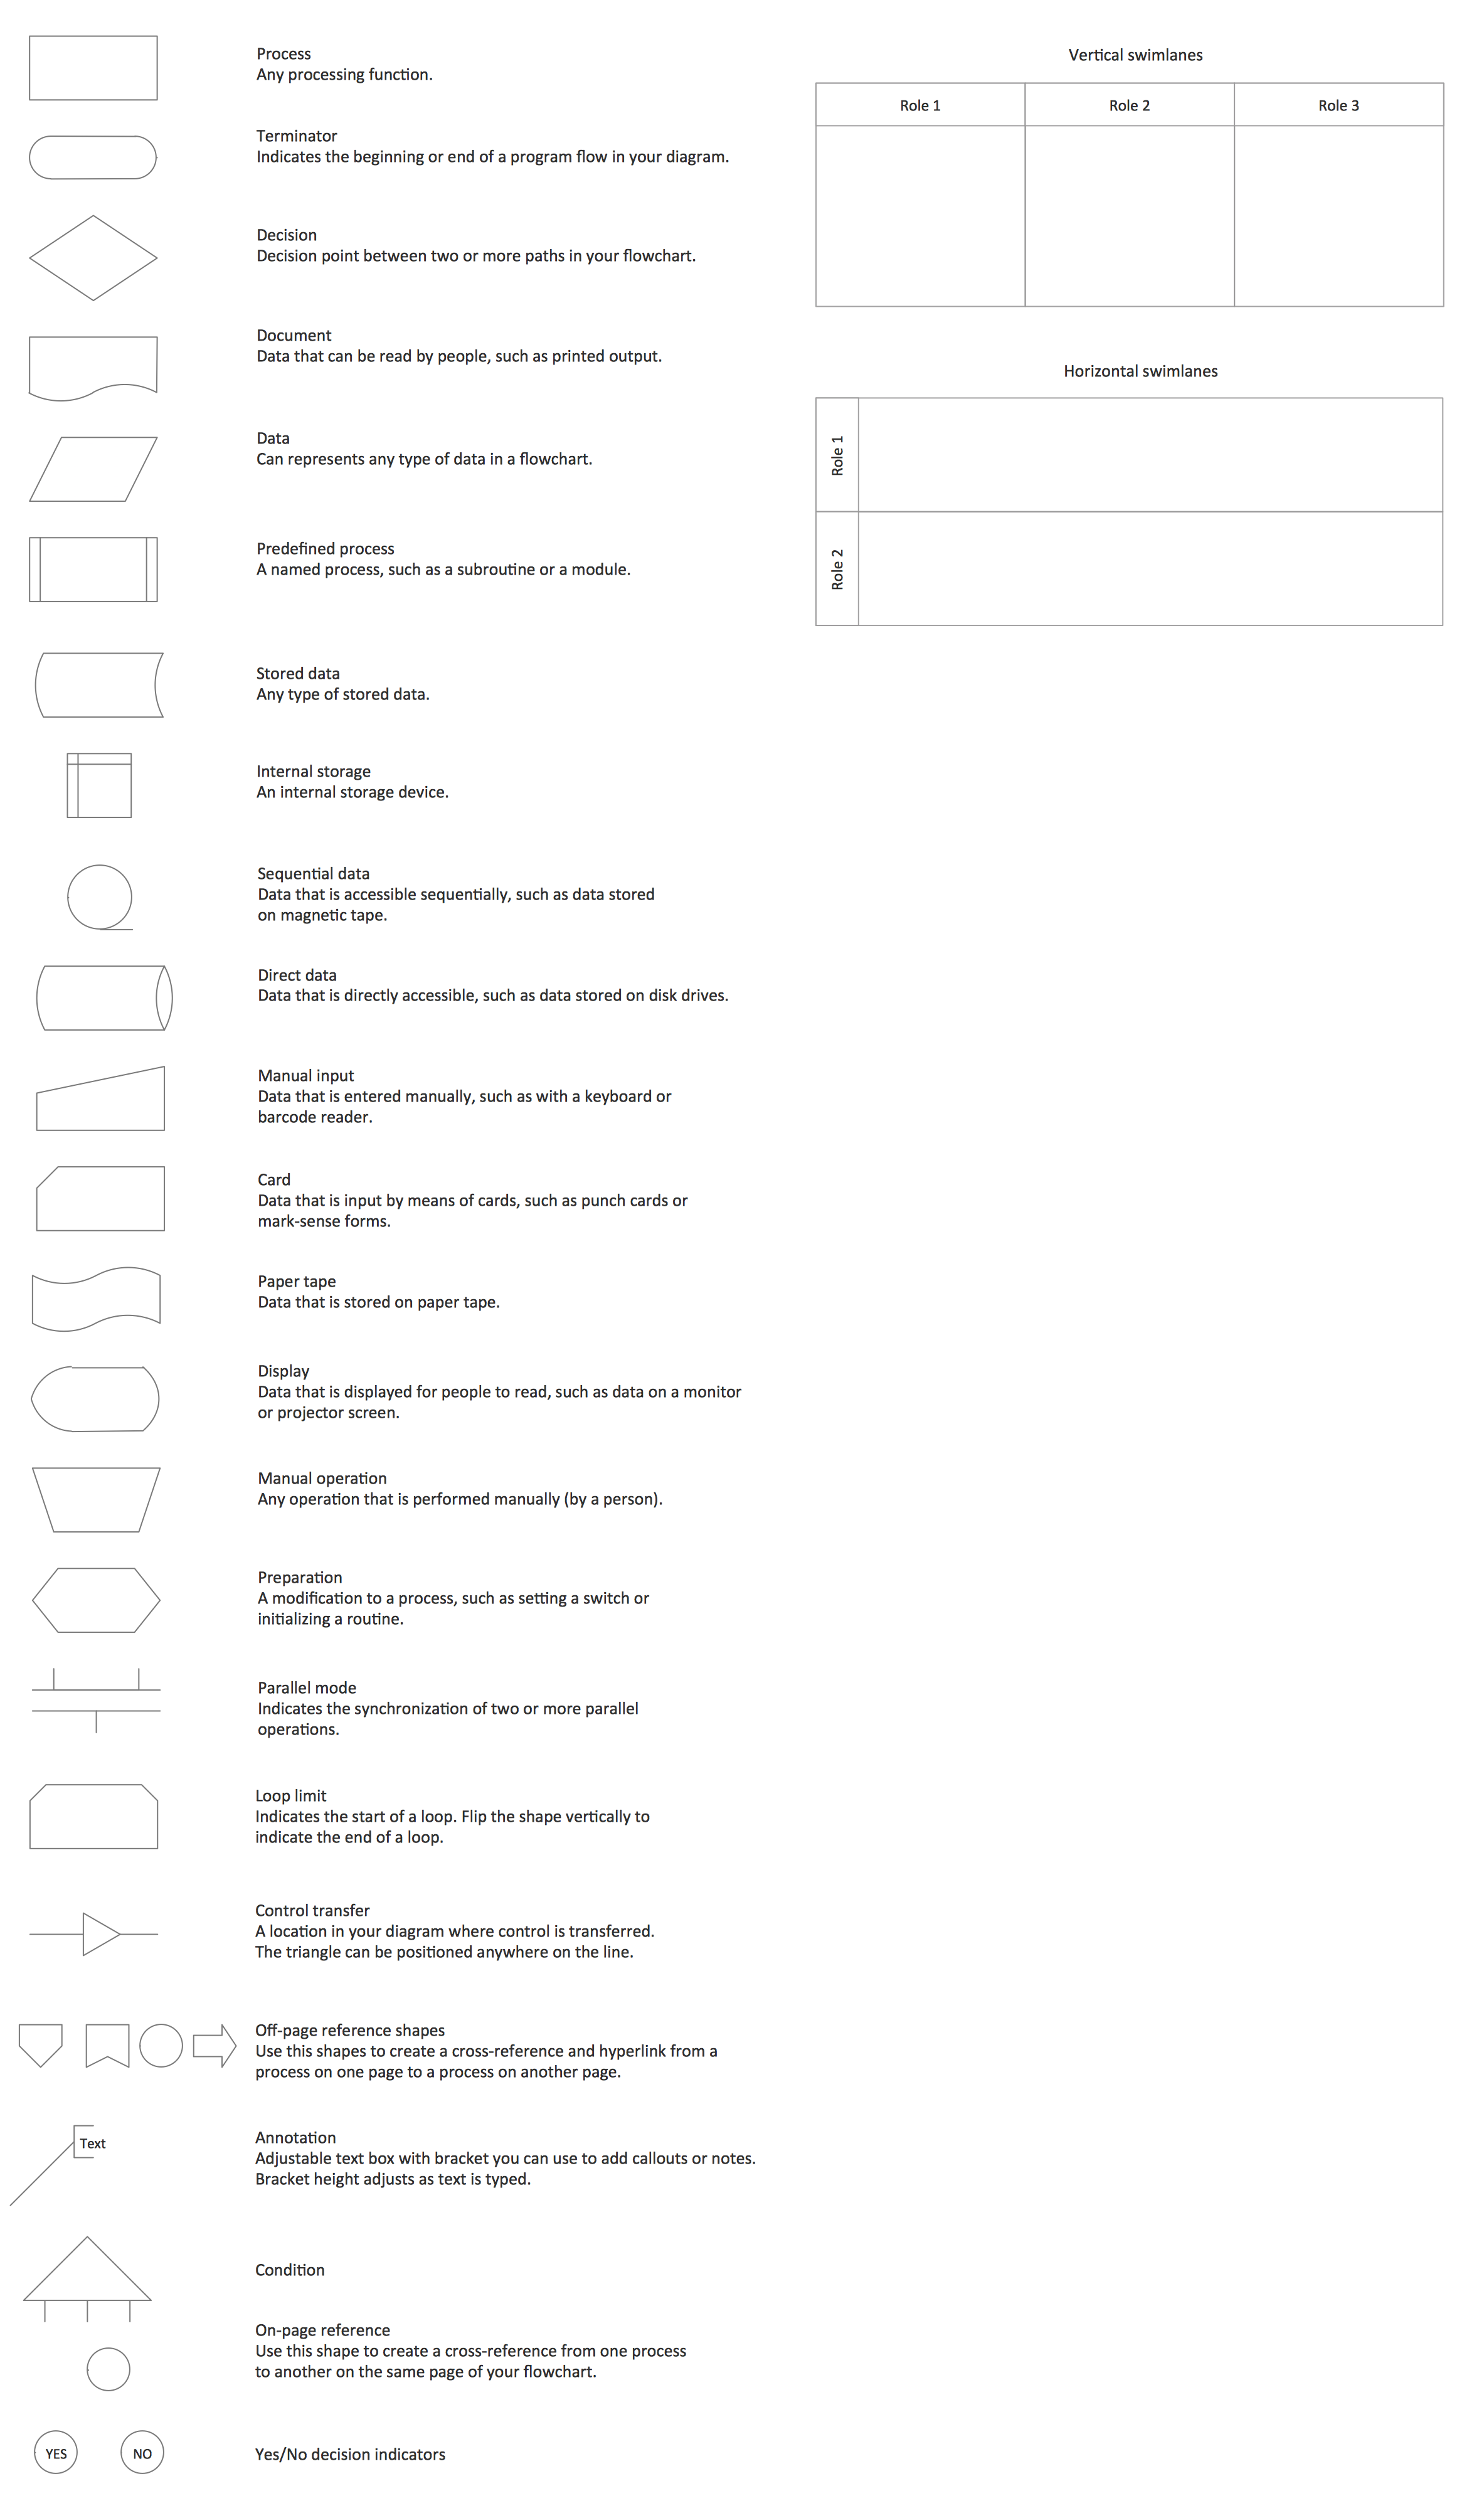
Picture: Cross Functional Flowchart Symbols
Related Solution:
Describing a workflow or approval process can take hours and be too complicated, especially since there are options to do it quickly and vividly. Diagrams called flowcharts replace long paragraphs of boring text and represent information in a graphic way. You can draw one on paper or you can use flowchart software to do it quickly and scalable. This kind of software is easy to use and you don’t need any special skills to start using it. In addition, there are a lot examples and predesigned templates on the Internet.
Flowcharts are a best tool for staking out a huge and complex process into some small readable parts. Surely, flowcharts can be drawn manually but the use of standard symbols that make it clear for a wide audience makes a software tool preferred for this task. The core for a successful flowchart is its simplicity. That is why often before beginning making flowchart through software, people draw the sketch on a piece of paper. Designing an effective flowchart means the combination of the data needed to be shown and the simplicity with which you depict it.
Picture: Flowchart Software: A Comprehensive Guide
Related Solution:
The Rapid UML solution from Software Development area of ConceptDraw Solution Park includes 13 vector stencils libraries for drawing the UML 2.4 diagrams using ConceptDraw DIAGRAM diagramming and vector drawing software.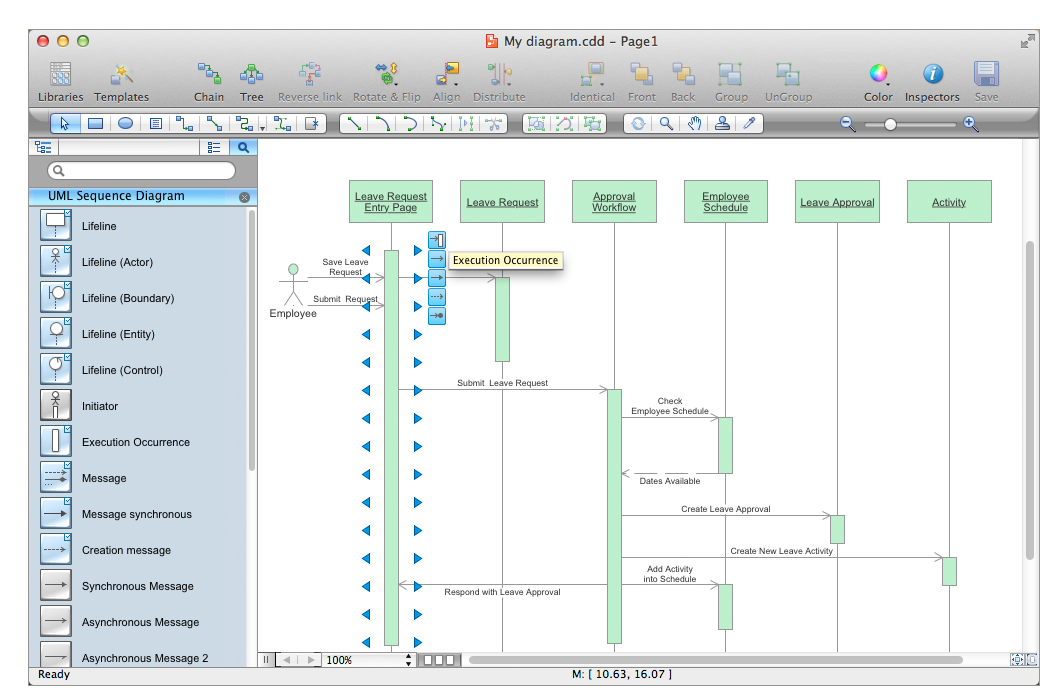
Picture: Design Elements for UML Diagrams
Related Solution:
Flowcharts visualize a process or algorithm of program as step/operation blocks of various shapes connected with arrowed lines showed the process flow direction. They are used to visualize business or technical processes and software algorithms.
Conceptdraw DIAGRAM - feature-rich flowchart software. It will allow you to create professional looking flowcharts.
Picture: Best Flowcharts
Related Solution:
Download ConceptDraw diagram software for easy drawing.
Picture: The Best Choice for Creating Diagram
Related Solution:
ConceptDraw DIAGRAM extended with Divided Bar Diagrams solution from Graphs and Charts area of ConceptDraw Solution Park is the best software for quick and simple drawing the Divided Bar Diagrams and Bar Diagram Math.
Picture: Bar Diagram Math
Related Solution: