Example Process Flow
What is a Process Flowchart?
A flowchart is a picture of the separate steps of a process in sequential order.
Elements: materials or services entering or leaving the process (inputs and outputs), sequence of actions, time involved at each step and/or process measurements, decisions that must be made, people who become involved.
The process described: a manufacturing process, an administrative or service process, a project plan. This is a generic tool that can be adapted for a wide variety of purposes.
When to Use a Flowchart
- Analyzing complex processes
- Designing complex processes
- Documenting complex processes
- Managing complex processes
- Representing process operations
- Showing the steps
- Diagrammatic representation solution to a given problem
- Represented Process operations
- Helping to visualize a process
- Helping to understand a process
Use ConceptDraw DIAGRAM
ConceptDraw DIAGRAM is a Process Flowcharts software. This software includes basic package of process flow examples. The software contains object libraries with vector stencils that allows you use RapidDraw technology. By clicking on direction arrows you can add a new object to the flowchart.

Sample 1. Flowchart sample: Website launch.
This flow chart example visualizes business process of website launch.
Use ConceptDraw DIAGRAM diagramming and business graphics software to draw your own business process flowcharts.
See also:
TEN RELATED HOW TO's:
No need for any special drawing skills to create professional looking diagrams outside of your knowledge base. ConceptDraw DIAGRAM takes care of the technical side.
Use templates, samples and special libraries for your needs.
Picture: How To Create Professional Diagrams
Garrett IA diagrams are used at development of Internet-resources, in particulars at projecting of interactions of web-resource elements. The diagram of information architecture of the web resource which is constructed correctly with necessary details presents to developers the resource in comprehensible and visual way.
Picture: Garrett IA Diagrams with ConceptDraw DIAGRAM
Our DFD software ConceptDraw DIAGRAM allows you to quickly create DFD with data storages, external entities, functional transforms, data flows, as well as control transforms and signals. DFD program ConceptDraw DIAGRAM has hundreds of templates, and a wide range of libraries with all nesassary ready-made drag-and-drop.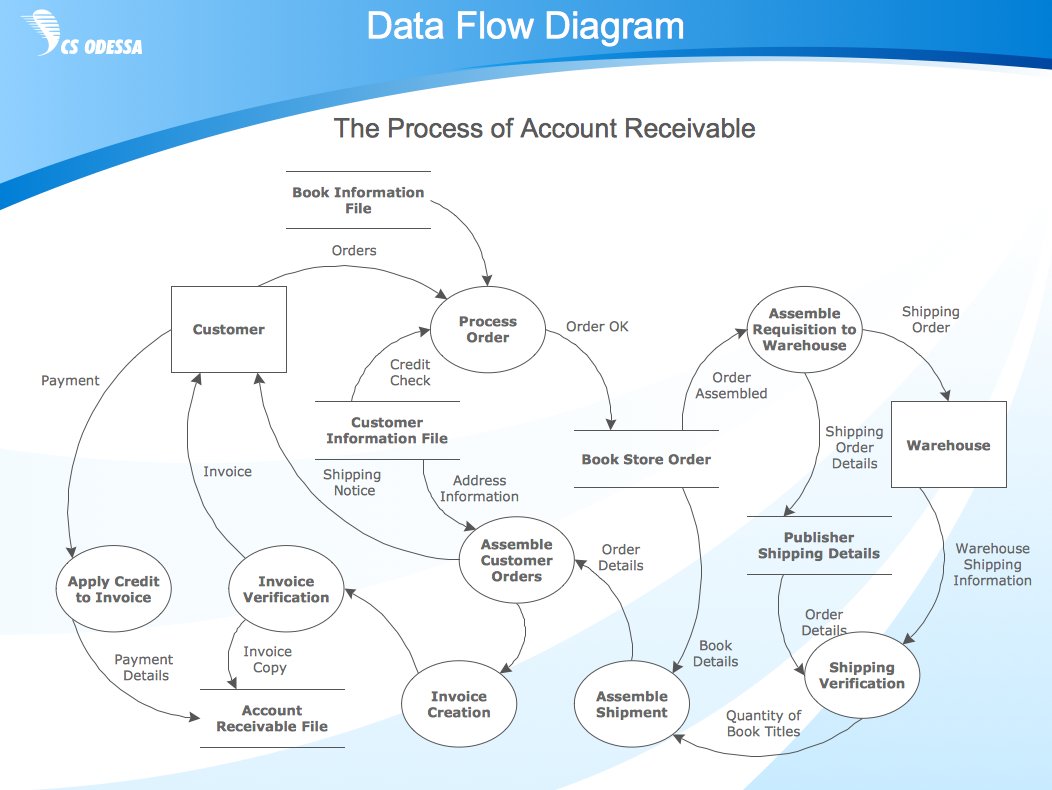
Picture: ConceptDraw DIAGRAM DFD Software
ConceptDraw DIAGRAM diagramming and vector drawing software enhanced with Fishbone Diagrams solution from the Management area of ConceptDraw Solution Park gives the ability to draw Fishbone diagram, which identifies many possible causes for an effect for problem solving. Fishbone Diagram procedure of creation includes the set of steps easy for execution in ConceptDraw DIAGRAM.
Picture: Fishbone Diagram Procedure
Related Solution:
Accounts Payable Process Flow Chart - ConceptDraw DIAGRAM diagramming and vector drawing software extended with Accounting Flowcharts Solution provides the useful tools that will help you create easily and quickly.
The Accounts Payable Process Flow Chart is very popular and widely used type of accounting flowcharts. Now their designing is simple thanks to the Accounting Flowcharts Solution that provides the Accounting Flowcharts library of predesigned commonly-used shapes and a set of templates and samples.
Picture: Accounts Payable Process Flow Chart
Related Solution:
Use ConceptDraw DIAGRAM with Accounting Flowcharts solution to document and communicate visually how accounting processes work, and how each operation is done.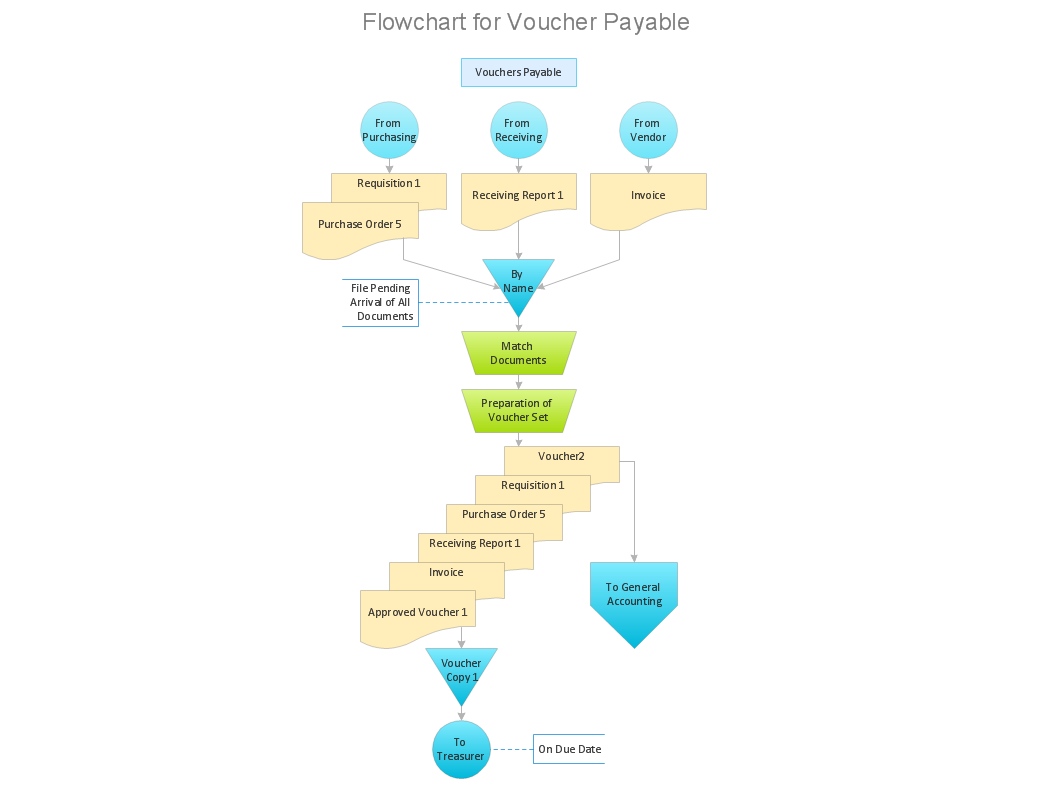
Picture: Accounting Flowchart: Purchasing, Receiving, Payable and Payment
Related Solution:
Describing the way data flows through an information system might become a subject of a study. One of the kinds on a data flow diagram is called Gane Sarson Diagram after its authors, and it slightly differs from other notations. Process symbols in this notation are depicted as rounded rectangles connected with arrows representing data flows.
This is a sample of data flow diagram. It demonstrates utilization of the Gane-Sarson notation for making DFD on the example of an online appointment system of the Health Centre. This sample is used the vector objects library of Gane-Sarson DFD notation supplied by the ConceptDraw solution for data flow diagramming. It contains all symbols of the Gane-Sarson notation including connectors, jumps, and processes. This solution can be successfully utilized to generate DFDs for business documentation, and presentations.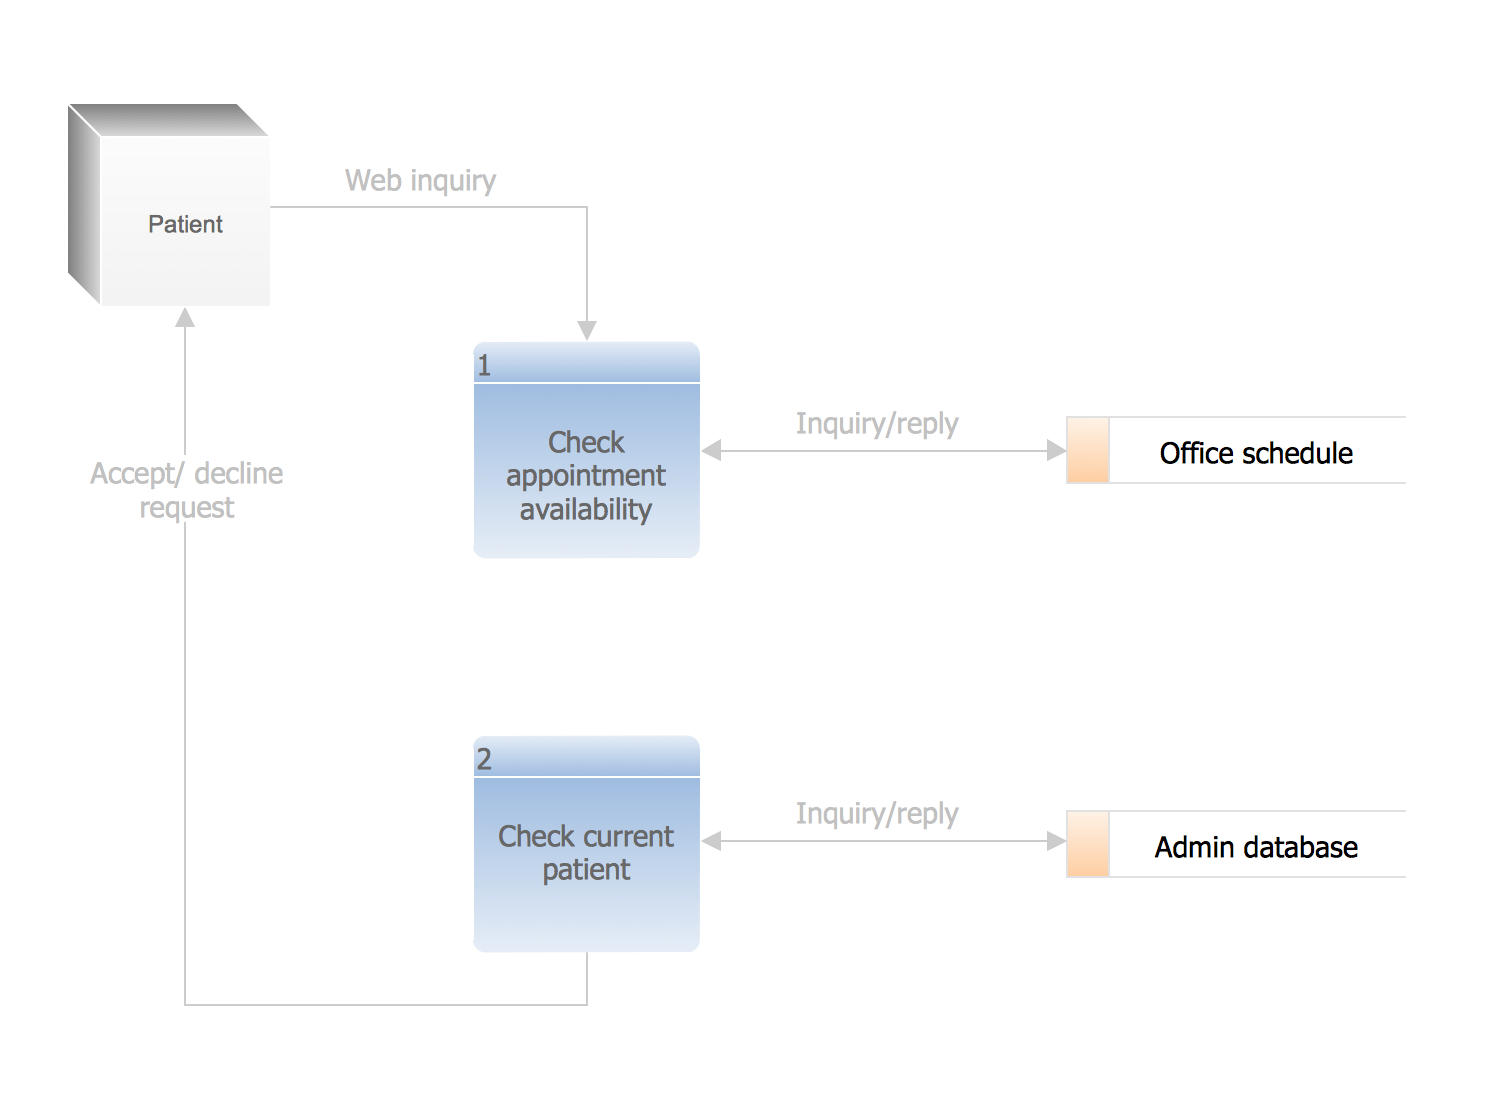
Picture: Gane Sarson Diagram
Tanzania, officially the United Republic of Tanzania (Swahili: Jamhuri ya Muungano wa Tanzania), is a country in East Africa in the African Great Lakes region.
The vector stencils library Tanzania contains contours for ConceptDraw DIAGRAM diagramming and vector drawing software. This library is contained in the Continent Maps solution from Maps area of ConceptDraw Solution Park.
Picture: Geo Map — Africa — Tanzania
Related Solution:
ConceptDraw DIAGRAM es una conocida y popular aplicación de gráficos de negocios y diagramas para Windows y Macintosh. Contiene potentes herramientas de dibujo vectorial, bibliotecas de gráficos con cientos de formas pre-dibujados, soporte para importación y exportación de numerosos formatos de archivos y muchas otras características profesionales.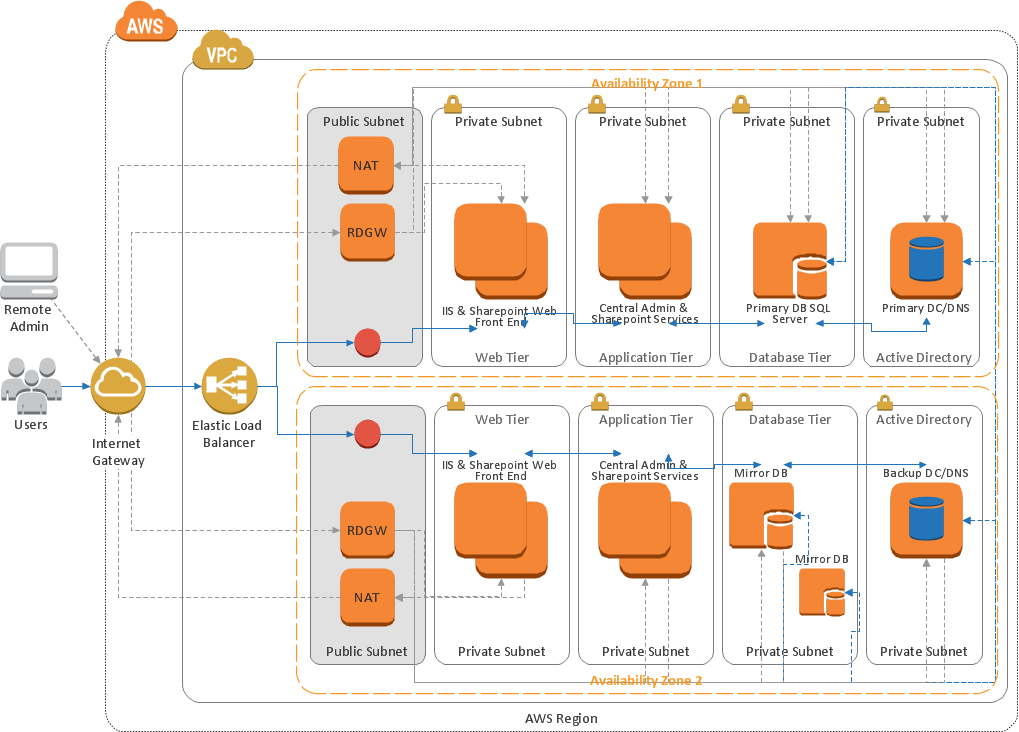
Picture: Creando Diagramas
Competitor analysis is a first and obligatory step in elaboration the proper corporate marketing strategy and creating sustainable competitive advantage. Use powerful opportunities of numerous solutions from ConceptDraw Solution Park for designing illustrative diagrams, charts, matrices which are necessary for effective competitor analysis.
Picture: Competitor Analysis
Related Solution: