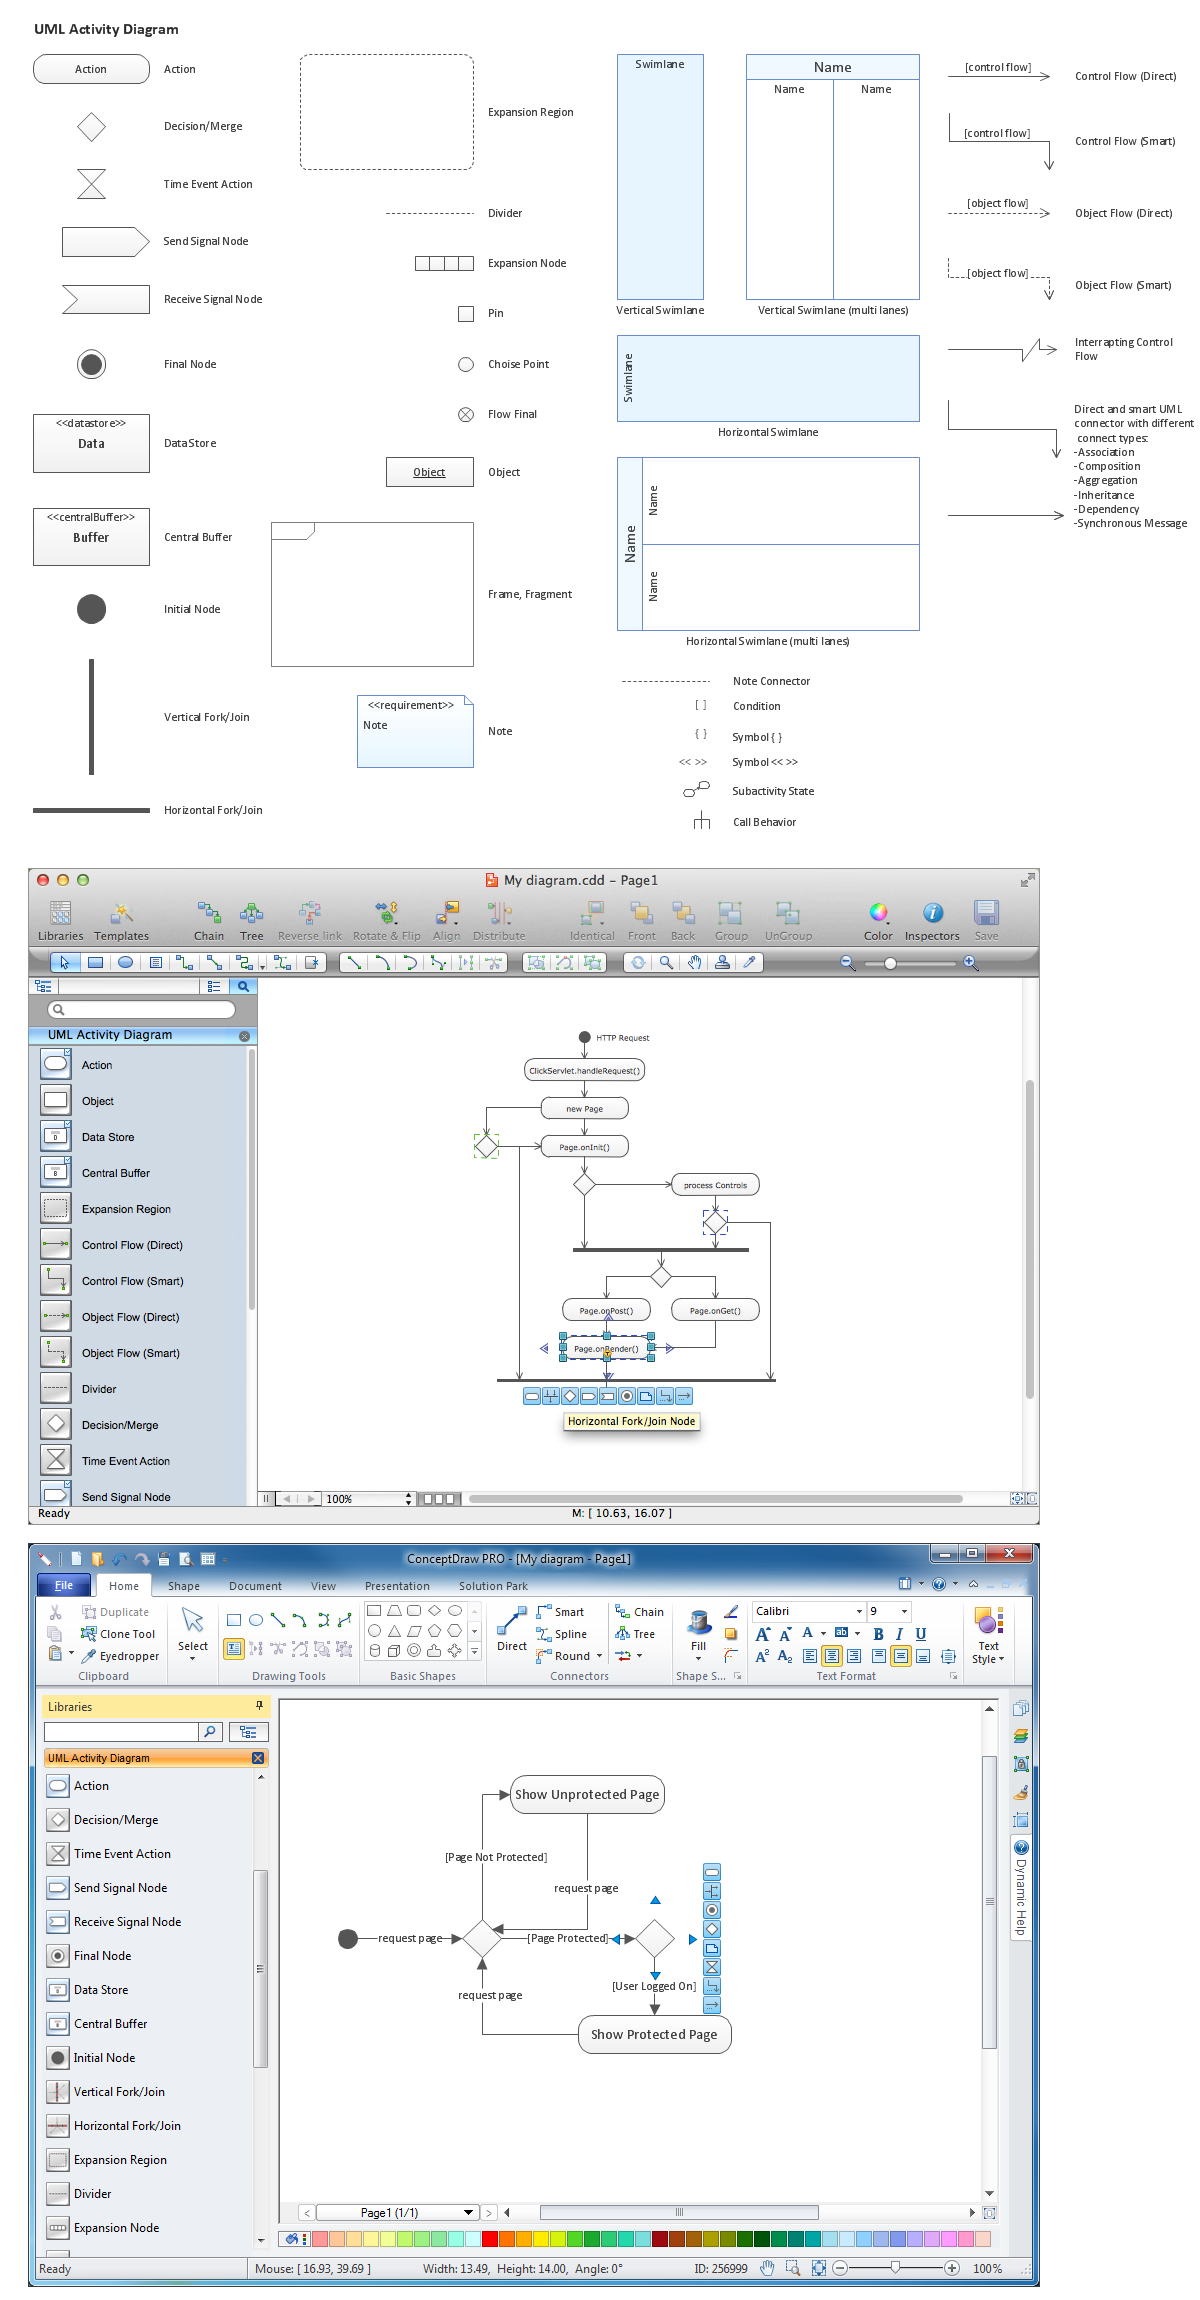
ConceptDraw Rapid UML solution provides UML Activity Diagram library of vector stencils for activity diagram design elements like rounded rectangles of activities, diamonds of decisions, bars of the start (split) or end (join) of concurrent activities, black circle of the start (initial state) of the workflow, encircled black circle of the end (final state), etc.
Use UML Activity Diagram library to draw your own activity diagrams that show the business and operational stepwise workflows of components in your system.

All libraries for creating UML diagrams are available inside the ConceptDraw DIAGRAM Templates and samples are located in the Rapid UML section of ConceptDraw STORE.

TEN RELATED HOW TO's:
Unified Modeling Language (UML) is a language of graphic description for object modeling in the field of software engineering. UML was created for definition, visualization, designing of software systems. UML is an open standard that uses graphic notations for creating visual models of object-oriented software systems.
The Rapid UML Solution for ConceptDraw DIAGRAM presentsthe intuitive RapidDraw interface that helps you to make the UML Diagram of any of these 13 types quick and easy.
Picture: UML Software
Related Solution:
Use ConceptDraw DIAGRAM software as powerful electrical engineering software and apply switches and relays electrical symbols in ✔️ electrical circuit diagrams, ✔️ electrical drawings, ✔️ electrical schematics, ✔️ wiring diagrams, ✔️ electrical blueprints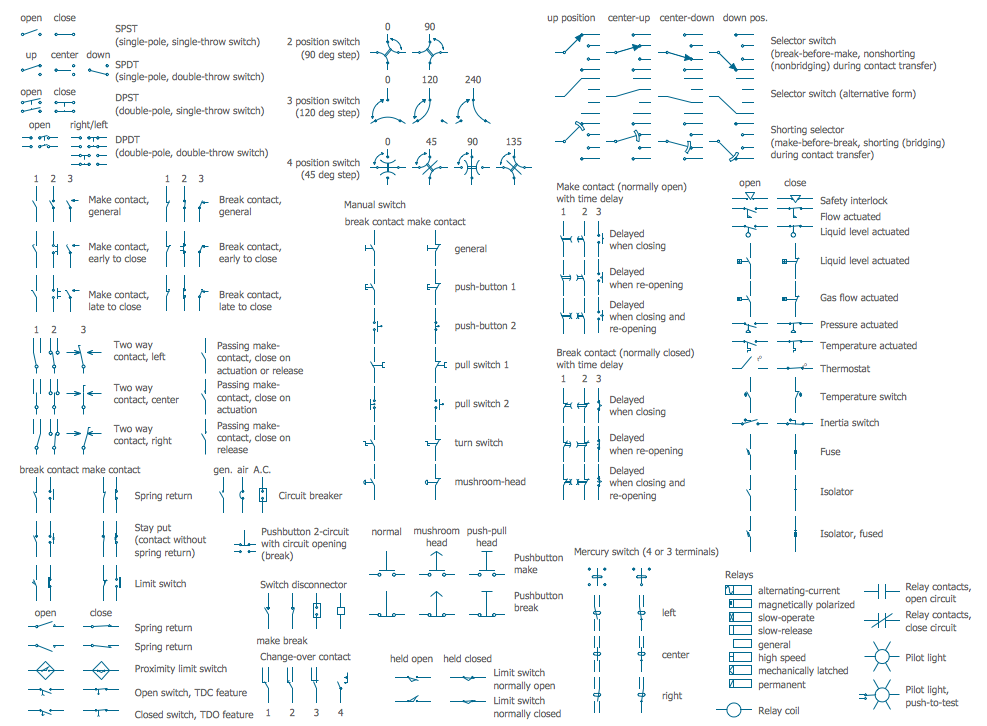
Picture: Electrical Symbols — Switches and Relays
Related Solution:
ConceptDraw PROJECT has flexible print settings that allowing you to easily print your project data to suite any need.
Picture: Advanced printing in ConceptDraw PROJECT
Related Solution:
Plumbing systems are very important for any manufacture, and it's a good practice to have a clear scheme of that system. To create one, you should use a piping and instrumentation diagram software with a possibility to save files in vector format, so you can print them without quality loss. ConceptDraw DIAGRAM is a great tool for creating diagrams, and you don't need to be very experienced to use it efficiently.
This example of Piping and Instrumentation Diagram (P&ID) depicts a scheme that illustrates the physical sequence and functional communications of piping, instrumentation and plumbing equipment components of a typical food trailer.
Seeking to avoid health troubles in a mobile food service , the plumbing demands for food trailers must be considered accurately. This P&ID shows all of piping including a basic set of piping system components along with multiple sinks, extra water heaters and other elements to meet health guidelines.
Picture: Piping and Instrumentation Diagram Software
Related Solution:
Users new to ConceptDraw PROJECT will find the Basic lessons an essential platform for familiarizing themselves with the program′s functions. This video lesson will teach you how to set up task trees and dependencies.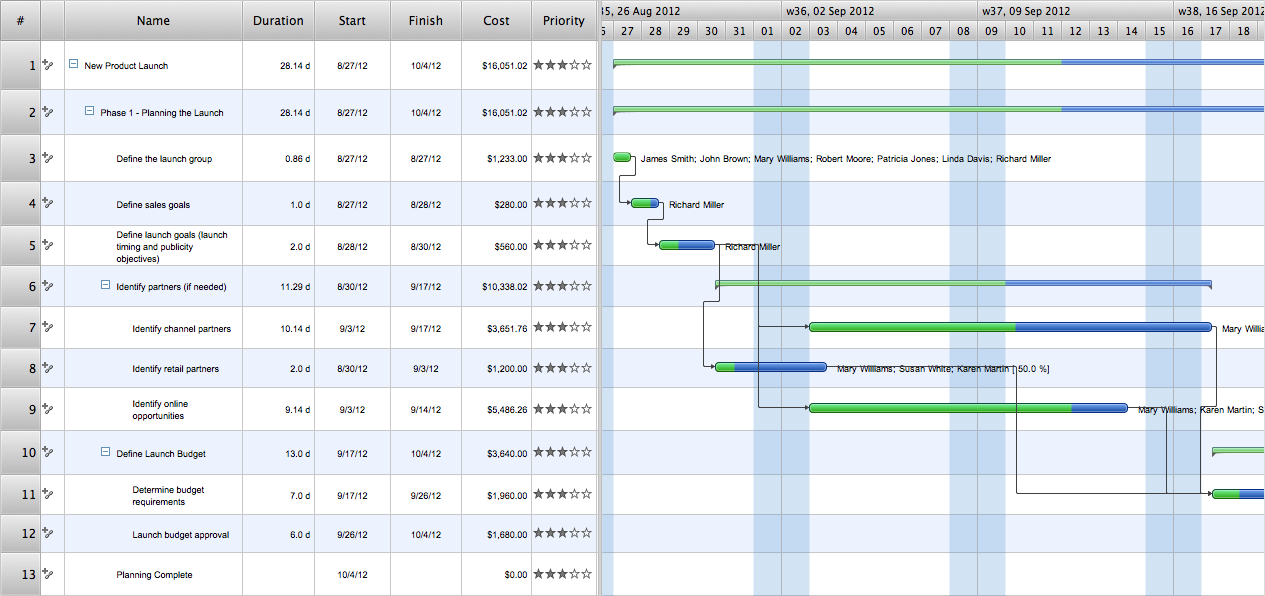
Picture: Project —Task Trees and Dependencies
UML state machine's goal is to overcome the main limitations of traditional finite-state machines while retaining their main benefits.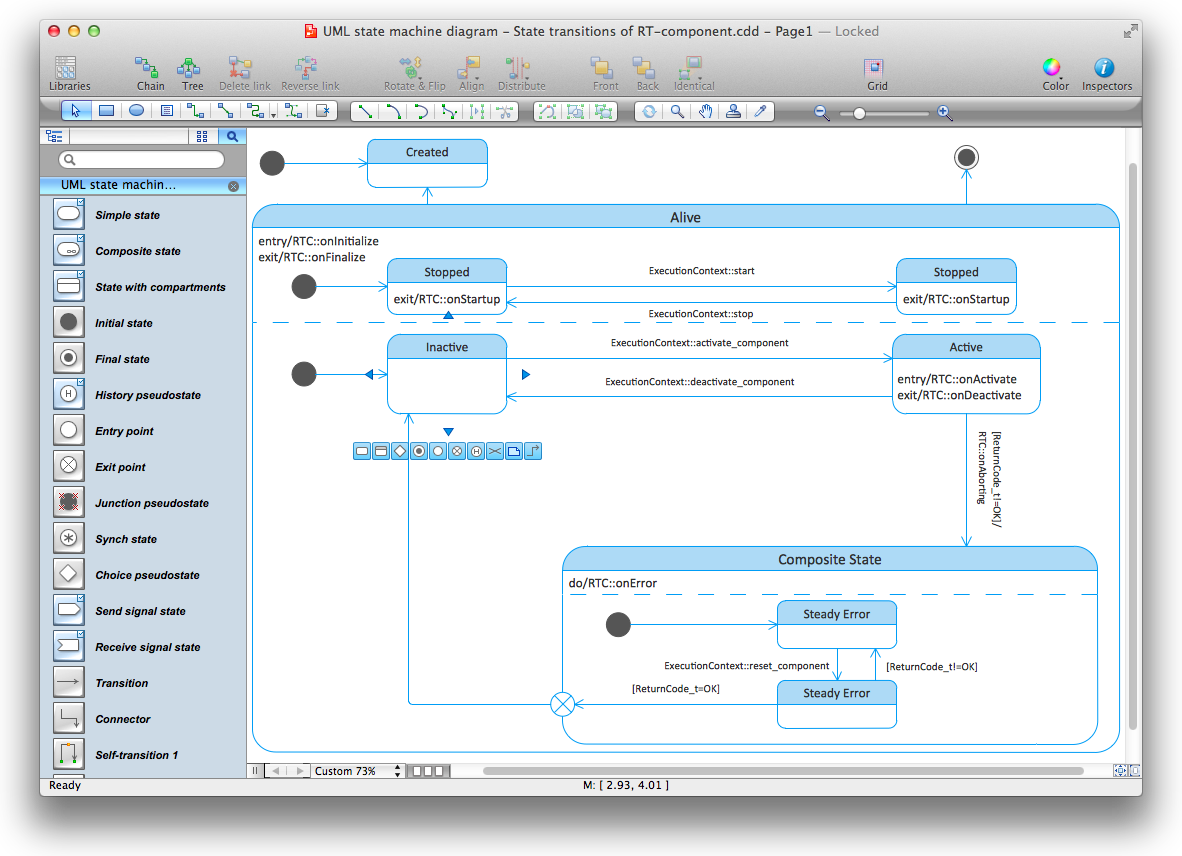
Picture: Diagramming Software for Design UML State Machine Diagrams
It’s very simple and quick to create the UML Diagrams using the Rapid UML Solution for ConceptDraw DIAGRAM. This sample was created in 10 minutes.
This sample describes the credit card processing system. It’s a UML Class Diagram with generalization sets. This sample can be used by the banks, business and financial companies, exchanges.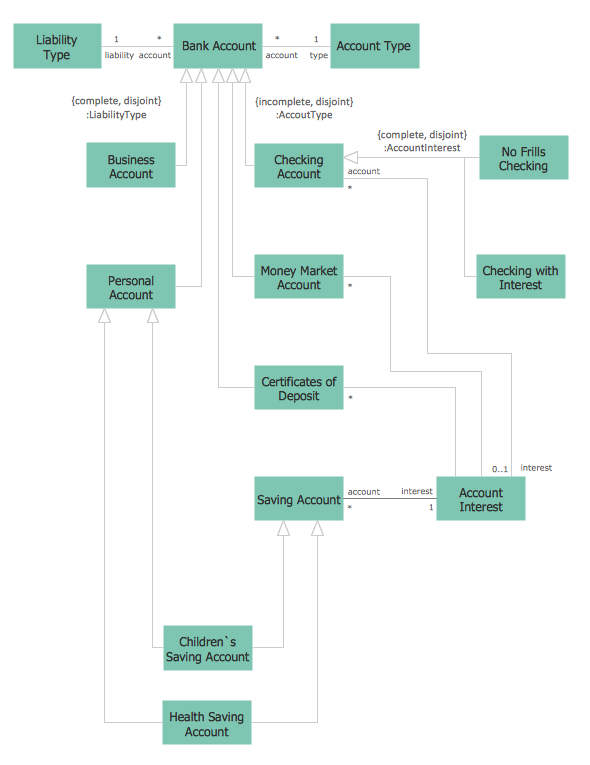
Picture: UML in 10 mins
Related Solution:
ConceptDraw DIAGRAM extended with Chemistry solution is effective for drawing various organic chemistry schemes, diagrams, illustrations thanks to the included collection of predesigned organic chemistry symbols
Picture: Organic Chemistry Symbols
Related Solution:
Database model is a graphic representation need at the beginning of project development. You won't have any problems with drawing ER diagrams on a Mac anymore with ConceptDraw DIAGRAM application. Special libraries that contain all the symbols of both Chen's and Crow’s foot notation allow you to start database modeling within a few minutes.
Creating entity-relationship diagrams on Mac is fun and effortless when you use a software designed for professional ERD drawing tailored to specific characteristics of Apple OS X. ConceptDraw DIAGRAM is a business diagramming software for those using OS X.
The Entity-Relationship Diagrams solution for ConceptDraw has 2 libraries containing about 50 vector icons, depicting ERD symbols of the most popular Chen's and Crow’s Foot Notations. The other valuable component of the solution is a collection of ERDs samples and templates that can be opened on Macs and PCs.
Picture: Drawing ER diagrams on a Mac
Related Solution:
A flowchart is a simple but very functional tool when it comes to understanding a workflow or to removing unnecessary stages from a process. When drawing flowcharts, keep in mind that there are four common types of flowcharts, like document flowcharts and data flowcharts that show control over a data or document flow over a system. To show controls on a physical level, use system flowcharts. In addition, to show controls in a program, you can draw a program flowchart.
This flowchart diagram represents the piece of an article editing process, that involves the author and editor. It was created using the Basic Flowchart notation that consists from the basic flowchart symbols. The start and the end of the process are indicated with "Terminator" symbols. The "Process" symbols show the action steps consisting from making edits and searching for a compromise, when the author does not agree with the suggestions of the editor. The "Process" symbol is the general symbol in process flowcharts. The "Decision" symbol indicates a branching in the process flow. There are two branches indicated by a Decision shape in the current flowchart (Yes/No, Disagree/Agree). This basic flowchart can be used as a repeating unit in the workflow diagram describing the working process of some editorial office.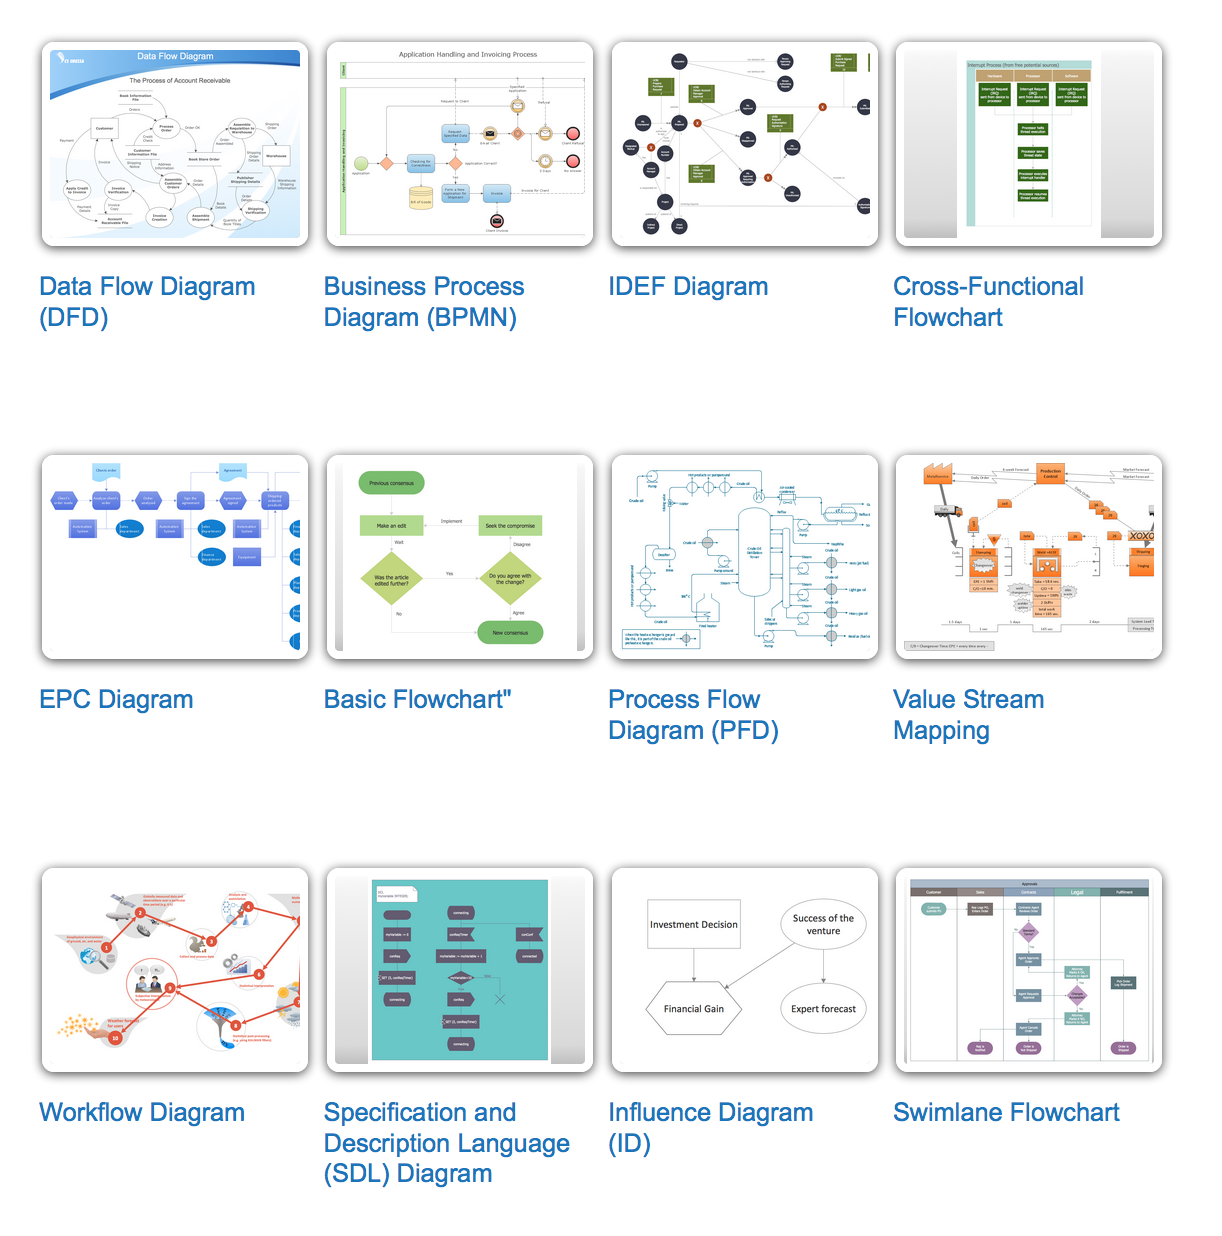
Picture: Types of Flowcharts
Related Solution:


