Diagramming Software for Design UML Timing Diagrams
UML Timing Diagram Designing
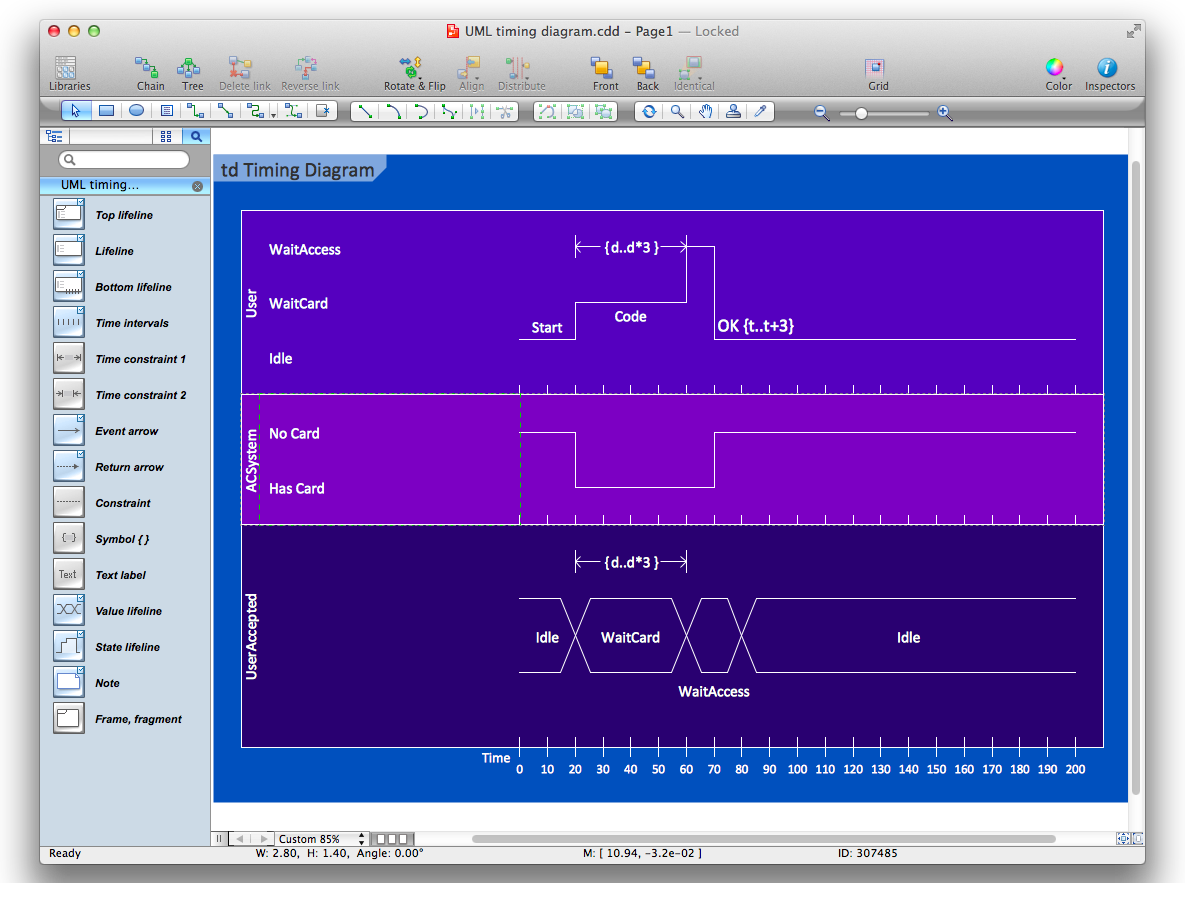
UML Timing Diagram as special form of a sequence diagram are used to explore the behaviors of objects throughout a given period of time. The differences from sequence diagram is the axes are reversed so that the time is increased from left to right and the lifelines are shown in separate compartments arranged vertically.
ConceptDraw helps you to start designing UML Diagrams with examples and templates.
You can use the appropriate stencils of UML notation from UML Timing library with
15 objects.
UML Timing Diagram Library
ConceptDraw Rapid UML solution delivers libraries contain pre-designed objects fit UML notation, and ready to draw professional UML Timing Diagram.

UML Timing Diagram Design Elements
Design elements sample shows all library objects at one page for quick review.

Design UML Timing Diagram in ConceptDraw DIAGRAM software
ConceptDraw DIAGRAM workspace is clear and simple. All tools you need for drawing UML Timing Diagram are on hand.

Examples of UML Timing Diagram
This is an example of UML Timing Diagram for an inspection process.

This example is created using ConceptDraw DIAGRAM diagramming and vector drawing software enhanced with Rapid UML solution from ConceptDraw Solution Park.

Rapid UML solution provides templates, examples and libraries of stencils for quick and easy drawing UML 2.4 timing diagram.
Use ConceptDraw DIAGRAM with UML Timing Diagram templates, samples and stencil library from Rapid UML solution to model how the objects of your system change their state or value over time, and how the timed events interact.

TEN RELATED HOW TO's:
Create flowcharts, org charts, shipping flowcharts, floor plans, business diagrams and more with ConceptDraw. Includes 1000s of professional-looking business templates that you can modify and make your own.
Picture: Basic Diagramming
Related Solution:
Working with personnel might be difficult if you are not prepared enough. To explain your workers all the details of communication with customers, you can draw an order process flowchart which will describe every step of the process and answer all the questions that might appear. You can view a lot of business process mapping diagram examples here, in ConceptDraw Solution Park.
This business process flow chart is created to illustrate the sample work order process. Before an organization can make some work for a person, the customer work order request must be completed. It is needed for tracking and accountability objectives. We used this business process flowchart to show a certain tasks and actions assumed by an organization. This flowchart depicts the outside inputs that are needed to launch a process, and ways the organization delivers its outputs. This business process flowchart was created with a help of ConceptDraw Business Process Mapping solution.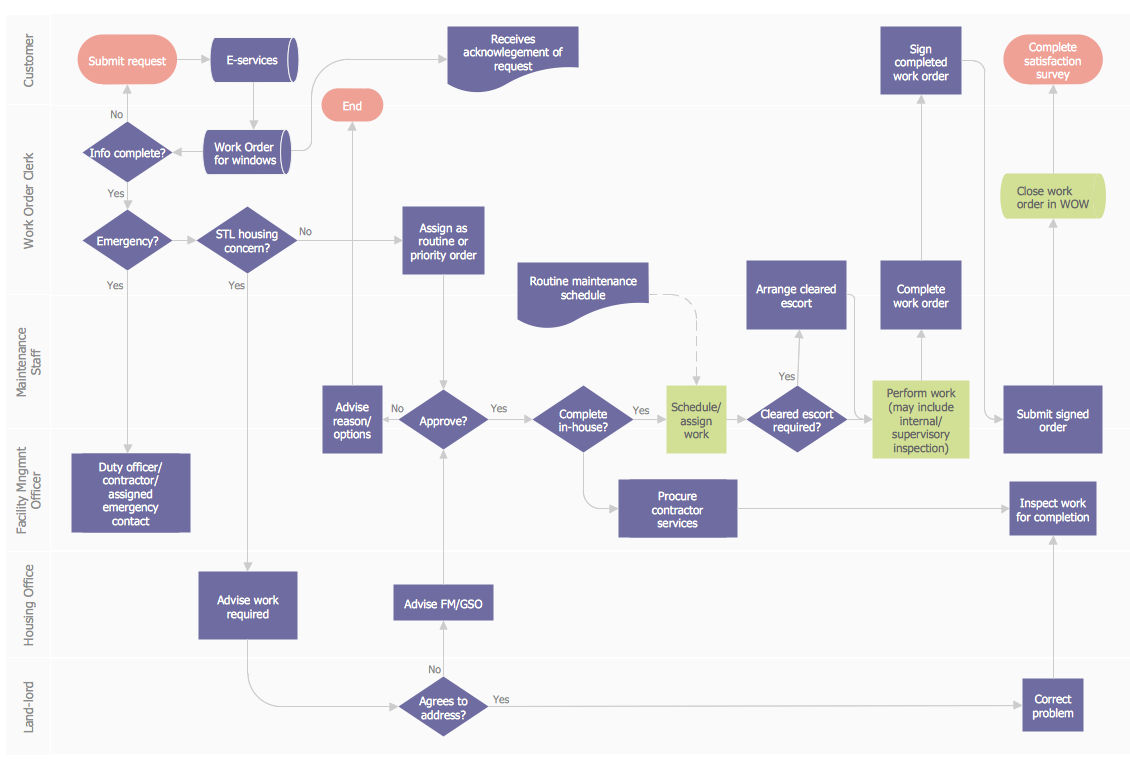
Picture: Work Order Process Flowchart. Business Process Mapping Examples
Related Solution:
One of the most visible trends in today's information technology (IT) industry is the placement of databases to the cloud. Microsoft Azure is one of such useful cloud services which is quite popular among applications developers and offers them extensive and effective Azure management tools.
ConceptDraw DIAGRAM diagramming and vector drawing software enhanced with Azure Architecture Solution from the Computer and Networks area of ConceptDraw Solution Park offers all needed tools for designing Azure management illustrations and Azure Architecture Diagrams.
Picture: Azure Management
Related Solution:
Audio connectors are electrical connectors designed and used for audio frequencies. ConceptDraw DIAGRAM diagramming and vector drawing software extended with Audio and Video Connectors Solution from the Industrial Engineering Area is the best for drawing various audio schematics with detailed illustration the audio connectors.
Picture: Audio Connectors
Related Solution:
ConceptDraw DIAGRAM diagramming and vector drawing software extended with Computer Network Diagrams Solution from the Computer and Networks Area offers a set of useful tools, collection of templates, samples, and libraries of various computer symbols, computer devices icons, computer network icon for fast and easy drawing network computer diagrams and illustrations.
Picture: Network Icon
Related Solution:
UML Composite Structure Diagram shows the internal structure of a class and the possible interactions at this structure.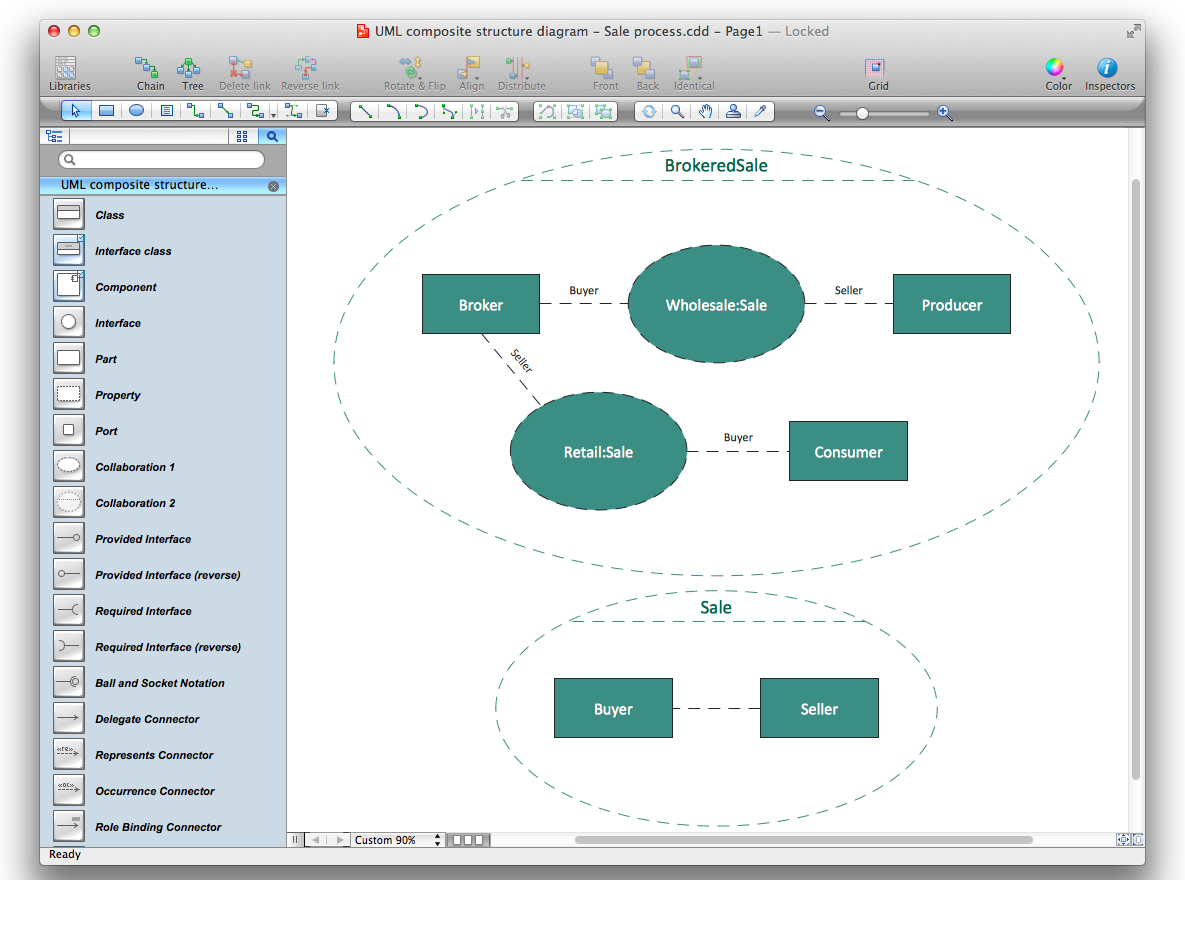
Picture: Diagramming Software for UML Composite Structure Diagrams
Working with disordered network data can be quite exhausting. Sometimes it's necessary to find a network diagramming software to design Cisco network diagrams that would be easy to use and would be able to export diagrams to various graphic formats. ConceptDraw DIAGRAM is a great diagramming tool that is able to perform all these tasks easily.
This vector library represents a set of 26 objects depicting the manufacturer - standard equipment of Cisco switches and hubs. This is only a small part of the vector graphic objects of Cisco equipment that comprise the Cisco Network Diagrams solution. In full the ConceptDraw Cisco Network Diagrams solution has 15 libraries, containing more then 500 objects to create a Cisco network diagrams. They can be used by IT specialists and corporative IT divisions, system and network administrators to make the visual documentation of Cisco networks topology.
Picture: Network Diagramming Software for Design. Cisco Network Diagrams
Related Solution:
ConceptDraw DIAGRAM compatible Mac OS X software extended with powerful Entity-Relationship Diagram (ERD) Solution from the Software Development Area for ConceptDraw Solution Park is one of the famous ER Diagram Programs for Mac. It gives the perfect ability to draw ER diagrams for visually describing databases with Chen's and Crow's Foot notation icons.
Picture: ER Diagram Programs for Mac
Related Solution:
Have you ever wanted to start your own cafe? To imagine any possible options, try Cafe Floor Plan Design Software now for free 21 day trial. This will allow you to use all the ConceptDraw DIAGRAM main features.
Here is an example of a multi-page document consisting from the various options of interior design and plans for arranging a cafe. This document can be used as a basis for the development of a professional designer portfolio. It was drawn using ConceptDraw Cafe and Restaurant Plans solution. The solution supplies vector libraries, templates and samples that are released to assist amateurs and professionals to draw the i designs of interior and furniture layouts of the cafe hall and lobby.
Picture: How to create Cafe Floor Plan Design
Related Solution:
Complexity of databases increases day by day, due to this the Entity relationship models and E-R diagrams become more and more popular, and now are an important part of database design. E-R diagrams created at ConceptDraw DIAGRAM allow visually and graphically represent structure and design of databases.
Picture: E-R Diagrams
Related Solution:


