Donut Chart
ConceptDraw DIAGRAM diagramming and vector drawing software offers the Pie Charts solution from the Graphs and Charts area which includes the tools for quick and easy designing any kind of Donut Chart.

Example 1. Donut Chart - Budgeted Appropriations
First of all the Pie Charts Solution includes collection of various templates which can become the excellent base for your own Donut Chart. They are available from ConceptDraw STORE. You can open any of them and fill according to your data.
Will be also convenient to use the Donut Chart samples from ConceptDraw STORE and large quantity of predesigned vector objects included to Pie Charts library for Pie Charts solution.

Example 2. Donut Chart
The samples and templates of Donut Charts you see on this page were created in ConceptDraw DIAGRAM using the tools of Pie Charts Solution from the Graphs and Charts area. All they demonstrate the solution's capabilities and the professional results you can achieve.
Use Pie Charts Solution for ConceptDraw DIAGRAM to draw your own Donut Chart quick, easy, and effective.
All source documents are vector graphic documents. They are available for reviewing, modifying, or converting to a variety of formats (PDF file, MS PowerPoint, MS Visio, and many other graphic formats) from the ConceptDraw STORE. The Pie Charts Solution is available for all ConceptDraw DIAGRAM or later users.
TEN RELATED HOW TO's:
pyramida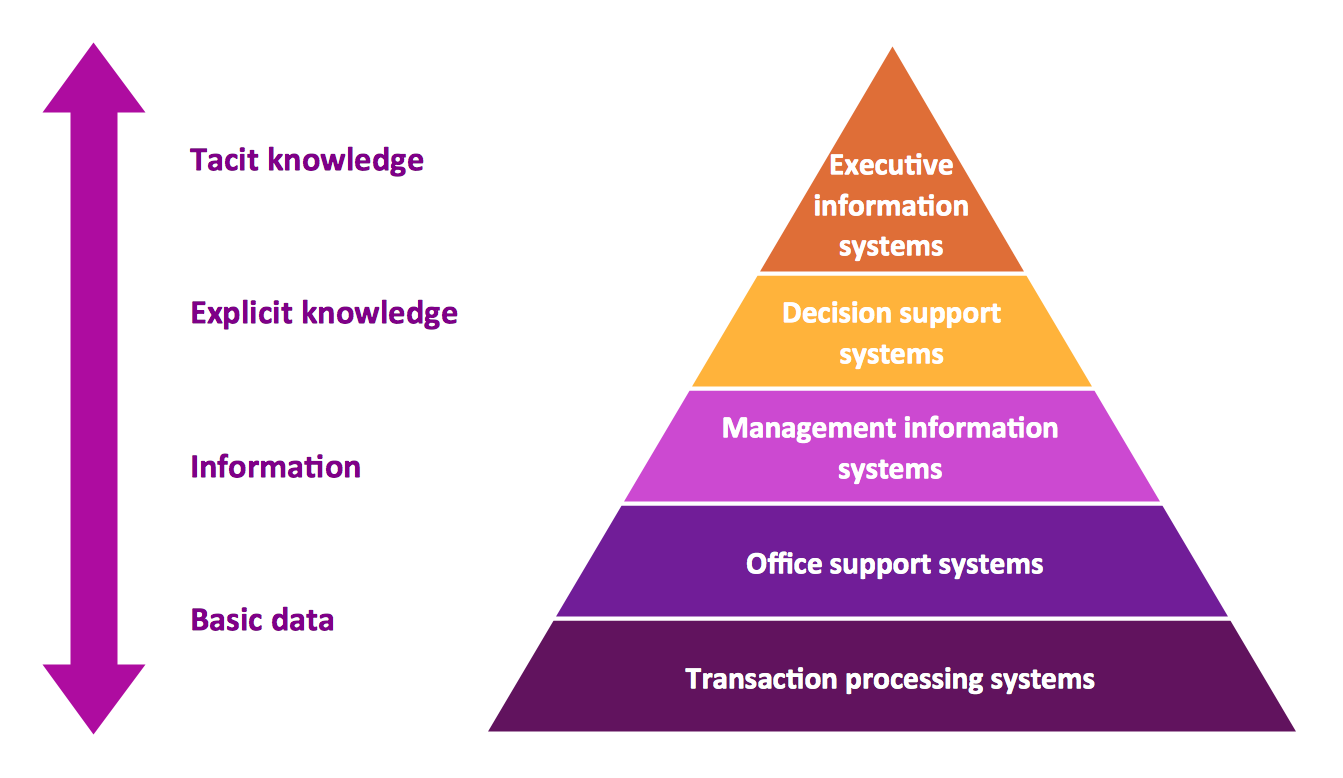
Picture: Pyramid Diagram
Related Solution:
Relative value is a value measured in the terms of liquidity, risks, return of one investment or financial instrument relative to another.
Relative values are widely used in:business, economics, investment, management, marketing, statistics, etc.
ConceptDraw DIAGRAM software is the best for drawing professional looking Relative Value Charts. ConceptDraw DIAGRAM provides Divided Bar Diagrams solution from the Graphs and Charts Area of ConceptDraw Solution Park.
Picture: Relative Value Chart Software
Related Solution:
Perfect charts and graphics diagramming software with rich examples and template. ConceptDraw is ideal to draw Charts and Graphics.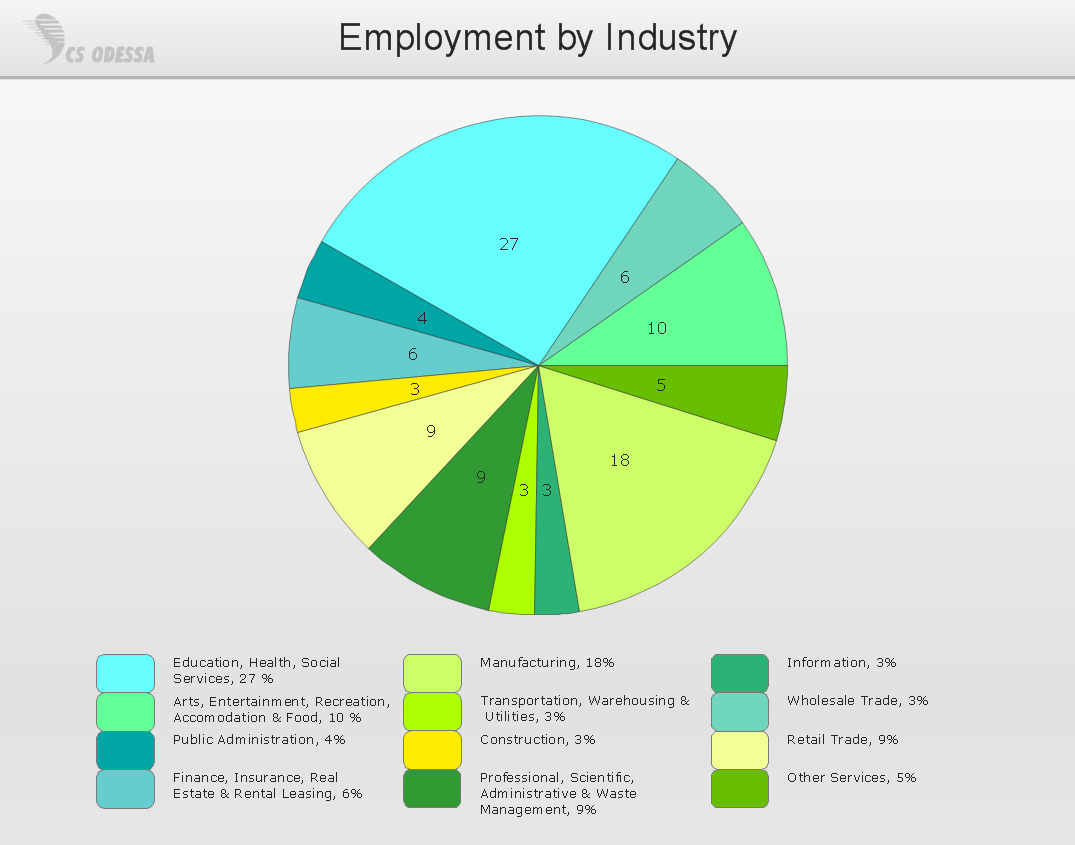
Picture: Basic Diagramming
Related Solution:
ConceptDraw DIAGRAM extended with Bar Graphs solution from Graphs and Charts area of ConceptDraw Solution Park is ideal software for quick and simple drawing bar chart of any complexity graph.
Picture: Bar Chart
Related Solution:
ConceptDraw offers you a number of ready-made organizational chart templates which you can use in your drawing. They are grouped in topical sets as organizational chart template files.
Use the Organizational Charts Solution for ConceptDraw DIAGRAM to create your own Organizational Charts of any complexity quick, easy and effective.
The Organizational Charts designed with ConceptDraw DIAGRAM are vector graphic documents and are available for reviewing, modifying, converting to a variety of formats (image, HTML, PDF file, MS PowerPoint Presentation, Adobe Flash or MS Visio XML), printing and send via e-mail in one moment.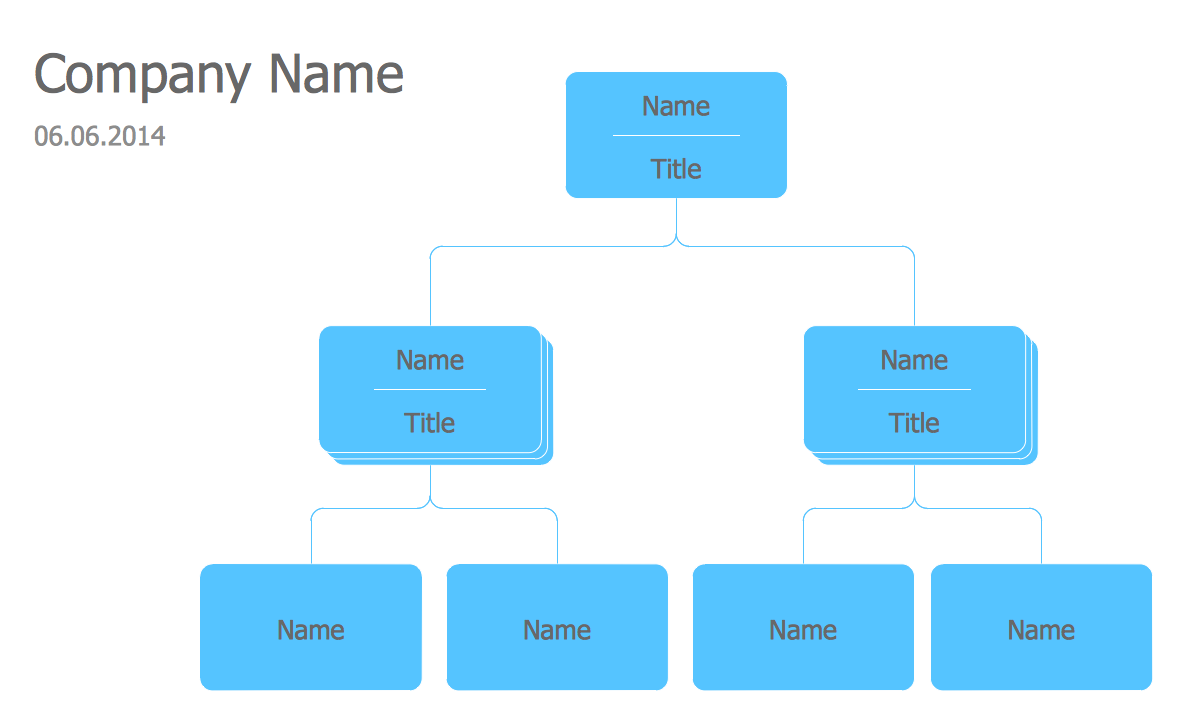
Picture: Organizational Chart Templates
Related Solution:
This sample shows the Scatter Plot without missing categories. It’s very important to no miss the data, because this can have the grave negative consequences. The data on the Scatter Chart are represented as points with two values of variables in the Cartesian coordinates. This sample can be used in the engineering, business, statistics, analytics, at the creating the financial and other types of reports.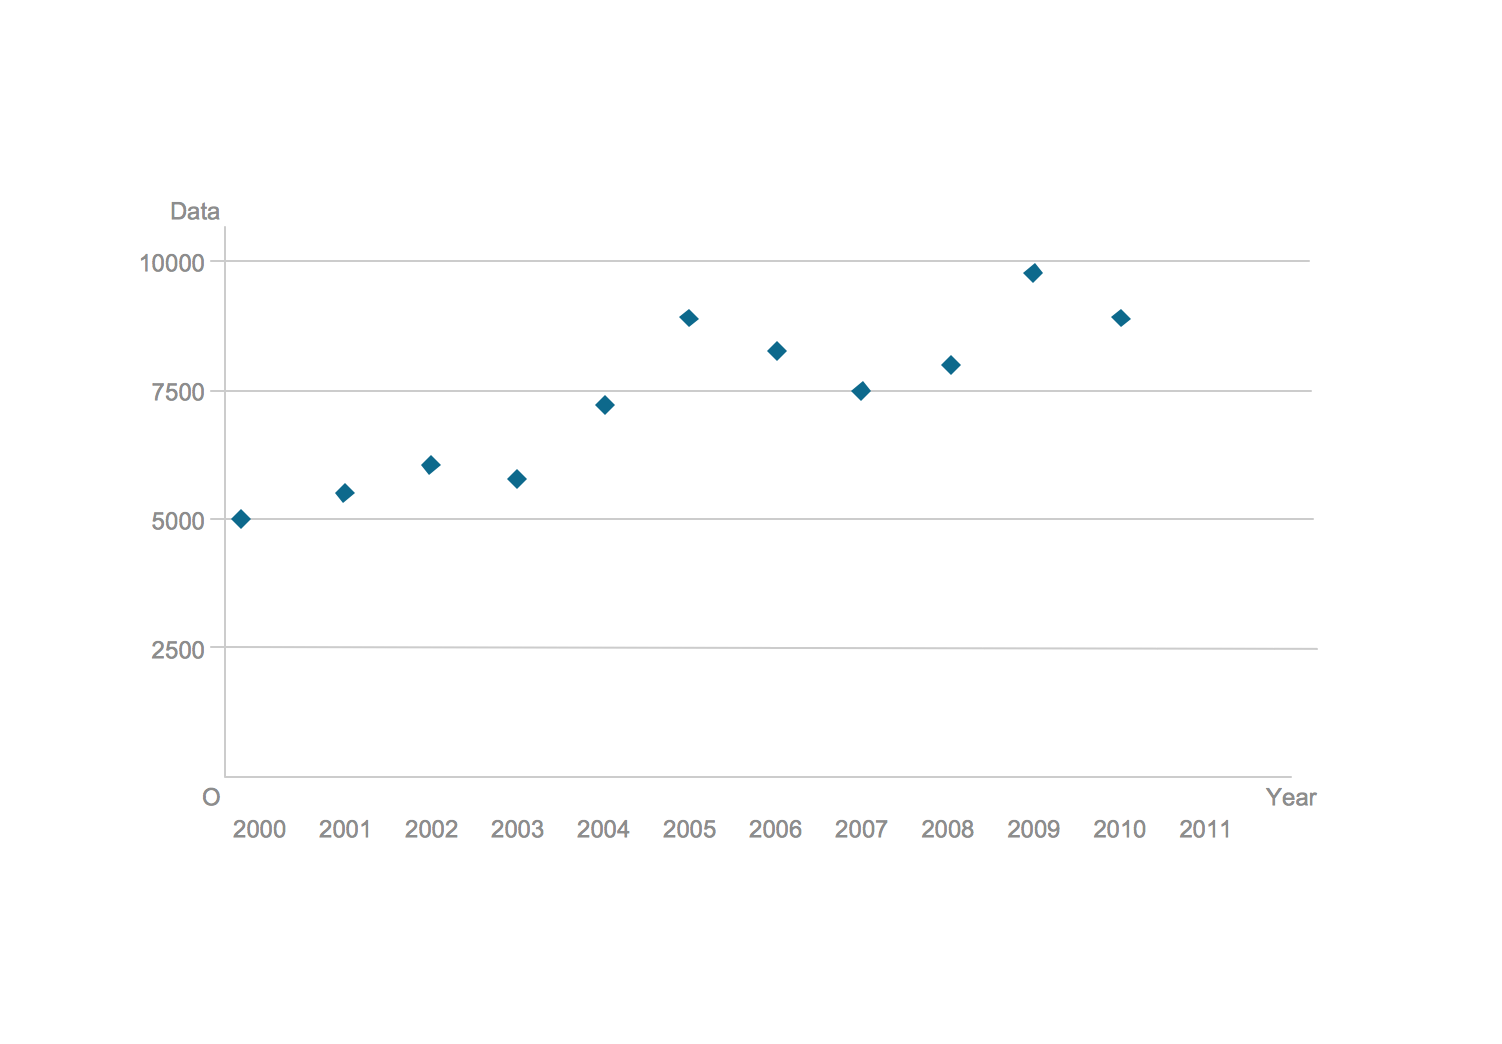
Picture: Blank Scatter Plot
Related Solution:
While designing a conceptual data model, you should use appropriate software. For instance, ConceptDraw DIAGRAM is a user-friendly ER diagram tool that has a lot of samples and templates to facilitate your work. A clear entity-relationship diagram helps to define the relations between system’s components.
Software engineering is the section of a computer science engaged to design, realization, and support of complex software products. An ERD is a data modeling method that is widely applied in the software engineering practice. Commonly it is used for developing a structure of a a relational database. An entity relationship diagram is helpful for structuring and organizing databases that can be modeled using a relational structure. An entity relationship diagram is designed to depicts the interrelationships within the sets of entities which are accumulated in the database. Each entity represents a particular component of a data. Thus, ER diagrams depicts the logical structure of databases. ConceptDraw ER Diagrams solution provides software engineers with the professional tool for making entity-relationship diagrams.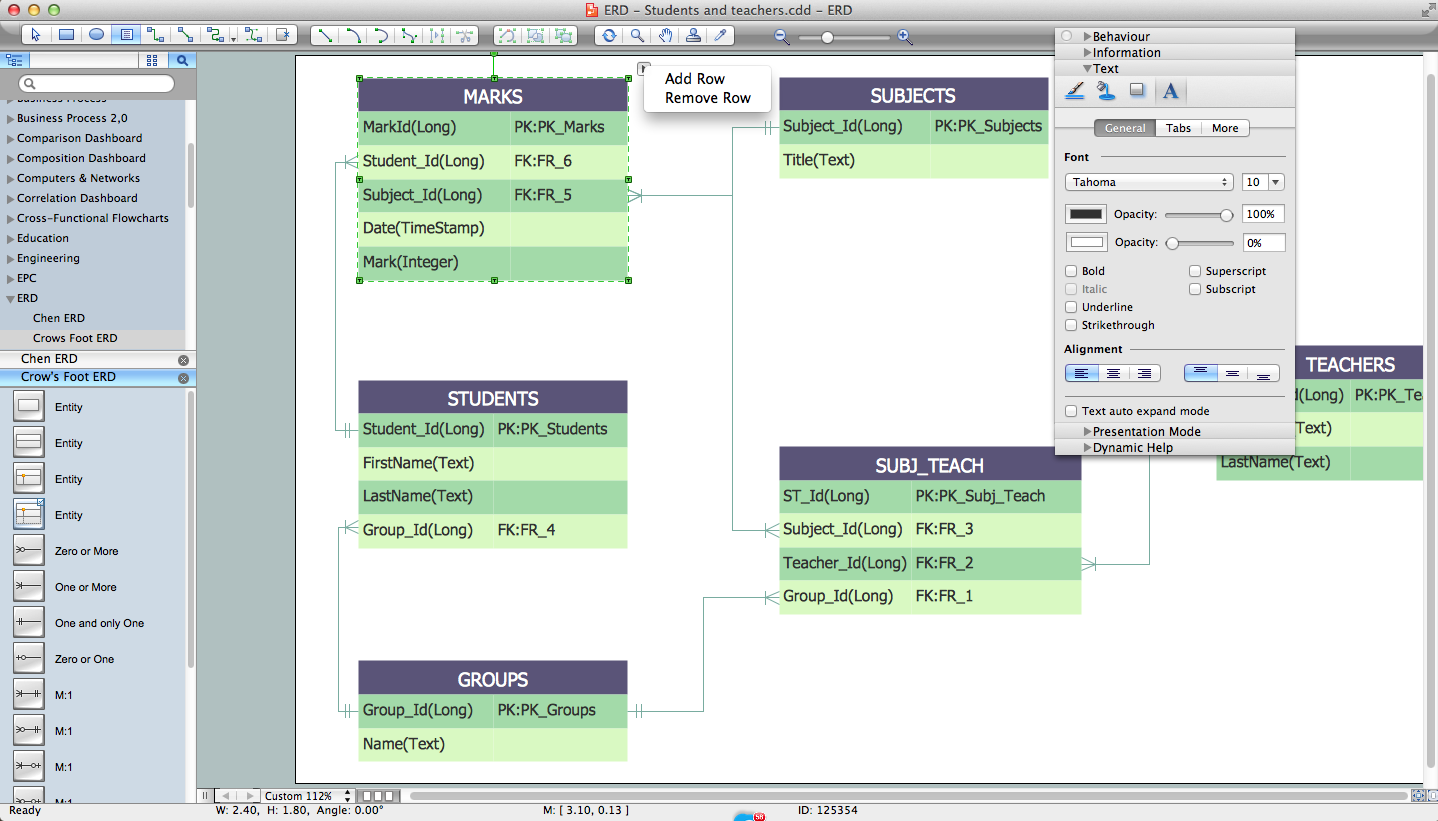
Picture: Entity Relationship Diagram Software Engineering
Related Solution:
When we start to speak about databases, we must always mention database structure visualization. One of the most common ways to do it is to create an entity relationship diagram, and to put appropriate symbols on it. It is important either for database projecting and for its' future maintenance.
Entity Relationship Diagram describes data elements and their relationships within a database. There are a set of special symbols that depict each element of an entity relationship diagram. Entities - represents some stable components such as supplier, employee, invoice, client, etc. Relation symbols show how the entities interact. Attributes define characteristics of the relationships. Attributes can be one-to-one or many-to-many. Physical symbols is used in the physical models. They represent items such as fields, tables, types and keys. ERD physical symbols are the building material for the database. Notation lines are used to illustrate the relationships. The most common method is Crow’s Feet notation. You can use ConceptDraw Entity-Relationship Diagram (ERD) solution to represent a database using the Entity-Relationship model.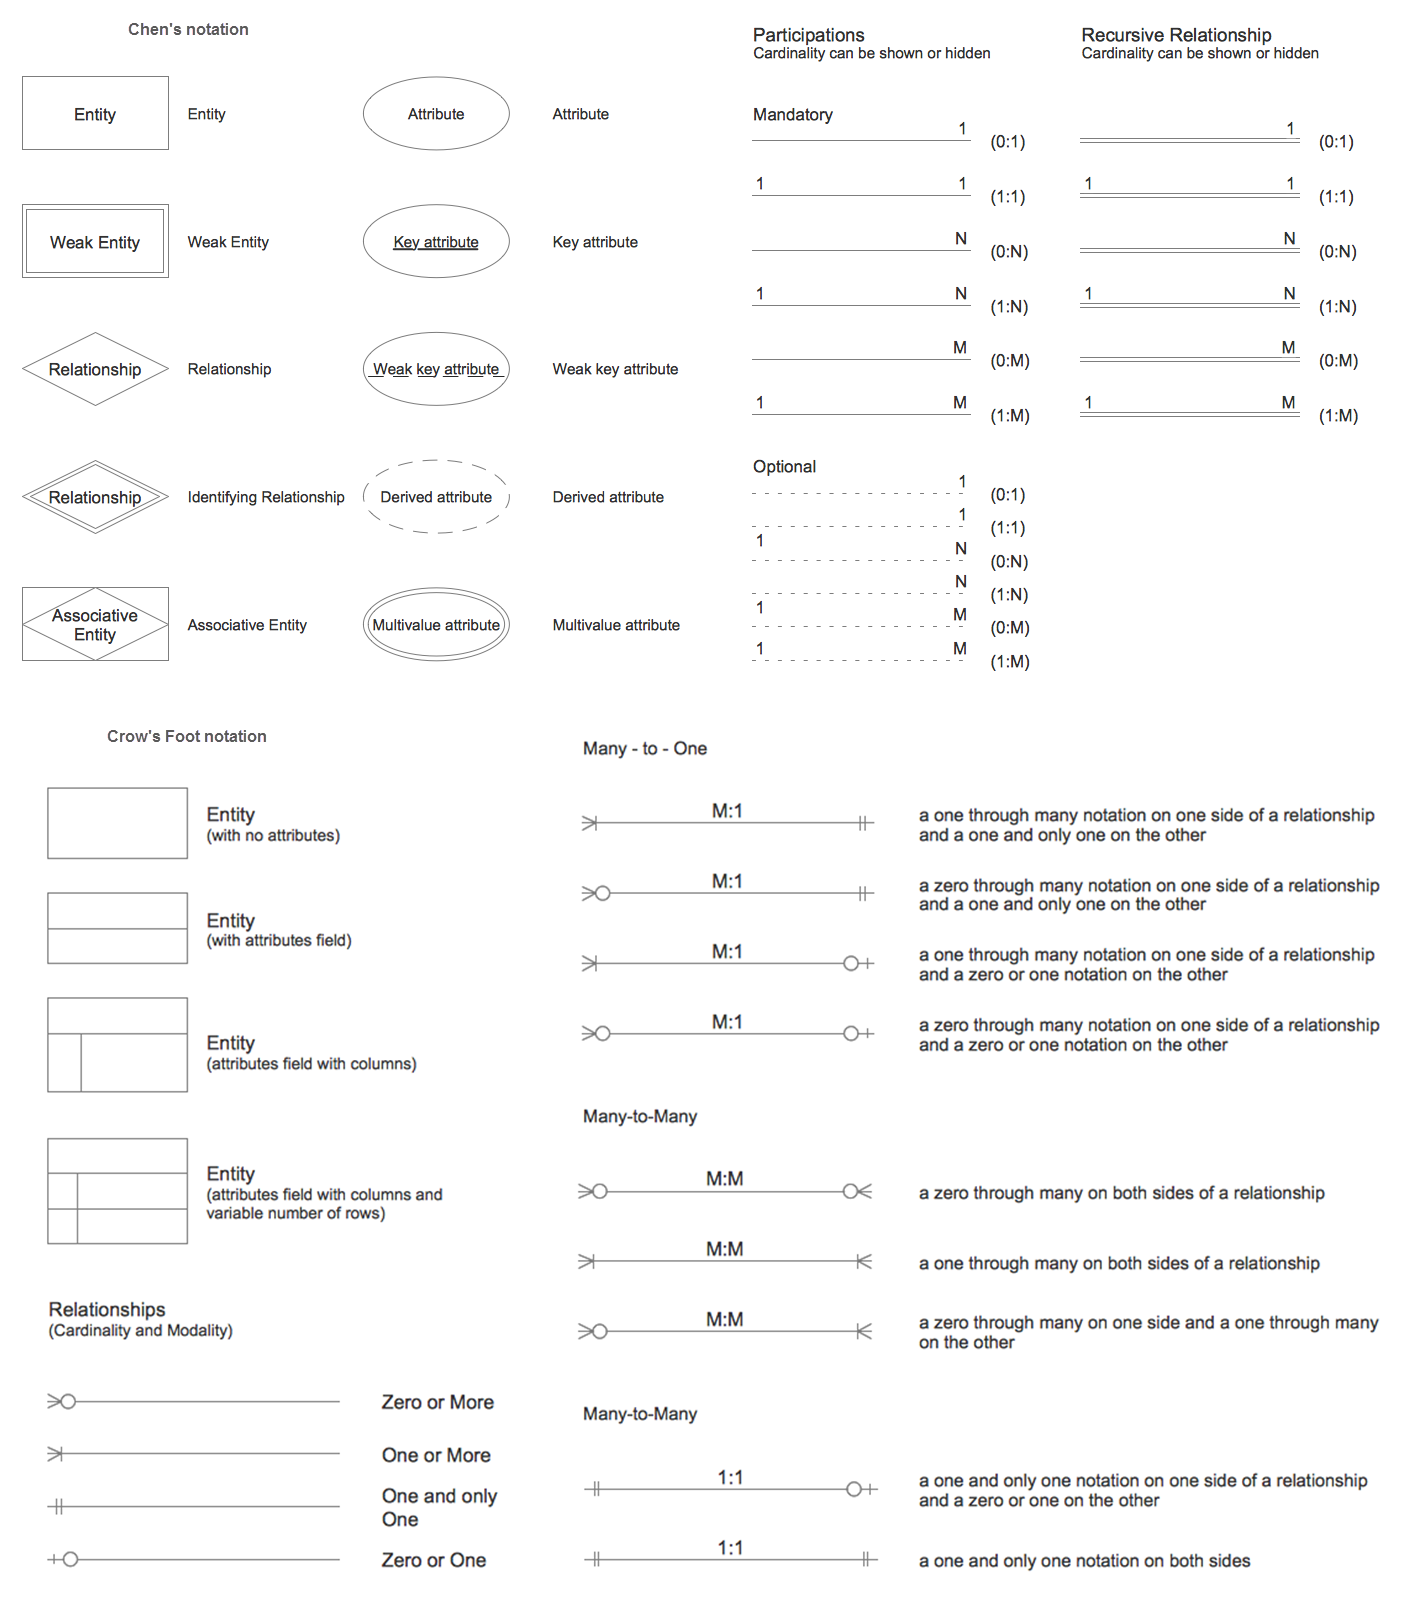
Picture: Entity Relationship Diagram Symbols
Related Solution:
ConceptDraw DIAGRAM charting and vector drawing software offers the Circle Spoke Diagram Template included to the Business Diagrams Solution from the Management Area. The use of ready template is the easiest way of drawing professional-looking Circle-Spoke Diagrams.
Picture: Circle Spoke Diagram Template
Related Solution:


