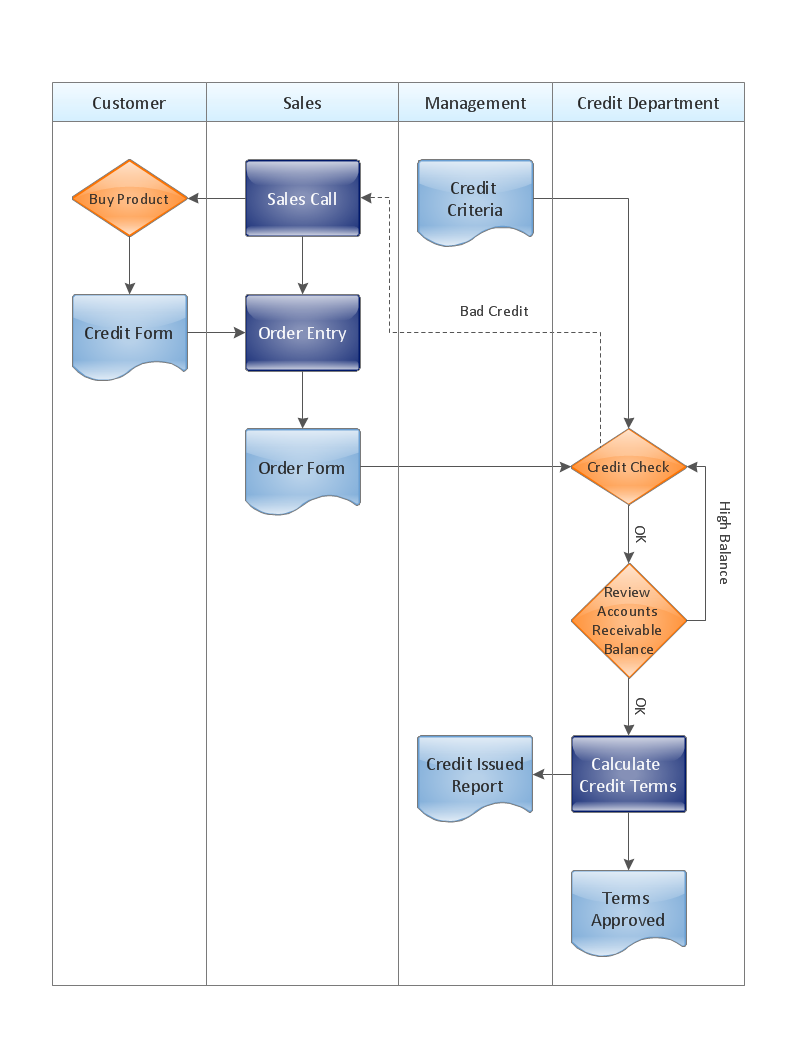
Cross-Functional Flowchart - The easiest way to draw crossfunctional
Boxes and Connectors
The innovative ConceptDraw Arrows10 Technology included in ConceptDraw DIAGRAM is a powerful drawing flowcharting software that changes the way diagrams are produced.
While making the drawing process easier and faster.
ConceptDraw DIAGRAM is a powerful tool that helps you create professional looking cross-functional flowcharts. Fine-tuning the objects in ConceptDraw DIAGRAM allows you to focus on the flow structure, not the design. ConceptDraw Arrows10 Technology gives drawing connectors a smart behavior that gives you freedom and flexibility to your work process.
ConceptDraw DIAGRAM diagramming software provides vector shapes and connector tools for quick and easy drawing diagrams for business, technology, science and education.
Use ConceptDraw DIAGRAM enhanced with solutions from ConceptDraw Solution Park to create diagrams to present and explain structures, process flows, logical relationships, networks, design schemes and other visually organized information and knowledge.
You want design the Cross Functional Diagram and need powerful software? Then ConceptDraw DIAGRAM diagramming and vector drawing software extended with Cross-Functional Flowcharts Solution is exactly what you need.
You want to connecting objects manually?
You don't know how should diagramming software work?
Is it possible to develop a diagram as quickly as the ideas come to you?
Yes. The innovative ConceptDraw Arrows10 Technology - This is more than enough versatility to draw any type of diagram with any degree of complexity.
You can start draw your diagram manually now.
Perfect Network Diagramming Software with examples of LAN Diagrams. ConceptDraw Network Diagram is ideal for network engineers and network designers who need to draw Logical Network diagrams.
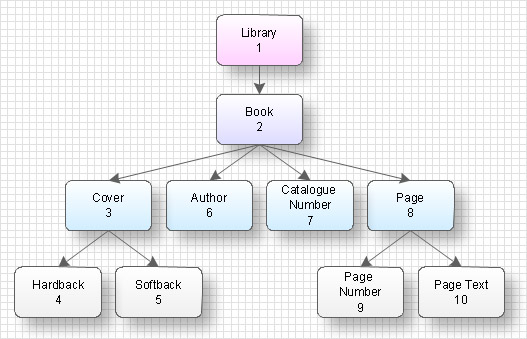
Data structure diagram (DSD) is intended for description of conceptual models of data (concepts and connections between them) in the graphic format for more obviousness. Data structure diagram includes entities description, connections between them and obligatory conditions and requirements which connect them. Create Data structure diagram with ConceptDraw DIAGRAM.
Picture: Data structure diagram with ConceptDraw DIAGRAM
It is so simple making the drawing process easier and faster. you just need to choose the right drawing software.
ConceptDraw Arrows10 Technology - This is so easy and fast to draw any type of diagram with any degree of complexity.
The ER diagram is constructed from the specific ERD graphic elements. There are used 2 types of ERD notations: Chen and Crow's Foot.
A complete set of work flow shapes, notation & symbols for ERD, entity relationship stencils, included in Entity-Relationship Diagram (ERD) solution for ConceptDraw DIAGRAM software, makes drawing diagrams based on ERD notation as smooth as possible.
Desbloquee el lenguaje de los diagramas de flujo con nuestra guía de símbolos de diagramas de flujo. 🔸 Todo lo que necesita saber sobre los conceptos básicos del diagrama de flujo, desde ✔️ puntos de decisión hasta ✔️ pasos del proceso, explore el significado detrás de cada símbolo y domine el arte de crear representaciones visuales claras y efectivas de sus procesos.
Diagrams are a very important part of modern life. With the help of flow diagram software, a lot of companies can promote their ideas at the market. Its usefulness is totally doubtless.
This is a flow chart of the invoice payment flow. This flowchart details decrypts all stages of the process of obtaining and paying bills. It is a description of the universal process - such steps performs accounting departments of almost any organization. Since every business no matter what it does is a consumer of some goods or services. The given flow chart was made using ConceptDraw DIAGRAM software and the Diagrams solution for making flowcharts of any kind.