How should diagramming software work? Is it possible to develop a diagram as quickly as the ideas come to you?
The innovative ConceptDraw Arrows10 Technology included in ConceptDraw DIAGRAM is a powerful drawing tool that changes the way diagrams are produced.
While making the drawing process easier and faster.
ConceptDraw DIAGRAM is a powerful tool that helps you create a process map diagram quickly and easily. Fine-tuning the objects in ConceptDraw DIAGRAM allows you to create a really professional finished article. ConceptDraw Arrows10 Technology gives drawing connectors a smart behavior that provides quick and precise placement, allows for easy changes and automatic rearrangement.
When the "tree" mode is switched on the next shape you add to your diagram is automatically connected to the initial shape. You can rapidly add shapes to your tree diagram by copying-and-pasting or using Ctrl+"drag-and-drop" combination.
Want to add the next level of shapes to your tree diagram. This easy to do by selecting a shape to make it the new initial shape for this level and continue adding shapes. The "tree" auto connection mode can help you easily create different types of structured diagrams; examples of these types of diagrams could be mind maps, organization charts, root cause diagrams, and more.
Video 1. ConceptDraw Technology
ConceptDraw DIAGRAM software provides vector shapes and connector tools for quick and easy drawing diagrams for business, technology, science and education.
Sample 1. Amazon Web Services (AWS) diagram — 3 Tier auto scalable Web application architecture
Use ConceptDraw DIAGRAM software enhanced with solutions from ConceptDraw Solution Park to create diagrams to present and explain structures, process flows, logical relationships, networks, design schemes and other visually organized information and knowledge.
The Cloud Computing Architecture is the structure of the system, which is based on the needs of end-user and includes the set of components and subcomponents required for cloud computing, among them cloud resources, services, middleware, software components, front-end platforms (cloud clients), cloud-based back end platforms (servers, storage), and a network (Internet, Intranet, Intercloud). When designing the Cloud Computing Architecture diagrams, the ConceptDraw DIAGRAM diagramming and vector drawing software advises to turn attention for the powerful Cloud Computing Diagrams solution from the extensive Computers and Network area of ConceptDraw Solution Park.
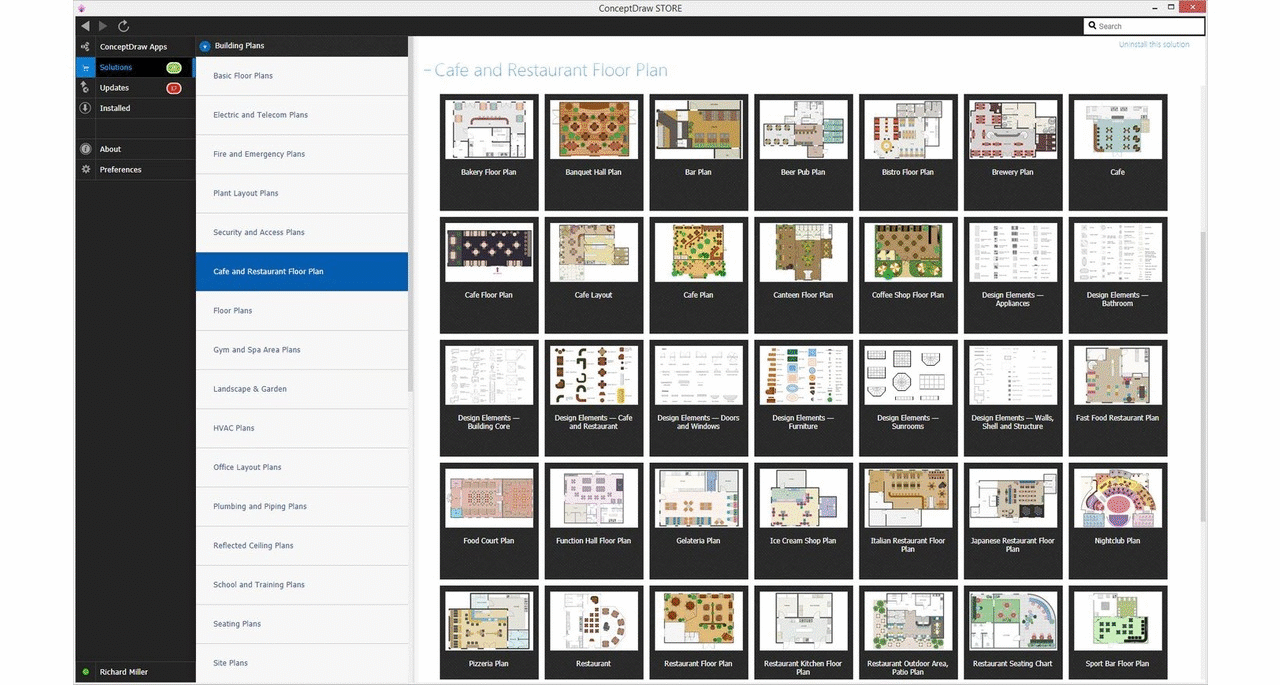
What do you know about restaurants? To have a better understanding, use restaurant floor plans software, and enjoy the result. Registration is going to take just a few minutes, and you will be able to start your experience from tons of examples and free templates.
This restaurant floor plan was created with the help of he ConceptDraw Cafe and Restaurant Plans solution. The main feature of this restaurant is small kitchen. Perhaps that is why the designer of this establishment, has paid great attention to interior diversity. The facilities of ConceptDraw DIAGRAM allow him to make this easily. Here are represented tables for two, for three or four visitors. A visitor can choose any of the bright multi-colored chairs and tables. The two tables at the right upper corner attract one's attention. They are strictly decorated and located near the second door. Probably they are for security service of the restaurant, which monitors to ensure that visitors do not run away without paying.
The Architecture Diagrams are the type of diagrams which help to system designers, system developers, and application developers to visualize the overall high-level structure of the system or application and depict the interactions between software systems, users, external systems, data sources, and services. The ConceptDraw DIAGRAM Architecture Diagrams Software provides the unique Cloud Computing Diagrams solution from the Computers and Network area of ConceptDraw Solution Park with wide set of powerful tools for fast and easy creating various types of Architecture diagrams.
The blueprints are the set of drawings used by architects and builders in the process of construction of the buildings. The blueprints represent the top views on the buildings (homes, offices, etc.). They are drawn in the scale and use the special blueprint symbols and blueprints codes. Earlier the blueprints wer printed on the special paper and was blue.
It's very easy, quick and convenient to draw the professional looking blueprints in ConceptDraw DIAGRAM diagramming and vector drawing software.
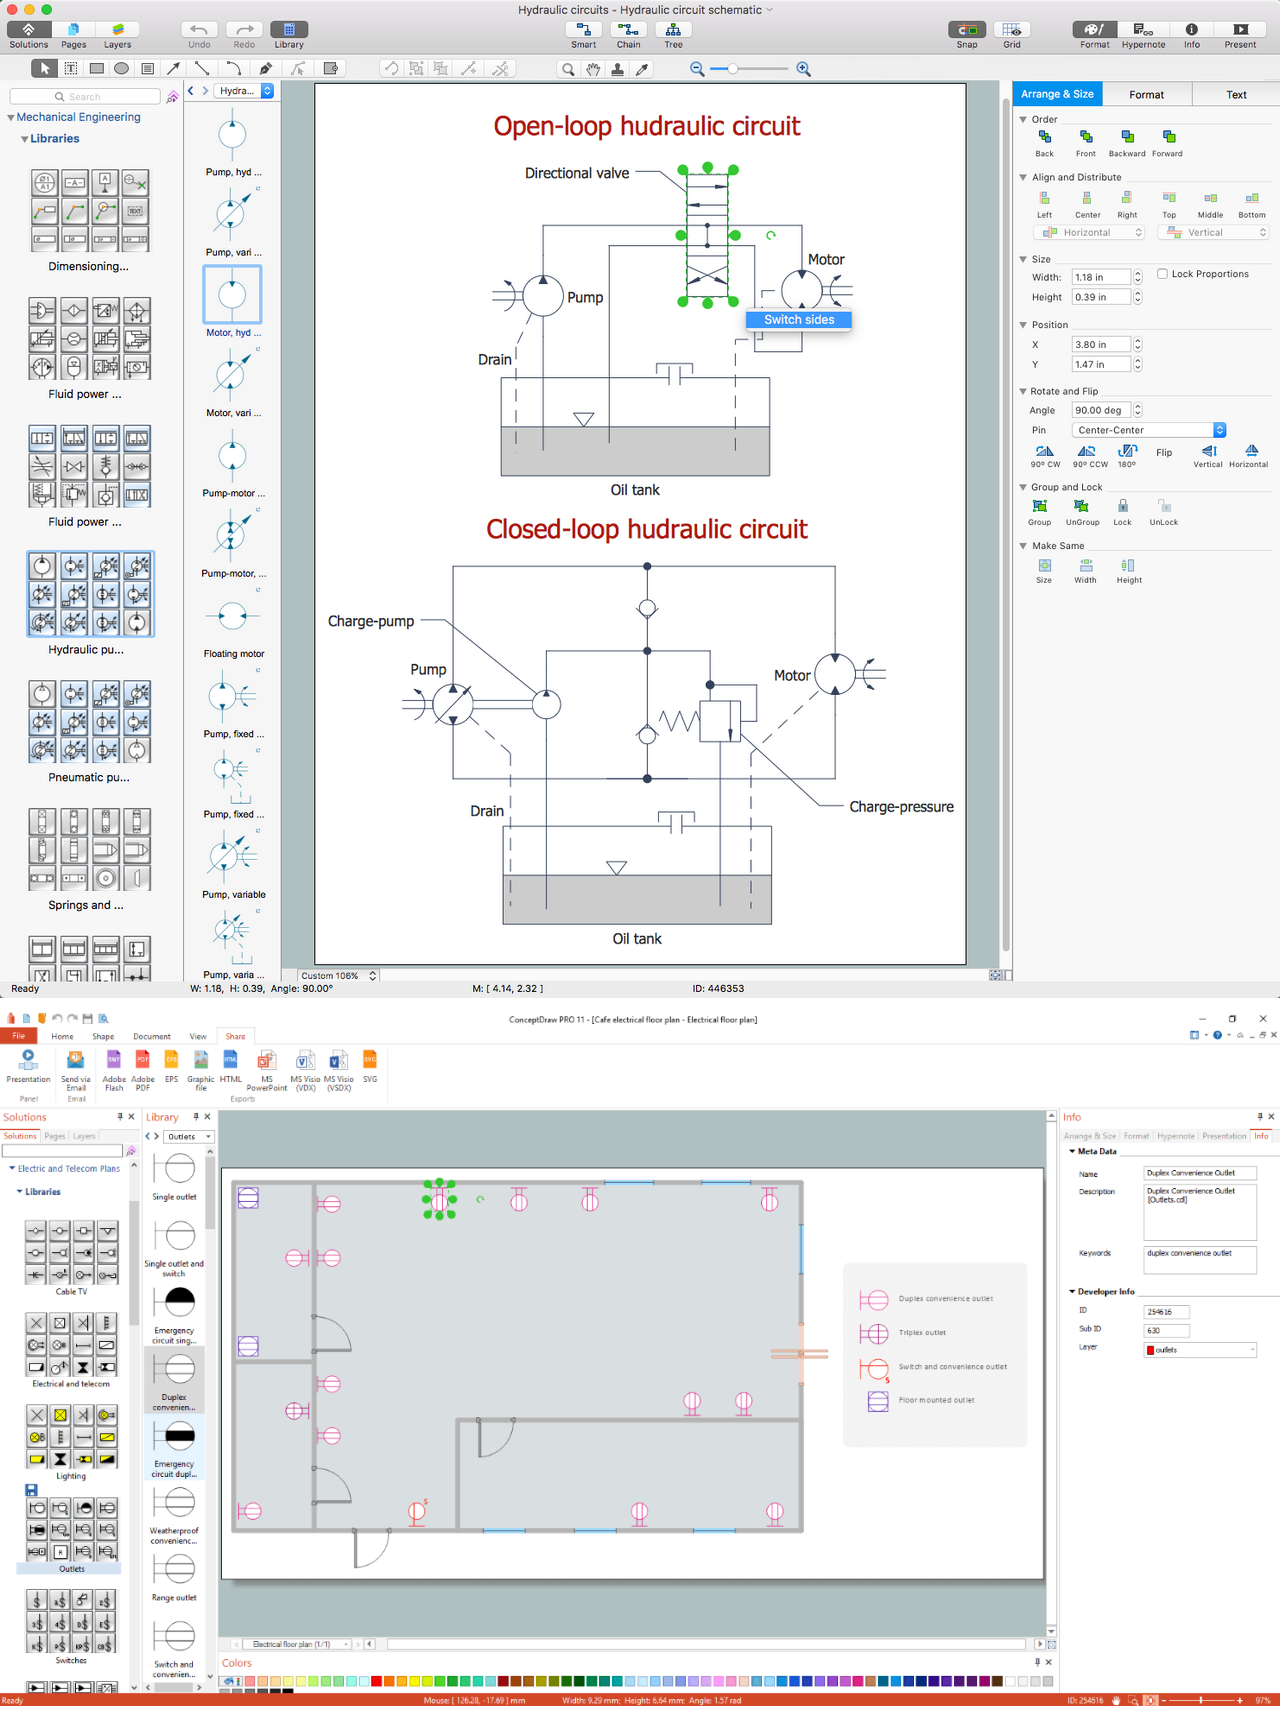
This diagram represents the electrical floor plan. This is a common practice - to draw the electrical plan on the floor plan. The outlets, fixtures and other electrical equipment are depicted on the floor plan with special symbols. This drawing was created using the possibilities of ConceptDraw DIAGRAM as CAD software. Computer-aided design software is intended to replaces manual engineering drafting with an automated process. CAD software is used by engineers, architects, and others to make high-precision technical drawings and illustrations. CAD software allows technical specialists to develop, examine and manage various engineering projects.
It is almost impossible nowadays to imagine mechanical engineering without digital technologies. Finding a suitable CAD software for creating mechanic diagram and electrical diagram architectural designs can take a lot of time and effort. However, with ConceptDraw DIAGRAM you can create any diagram that you want and later convert it to the most popular graphic formats like.vsdx,.png,.pptx etc.
Picture: CAD Drawing Software for Making Mechanic Diagram and Electrical Diagram Architectural Designs
It is so simple making the drawing process easier and faster. you just need to choose the right drawing software.
ConceptDraw Arrows10 Technology - This is so easy and fast to draw any type of diagram with any degree of complexity.
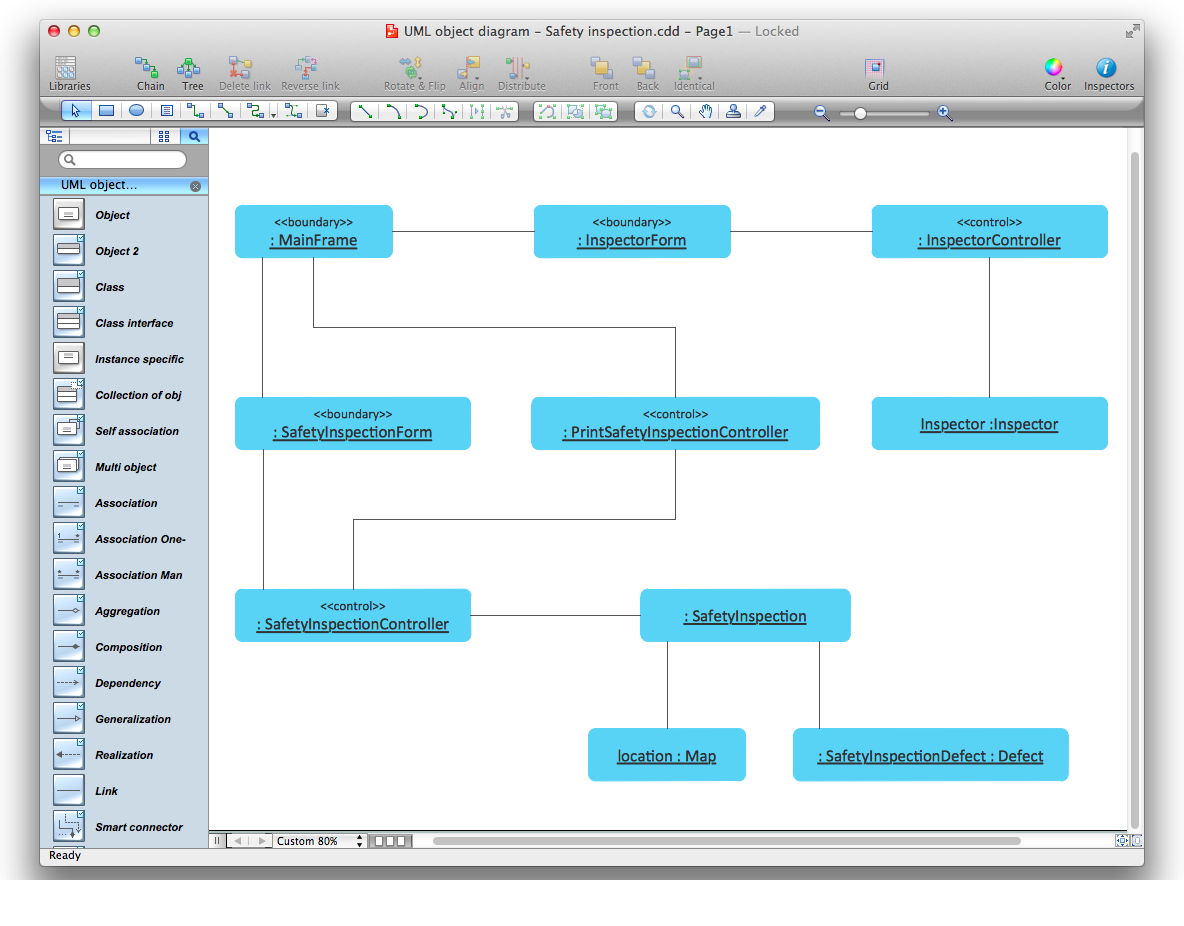
UML Object Diagram shows the structure of a modeled system at a specific time.
ConceptDraw Rapid UML solution delivers libraries contain pre-designed objects fit UML notation, and ready to draw professional UML Object Diagram.
Picture: Diagramming Software for Design UML Object Diagrams
ConceptDraw DIAGRAM is a vector-based network diagramming software. Now it has powerful tools to draw 3D Network Diagrams.
Use more than 2 000 pre-designed 3D network elements for customizing your network diagrams. Computer & Networks solution allows you for design 3D LAN and WAN, schematic and wiring drawings.