How should diagramming software work? Is it possible to develop a diagram as quickly as the ideas come to you?
The innovative ConceptDraw Arrows10 Technology included in ConceptDraw DIAGRAM is a powerful drawing tool that changes the way diagrams are produced. While making the drawing process easier and faster.
ConceptDraw DIAGRAM is a powerful tool that helps you create a Cross Functional Flow Chart quickly and easily. Fine-tuning the objects in ConceptDraw DIAGRAM allows you to create a really professional finished article. ConceptDraw Arrows10 Technology gives drawing connectors a smart behavior that provides quick and precise placement, allows for easy changes and automatic rearrangement.
The "chain" mode connects every new shape to the previous one. If you want to create a new branch in your diagram, you just deselect the current chain and select the new shape, which will be the root for this branch, turn the "chain" mode on again and then continue adding shapes. The "chain" auto connection mode is convenient for drawing Cross Functional Flow Chart.
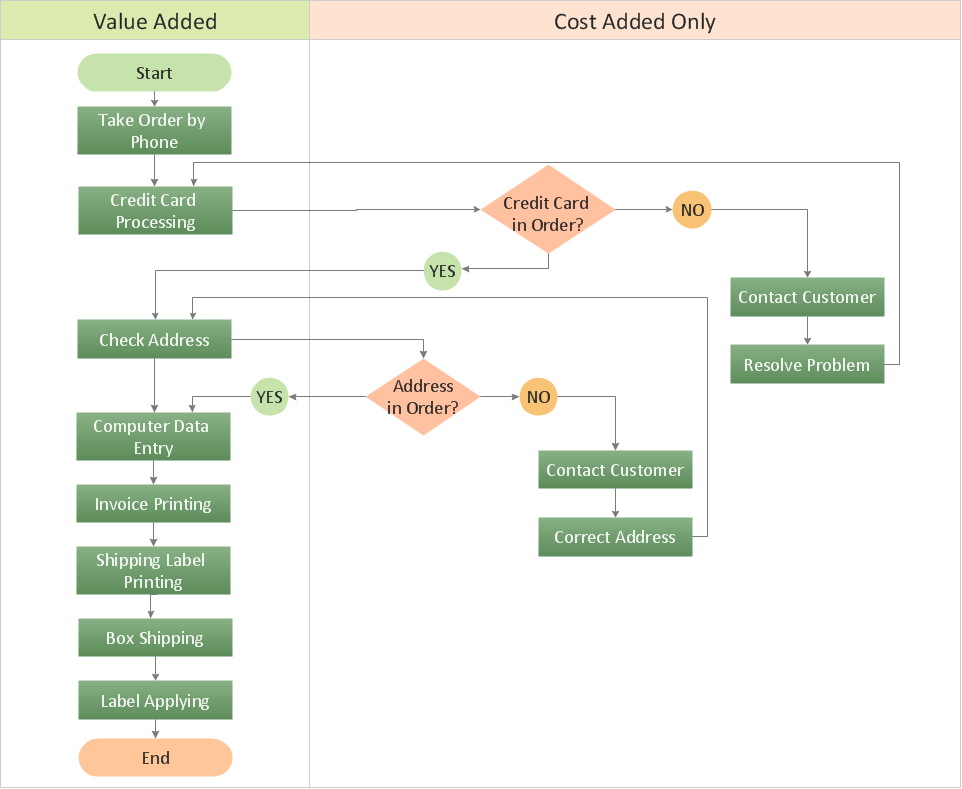
Sample 1. Opportunity flow chart - Order processing.
ConceptDraw DIAGRAM diagramming software provides vector shapes and connector tools for quick and easy drawing diagrams for business, technology, science and education.
Use ConceptDraw DIAGRAM enhanced with solutions from ConceptDraw Solution Park to create diagrams to present and explain structures, process flows, logical relationships, networks, design schemes and other visually organized information and knowledge.
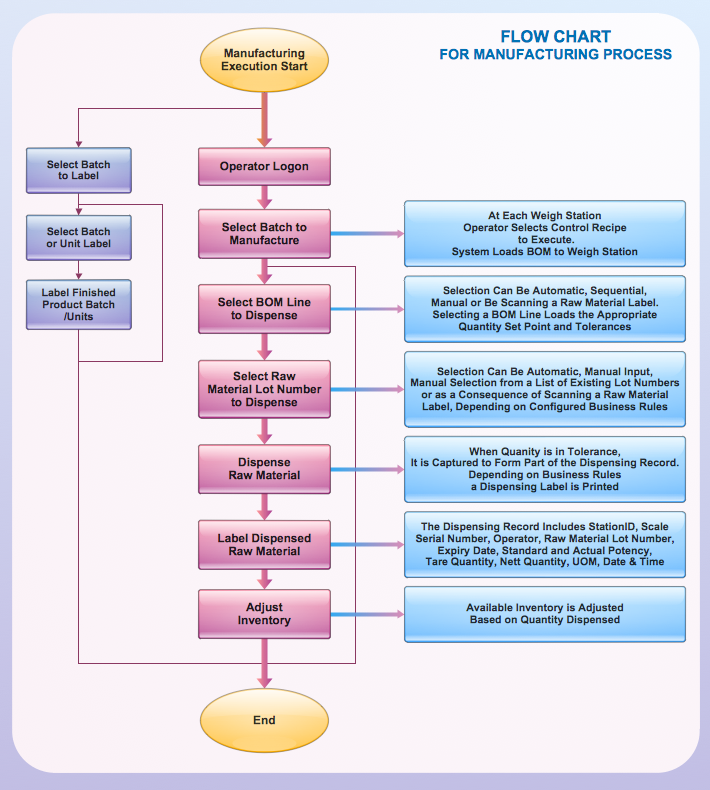
Flowcharts visualize a process or algorithm of program as step/operation blocks of various shapes connected with arrowed lines showed the process flow direction. They are used to visualize business or technical processes and software algorithms.
Conceptdraw DIAGRAM - feature-rich flowchart software. It will allow you to create professional looking flowcharts.
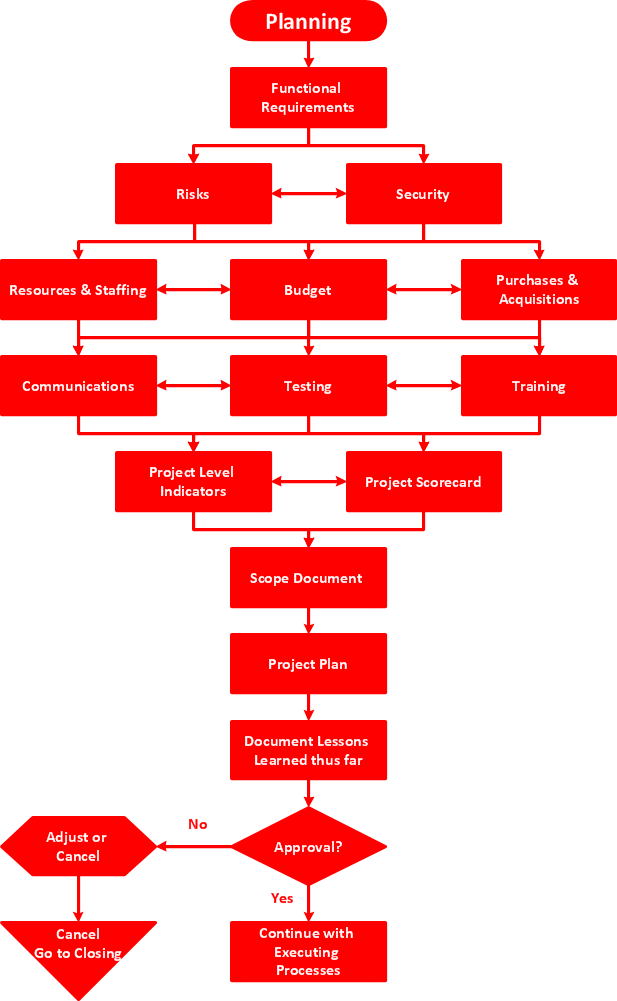
Flow chart is a diagrammatic representation of an algorithm and essential part of planning the system. Flow charts are widely used in technical analysis and programming for easy writing programs and explaining them to others. So, one of the most popular type of flow charts is Technical Flow Chart.
Technical Flow Chart can be drawn by pencil on the paper, but it will be easier to use for designing a special software. ConceptDraw DIAGRAM diagramming and vector drawing software extended with Flowcharts Solution from the Diagrams Area of ConceptDraw Solution Park will be useful for this goal.
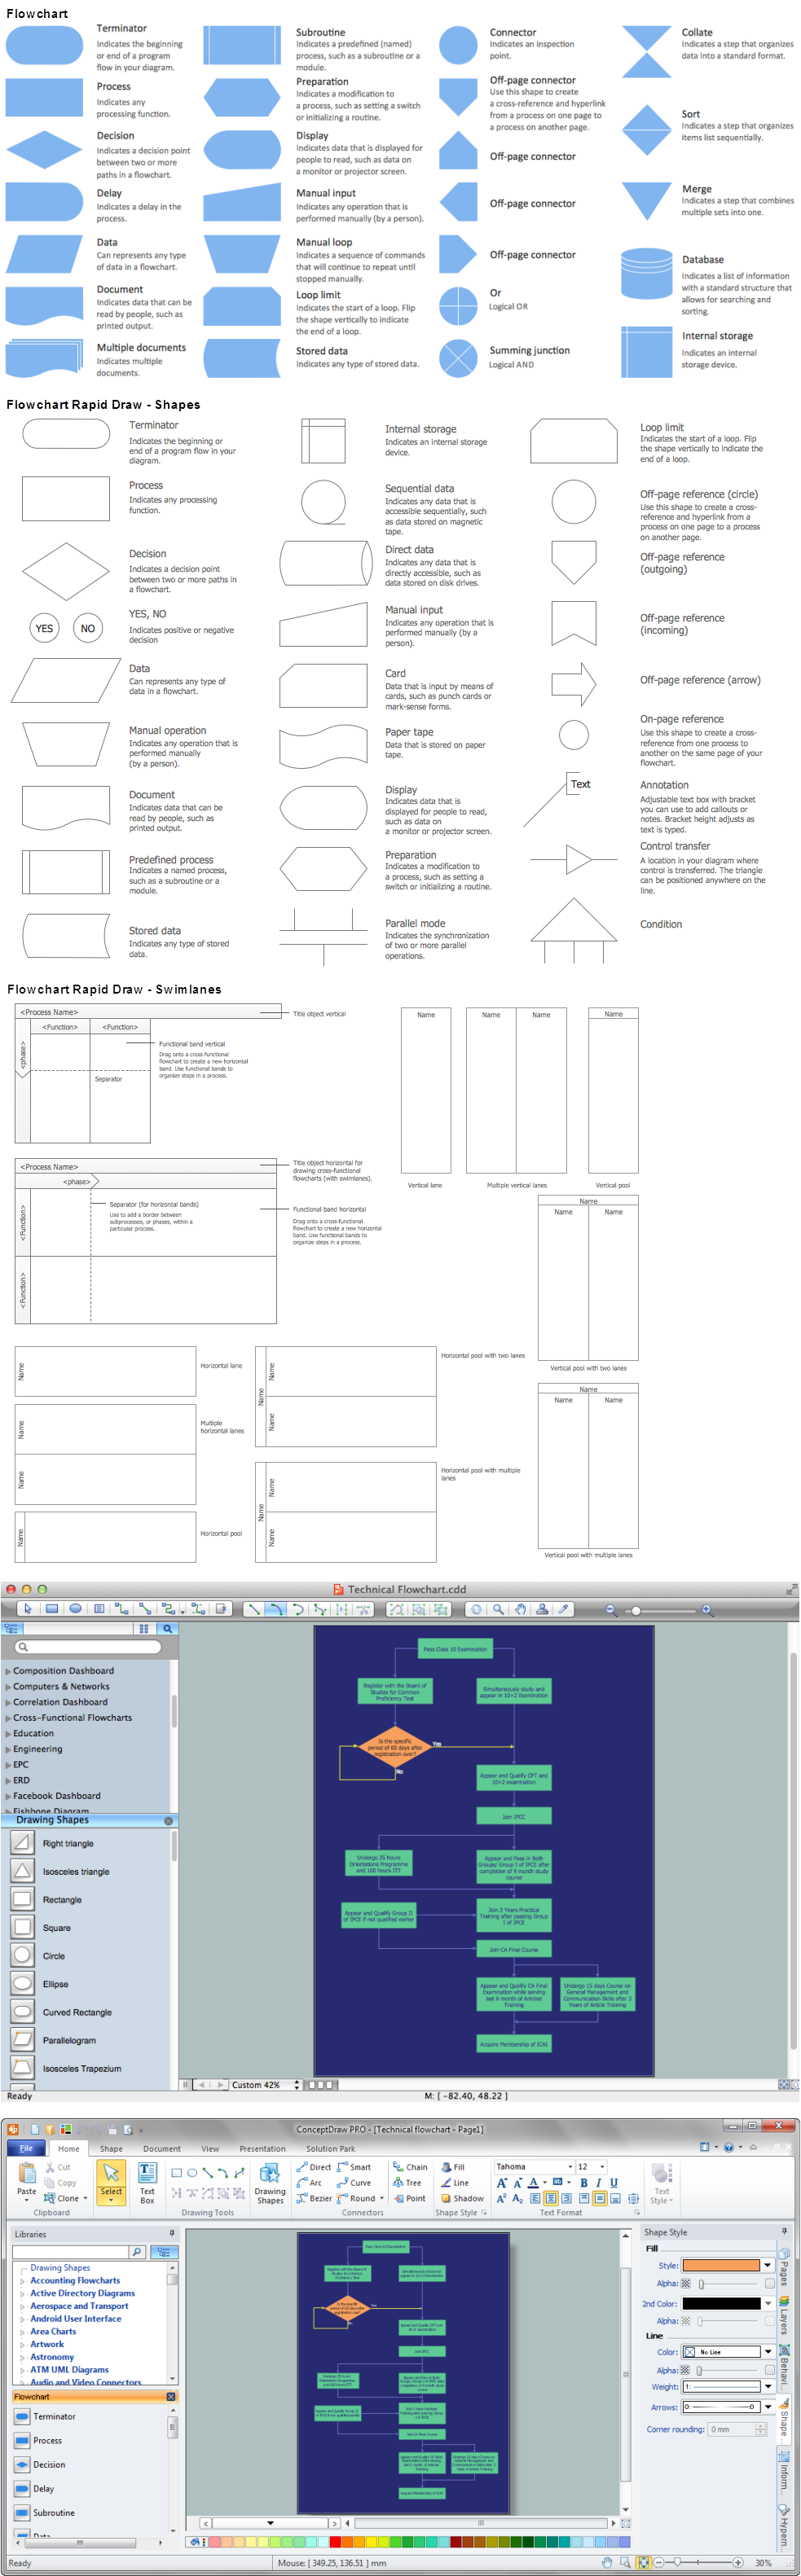
Fast visualization of structured data is main capability of the ConceptDraw DIAGRAM. With numerous vector stencils and standard flowchart symbols from object libraries and the RapidDraw technology this program stands as the best professional flowchart software for drawing with type of flowchart symbols. ConceptDraw DIAGRAM also known as best flowchart maker.
Picture: Easy Flowchart Program and Standard Flowchart Symbols
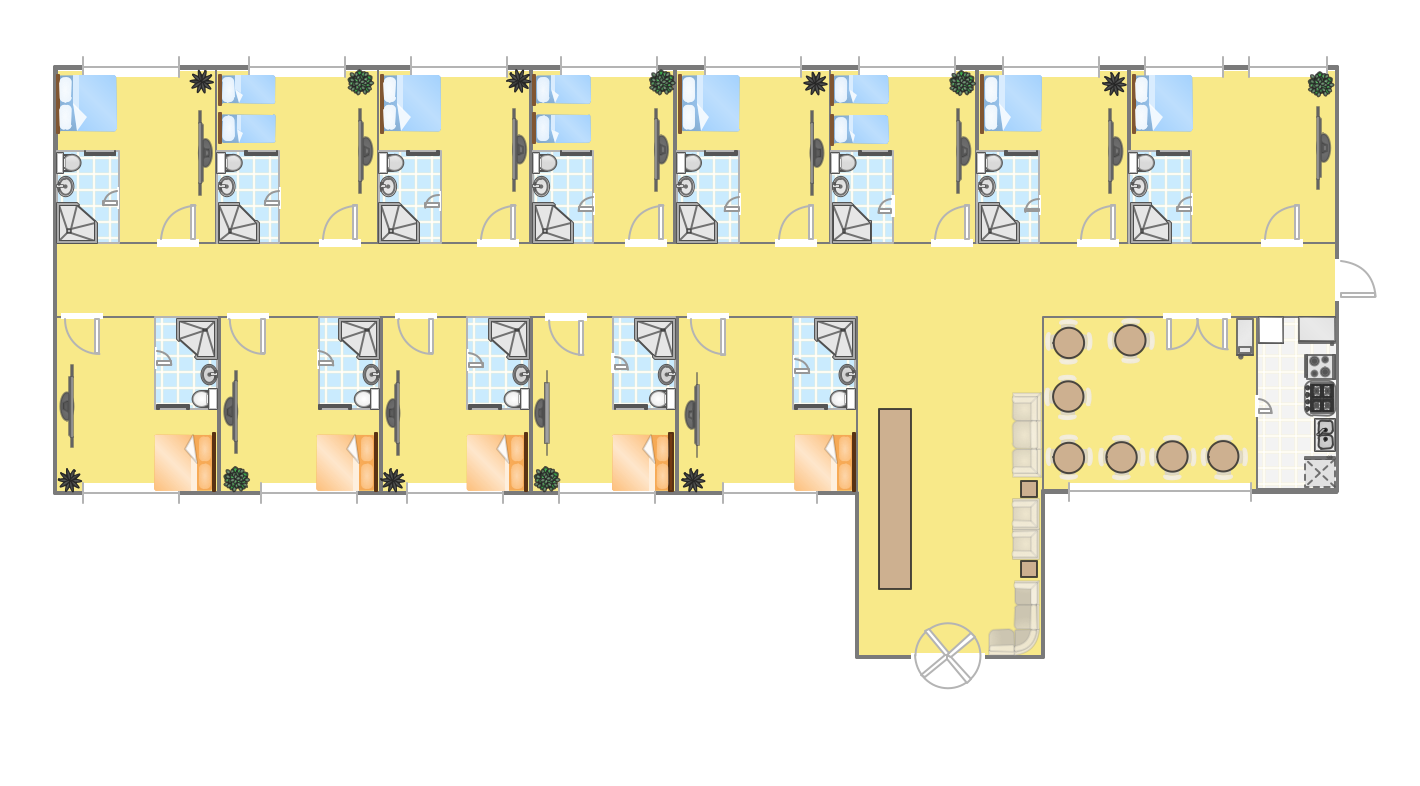
In case you need to make a plan for your own future hotel or to do it for someone else, then you can always find the way to make such template very quickly and to have a very good looking result in the end. Whichever type of the hotels you want to illustrate in a way of a floor plan, you can always do it with ConceptDraw DIAGRAM drawing application.
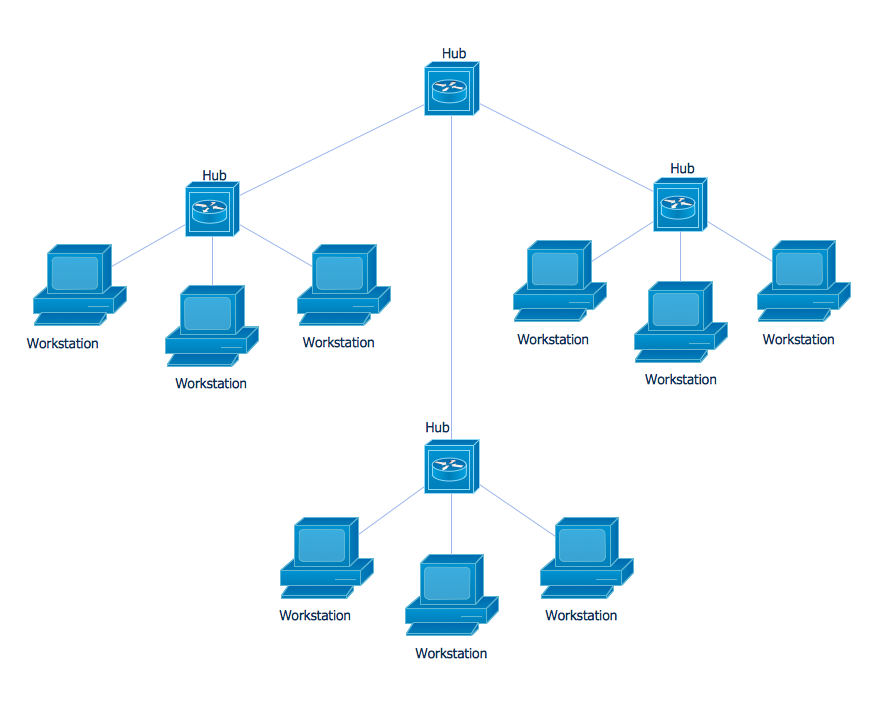
Nodes of any computer network are somehow organized in a hierarchy or a layout. Some of the common layouts like star network topology are more reliable and some like ring topology withstand high loads better. It is also important to distinguish logical topologies from physical.
This diagram represents a typical view of the star network topology. The star network topology is one of the most frequently used network topologies in the majority of office and home networks. It is very popular because of its low cost and the easy maintenance. The plus of the star network topology is that if one computer on the local network is downed, this means that only the failed computer can not send or receive data. The other part of the network works normally. The minus of using star network topology is that all computers are connected to a single point-switch, or hub. Thus, if this equipment goes down, the whole local network comes down.
In the case of origin of an emergency is very important to have a correct, clear and comprehensible action plan which will help you to react quicker and to make right decisions. ConceptDraw DIAGRAM software extended with Fire and Emergency Plans solution from the Building Plans Area of ConceptDraw Solution Park provides extensive drawing tools for quick and easy creating fire and emergency plans, and also a set of various templates and samples, among them the Emergency Action Plan Template.
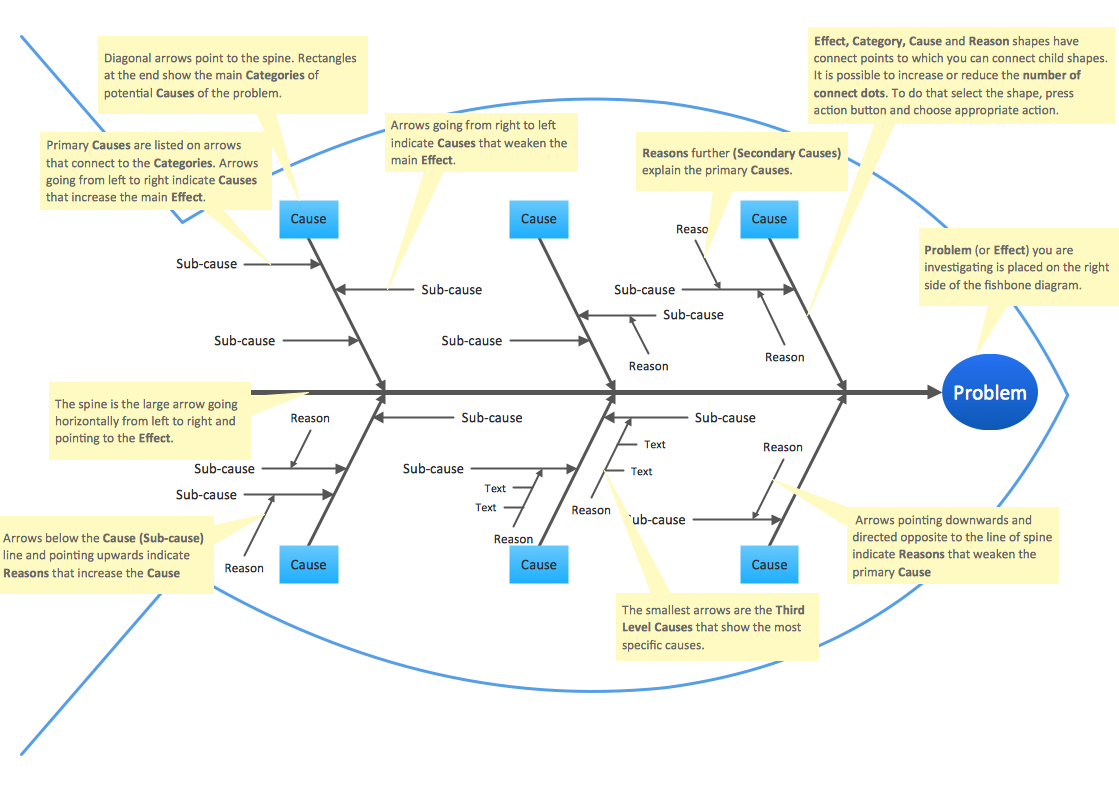
A causal model is an abstract concept, that describes the causal mechanisms of a system, by noting certain variables and their influence on each other, in an effort to discover the cause of a certain problem or flaw. This model is presented in diagram form by using a fishbone diagram.
ConceptDraw DIAGRAM diagramming and vector drawing software enhanced with Fishbone Diagrams solution helps you create business productivity diagrams from Fishbone diagram templates and examples, that provide to start using of the graphic method for the analysis of problem causes. Each predesigned Fishbone Diagram template is ready to use and useful for instantly drawing your own Fishbone Diagram.
Connecting objects manually in ConceptDraw DIAGRAM is a snap:
- points;
- Connecting groups of objects;
- Auto-routing;
- Connectors text;
- Snap to Guides ;
- Quick.
Take a look on an example of Cross-Functional-Flowchart, showing the software service cross-function process flowcharts among the different departments. It presents a simple flowchart among the customer, sales, technical support, tester and development.
Try now Flowchart Software and Cross-Functional library with 2 libraries and 45 vector shapes of the Cross-Functional Flowcharts solution. Then you can use built-in templates to create and present your software service cross-function process flowcharts.
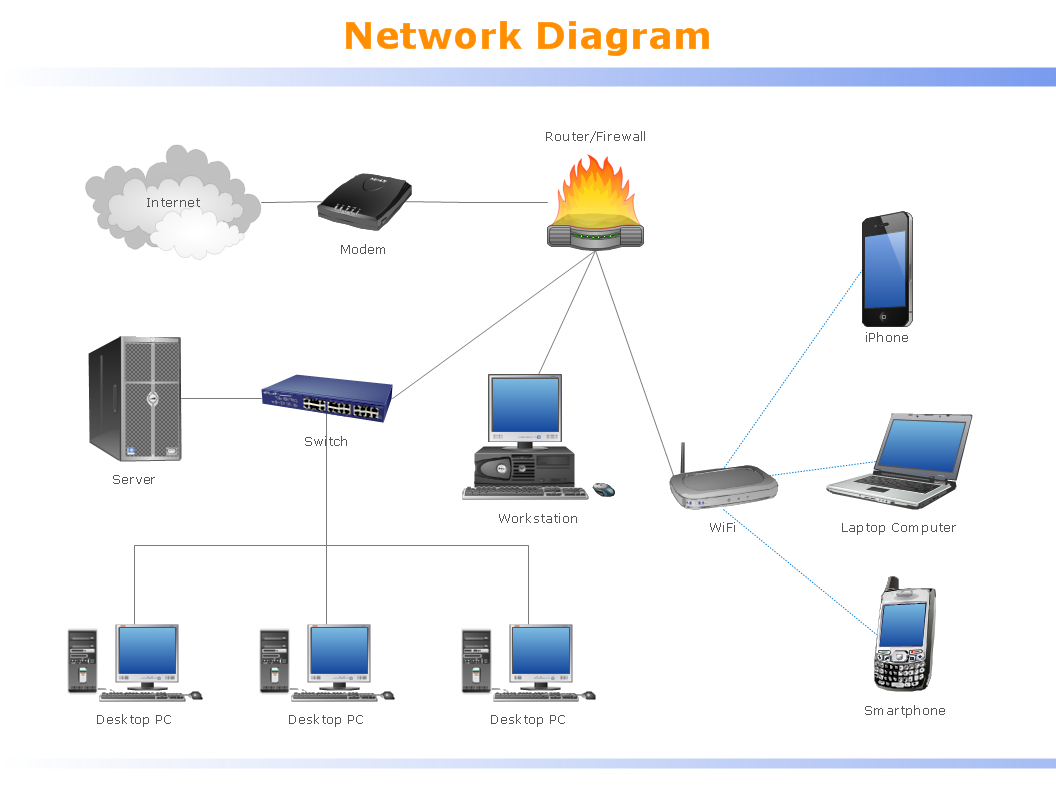
Computer networks nowadays are spread all across the world. The large number of parameters, such as geographic scale or communication protocols, can divide networks. One of the most common types of networks is called local area network (LAN). It convenient to represent network examples by means of diagrams.
This local area network (LAN) diagram provides an easy way to see the way the devices in a local network are interacted. The diagram uses a library containing specific symbols to represent network equipment , media and the end-user devices such as computers (PC, mac, laptop) , network printer, hubs, server and finally a modem. There are two types of network topologies: physical and logical. The current diagram represents precisely a physical type of LAN topology because it refers to the physical layout of a local network equipment.