A bubble chart is a type of chart that displays three dimensions of data. Bubble charts can facilitate the understanding of social, economical, medical, and other scientific relationships.
Bubble charts can be considered a variation of the scatter plot, in which the data points are replaced with bubbles.
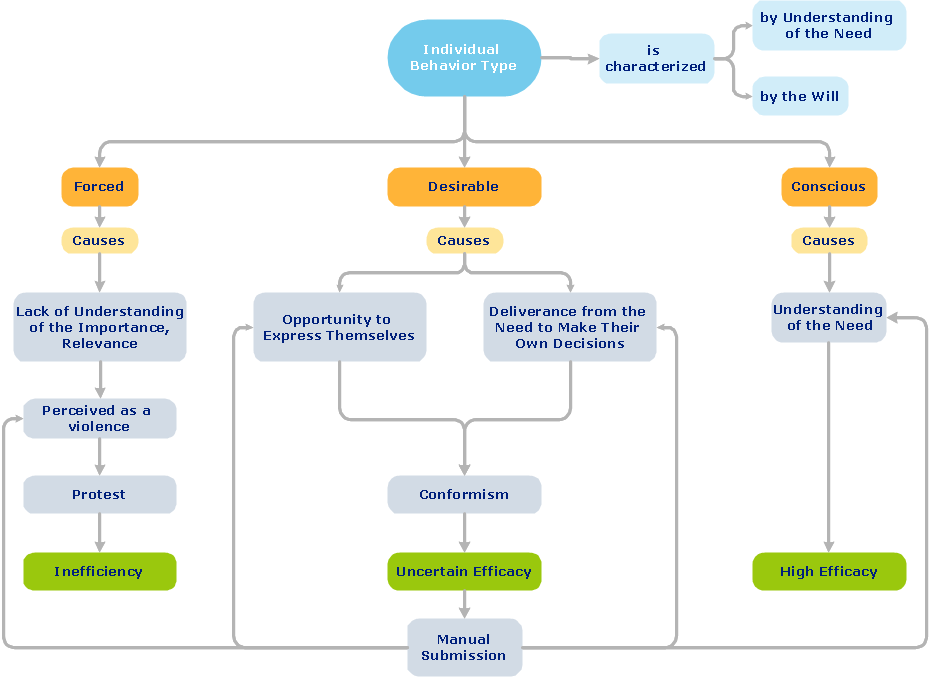
"Tree" Mode
How should diagramming software work? Is it possible to develop a diagram as quickly as the ideas come to you?
The innovative ConceptDraw Arrows10 Technology included in ConceptDraw DIAGRAM is a powerful drawing tool that changes the way diagrams are produced.
While making the drawing process easier and faster.
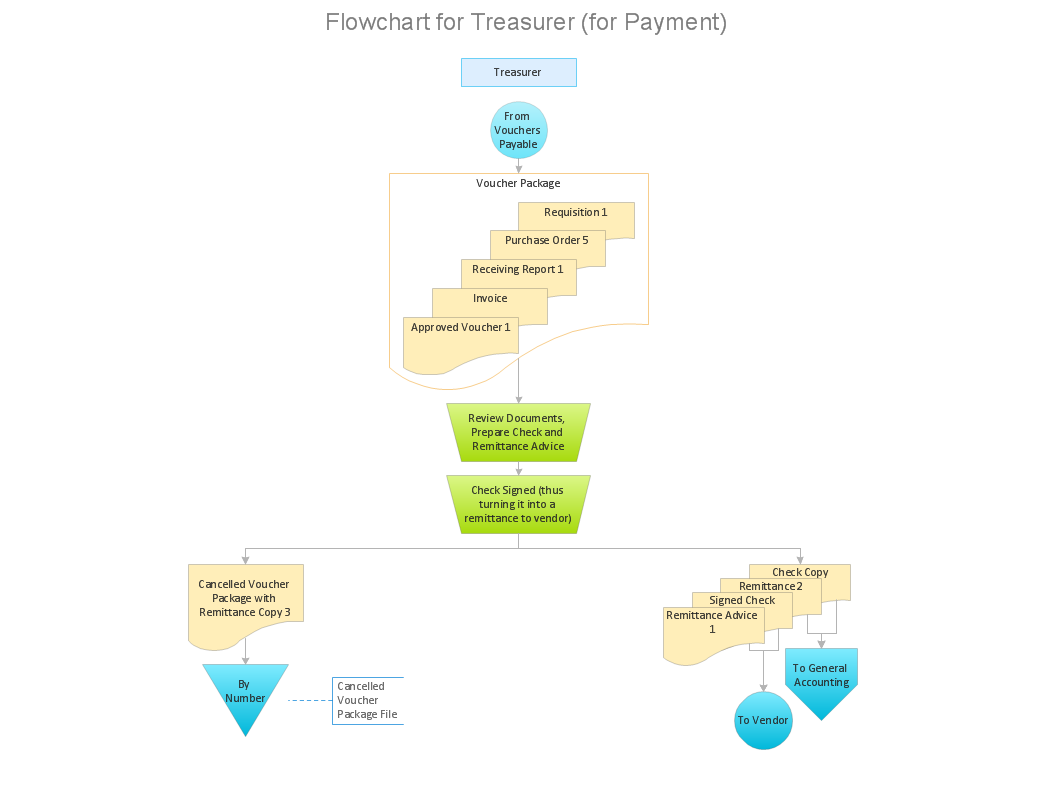
ConceptDraw DIAGRAM is a powerful tool that helps you create a process map diagram quickly and easily. Fine-tuning the objects in ConceptDraw DIAGRAM allows you to create a really professional finished article. ConceptDraw Arrows10 Technology gives drawing connectors a smart behavior that provides quick and precise placement, allows for easy changes and automatic rearrangement.
When the "tree" mode is switched on the next shape you add to your diagram is automatically connected to the initial shape. You can rapidly add shapes to your tree diagram by copying-and-pasting or using Ctrl+"drag-and-drop" combination.
Want to add the next level of shapes to your tree diagram. This easy to do by selecting a shape to make it the new initial shape for this level and continue adding shapes. The "tree" auto connection mode can help you easily create different types of structured diagrams; examples of these types of diagrams could be mind maps, organization charts, root cause diagrams, and more.
ConceptDraw DIAGRAM diagramming software provides vector shapes and connector tools for quick and easy drawing diagrams for business, technology, science and education.
Sample 1. Bubble diagram - Employee needs.
Use ConceptDraw DIAGRAM enhanced with solutions from ConceptDraw Solution Park to create diagrams to present and explain structures, process flows, logical relationships, networks, design schemes and other visually organized information and knowledge.
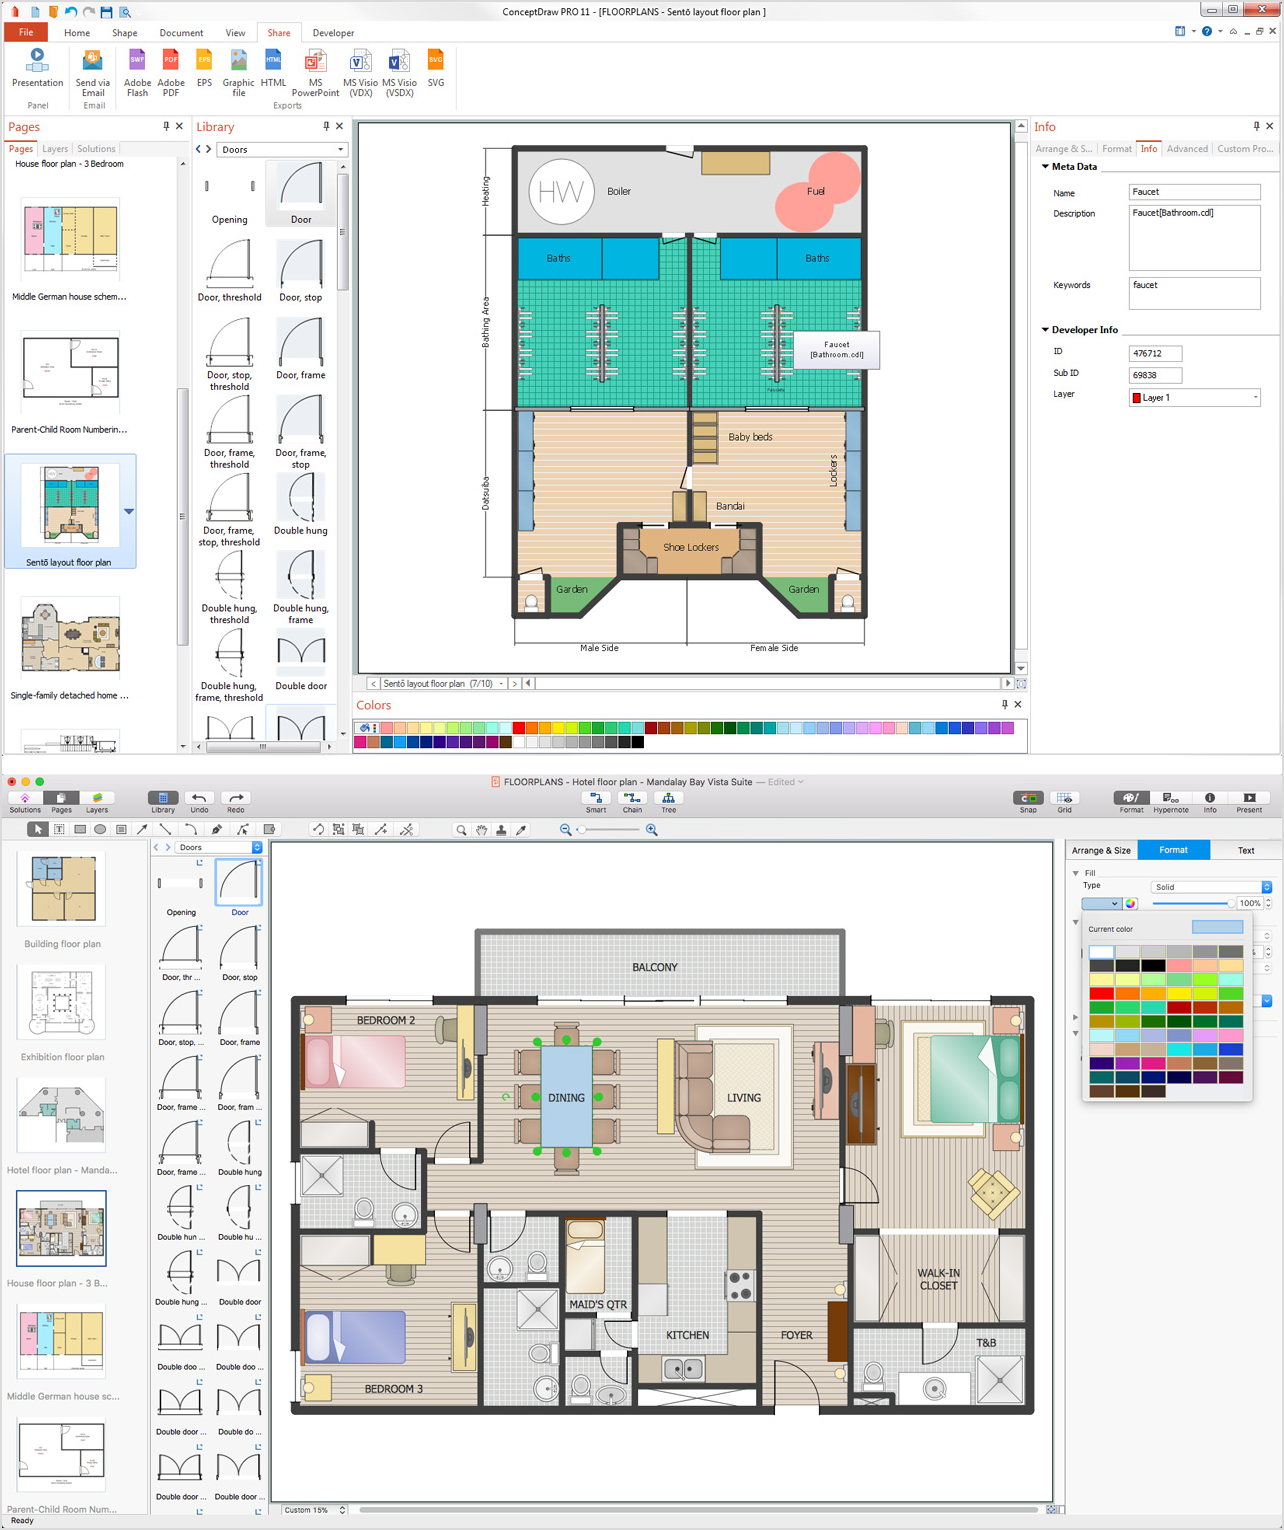
Architectural drawing allows to show the location of a building or ensemble of buildings on the ground, indicating the cardinal points. For centuries, people had been studying architecture in universities to learn how to draw building plans and now everyone can do it easily just using appropriate software. While developing the building plan, its graphic part, you can display the part of the floor or the entire floor of a building with an indication of the exact location of the drawn premise.
Small-sized apartments does not restrict the advanced interior design opportunities. Here is a detailed and precise floor plan of a pretty small apartment. A furniture objects are added to show possible interior of this home. This plan can be used to help somebody with a floor layout and furniture arrangement. Having this floor plan in a pocket while shopping would be useful to check if there is enough rooms for a new furniture.
You want to connecting objects manually?
You don't know how should diagramming software work?
Is it possible to develop a diagram as quickly as the ideas come to you?
Yes. The innovative ConceptDraw Arrows10 Technology - This is more than enough versatility to draw any type of diagram with any degree of complexity.
You can start draw your diagram manually now.
Basketball is a popular sport played by two teams of five players with a ball. The game takes place on a rectangular court. The team goal is to score a ball into the basket of the opponent team. The team with the most points wins the game.
ConceptDraw DIAGRAM diagramming and vector drawing software extended with Basketball solution from the Sport area of ConceptDraw Solution Park is a very useful tool for designing the basketball-related diagrams of any complexity.
Is it possible to develop a diagram as quickly as the ideas come to you? The innovative ConceptDraw Arrows10 Technology included in ConceptDraw DIAGRAM is a powerful drawing tool that changes the way diagrams are produced.
While making the drawing process easier and faster.
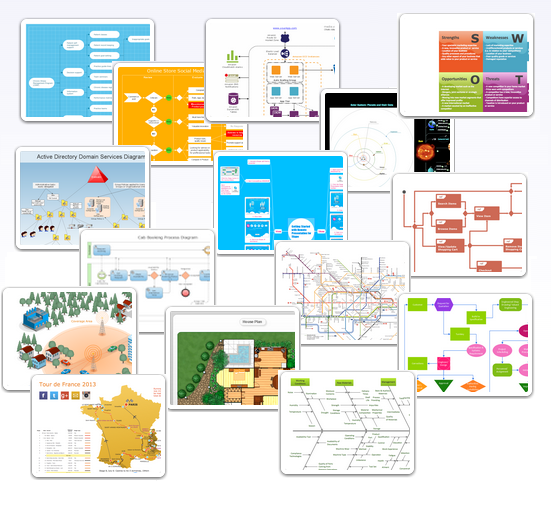
There are numerous articles about the advantages of flowcharting, creating business graphics and developing different charts. Nevertheless, these articles are almost useless without the main component - the examples of flowcharts, org charts and without a fine example, it is difficult to get all the conveniences of creating diagrams. You can find tons of templates and vivid examples on Solution Park.
This illustration shows a variety of business diagrams that can be created using ConceptDraw DIAGRAM. It comprises a different fields of business activities: management, marketing, networking, software and database development along with design of infographics and business illustrations. ConceptDraw DIAGRAM provides a huge set of sample drawings including business process modeling diagrams,, network diagrams, UML diagrams, orgcharts, DFD, flowcharts, ERD, geographical maps and more.
Picture: Examples of Flowcharts, Org Charts and More
Onion diagram is a type of circular diagram that consists of the core circle representing the product/solution and concentric circles around it, which dependent on the core and look like the cross sections of onion.
ConceptDraw DIAGRAM diagramming and vector drawing software supplied with Stakeholder Onion Diagrams Solution from the Management Area of ConceptDraw Solution Park is an ideal software for effective Onion diagram process design.
Living room is the place where all family comes together, where receive guests. The interior of the living room complements the piano which helps to create a warm atmosphere. The piano is not just a musical instrument, in the room interior it becomes the most noticeable detail. The piano always organically entered in any interior.
Best Interior Design Software for Mac OS&Windows ConceptDraw DIAGRAM allows you design the interior of your dreams quick and easy.