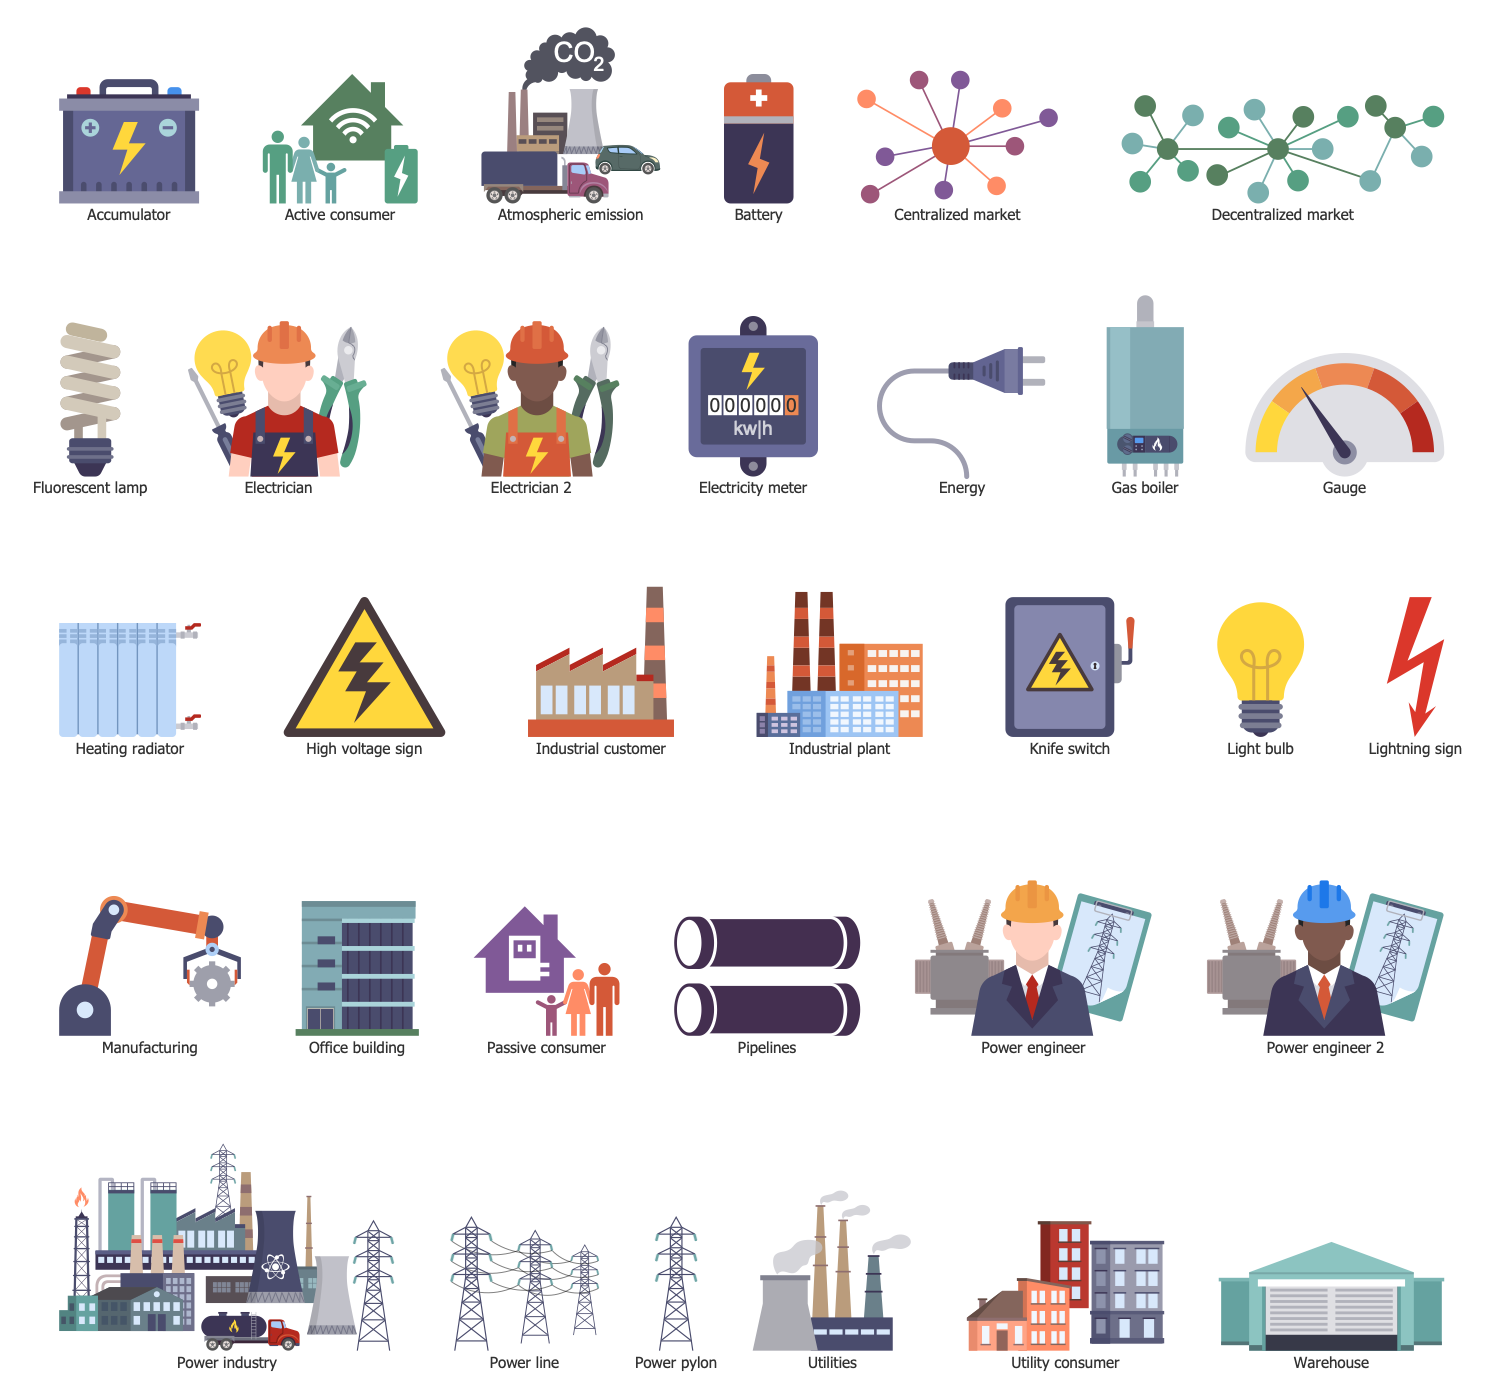
Energy Icons
The energy industry comprises all processes concerning extraction, manufacturing, refining, and distribution of energy. The energy is extracted from different substances and used to serve many useful purposes. It is extracted from fuels, electricity as a product of processing the primary energy sources, non-renewable resources like oil, gas, coal, and renewable resources like solar, wind, water, geothermal sources, biofuel.
Today the volume of use of non-renewable fuels to produce energy is more than renewable. However the processing and consumption of non-renewable energy resources affect the environment and this impact is not favorable, it causes pollution. Moreover, the earth's resources are rapidly dwindling while the population grows, manufacturing volumes increase and energy demands grow as well. In this way management of energy resources has crucial reasons. The development of new solutions, energy conservation, efficient use of energy, and increasing the volumes of use of renewable resources are required. Increased use of renewable resources is able to mitigate or eliminate a wide range of negative impacts of previous use of carbon-emitting energy sources.
The resources management helps to use energy resources efficiently, minimize energy wastage, eliminate extra costs, balance justifiable energy demand with energy supply. The use of renewable energy resources allows decreasing noxious emissions. Toxic and greenhouse gases and trace metals are released into the environment during fuel combustion and pollute it. Toxic gases include carbon dioxide, nitrogen oxide, sulfur dioxide and trioxide. Chromium, mercury, copper, manganese, beryllium, cadmium, nickel, and silver belong to the released trace metals.

Example 1. Energy Icons in ConceptDraw DIAGRAM software
New ways according to the development of safe and efficient energy manufacturing are actively created. ConceptDraw DIAGRAM vector charting software is the best solution to show these ways in a visual view. The ConceptDraw's Energy Industry Infographics solution with predesigned energy icons is helpful to illustrate the problem of pollution environment and ways to decrease emissions. It is helpful to show the processes of mining fossils and power generation, steps of nuclear fuel process, ways of power plant optimization and improvement efficiency of processing energy.
Example 2. Smart Grid
Simply drag and drop the required icons from the libraries of the Energy Industry Infographics solution. Arrange these objects in a desired way, type the text and get your exceptional illustration in minutes.
Example 3. American Distribution System
The samples you see on this page are infographics made for the energy industry. They were created in ConceptDraw DIAGRAM software using the energy icons from the Energy Industry Infographics Solution for ConceptDraw Solution Park. An experienced user spent 10-15 minutes creating each of these samples.
Use the Energy Industry Infographics Solution for ConceptDraw DIAGRAM software to develop your own professional-looking diagrams related to the energy industry quickly, simply, and effectively.
The possibility of exporting to a variety of popular graphical formats (PNG, JPEG, JPG, GIF, TIF, TIFF, BMP, DIB, EMF, SVG) and file formats like Microsoft PowerPoint (PPT), Adobe Acrobat (PDF), Microsoft Visio (VDX, VSDX), Adobe Flash (SWF), Encapsulated PostScript (EPS), HTML, opens wide opportunities for you.