EPC (Event-driven Process Chain) Flowcharts
Event-driven Process Chain
The Event-driven Process Chain (EPC) allows managers visually present business process models for making decisions for business processes improvement. The EPC is able to cope with extremely diverse and complex businesses processes.
ConceptDraw DIAGRAM is a software for making EPC diagrams that provide company performance.

Pic.1 Login and registration processing - EPC diagram sample.
The Event-driven Process Chain Diagrams solution extends ConceptDraw DIAGRAM software with EPC templates, samples, and vector shape library for the drawing of EPC diagrams.
The Event-driven Chain Diagrams solution assists in the planning of resources and improves business processes using EPC flowcharts.
TEN RELATED HOW TO's:
Event-Driven Process Chain Diagrams for improvement throughout an organisation.
ConceptDraw DIAGRAM - software that reduces the time needed to create a business process model.
Picture: EPC for Configuring an Enterprise Resource Planning
Related Solution:
Public catering business will always be in demand.To attract a lot of clients, it’s important to have a detailed banquet hall plan, a diverse menu and reasonable prices. If you want to create a good plan, you can use drawing software.
When planning and considering the layout of a banquet hall, one must take into consideration, that it is very significant to make it stylish with correctly selected appointment and celebratory belongings. Tables and seating must be handily arranged. The furniture arrangement can changes depending on client requirements, kind of banquet and amount of guests. ConceptDraw Cafe and Restaurant Plans solution supplies a dozens of predesigned vector graphic objects of banquet furniture and accessories. Thus you can design the Banquet Hall layout for the celebrations in any style and any number of guests.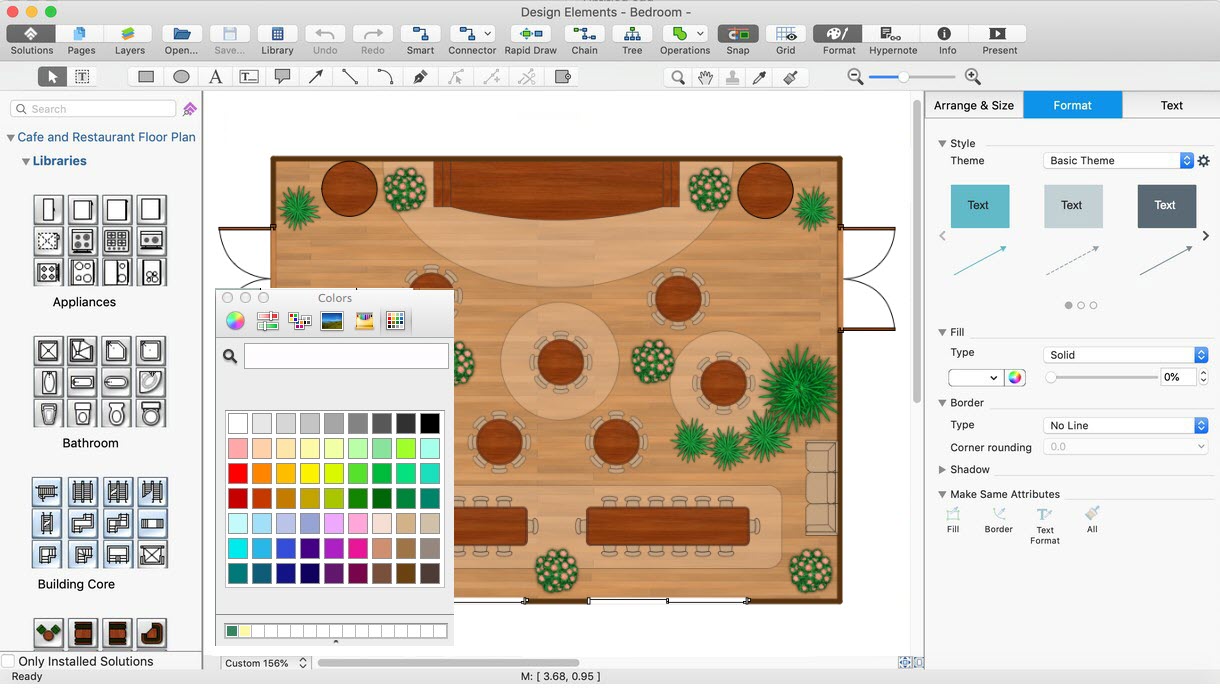
Picture: Banquet Hall Plan Software
Related Solution:
Create your own flow charts of computer or network system account processing using the ConceptDraw DIAGRAM.
Picture:
Account Flowchart
Flowchart ExamplesRelated Solution:
ConceptDraw DIAGRAM extended with Windows 8 User Interface solution from the Software Development area is the best gui software. Using the drawing tools, libraries of vector objects, graphical user interface examples that offers Windows 8 User Interface solution, you will easily design the Windows 8 user interfaces and Windows 8 UI design patterns of any complexity.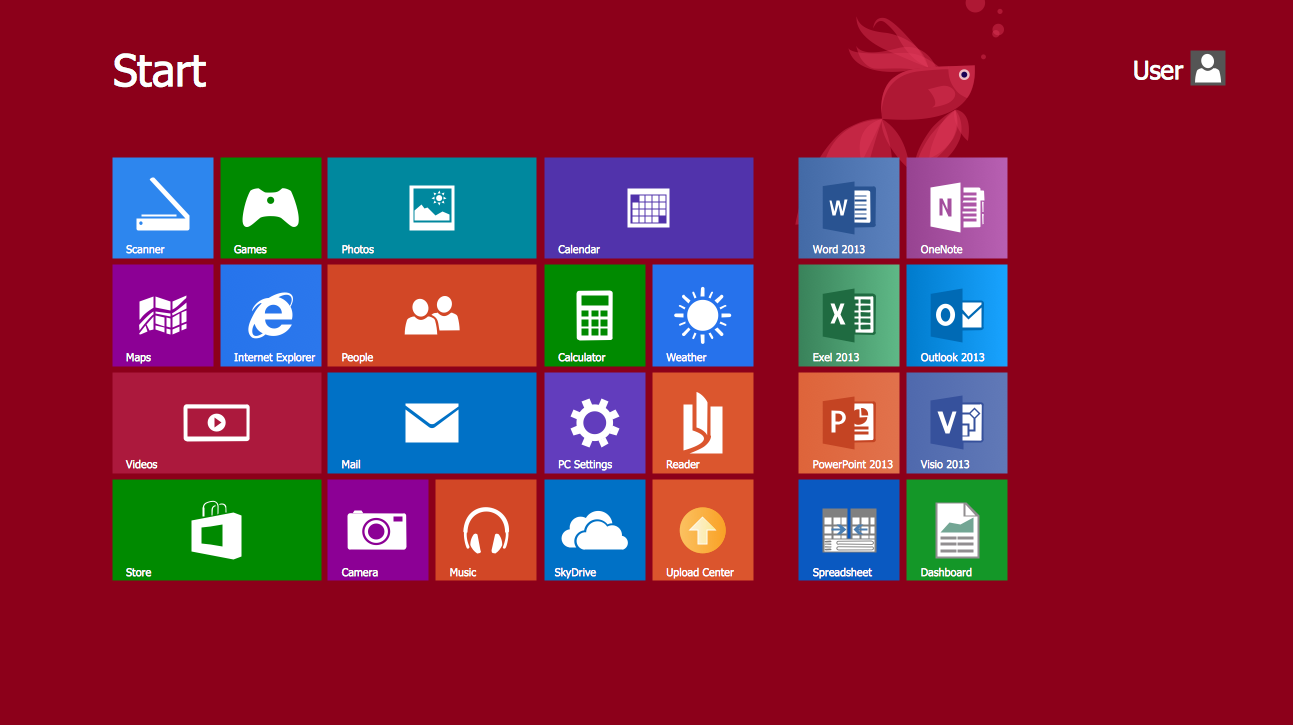
Picture: Graphical User Interface Examples
Related Solution:
A flowchart is a widely used type of diagram that visually represents an algorithm, workflow or process, using the boxes of various kinds to depict the steps and connecting them with arrows to show the order of execution these steps. Еhe ConceptDraw DIAGRAM supplied with Accounting Flowcharts Solution from the Finance and Accounting Area of ConceptDraw Solution Park is a powerful diagramming and vector drawing software which ideally suits for designing Ordering Process Flowchart of any complexity.
Picture: Ordering Process Flowchart. Flowchart Examples
Related Solution:
Event-Driven Process chain Diagrams for improvement throughout an organisation.
ConceptDraw DIAGRAM - software that reduces the time needed to create a business process model.
Picture: Why do we Need EPC Diagrams
Related Solution:
Data processing can be very complex sometimes. If you are interested in facilitating your work with data, it’s time to learn how to draw flowcharts with special software or using just a piece of paper. The list of flowchart basic symbols includes rectangles, diamond, ellipses etc. and is used to represent processes, actions, decisions or data processing.
A well-done flowchart bring the clearness of the sequence of a process stages. There are number of symbols that can be used in flow charts to show various sorts of steps. The basic flowchart can be created using a few of them: Process, Decision, Start/Finish. A basic element of a flowchart represents a simple action and looks like a box, that contains a description of the action. The depicting of actions sequence is made with arrows between corresponding action boxes, as you can see on the sample diagram. Also it shows the symbols for flowchart start and finish steps. ConceptDraw Flowcharts solution provides the ability to build basic flow charts as well as the ones of any size and complexity with a minimum of actions.
Picture: How to Draw a Flowchart: Step-by-Step Guide
Related Solution:
Collaboration tool for project management enables you to give a new role to knowledge management and document sharing within your team.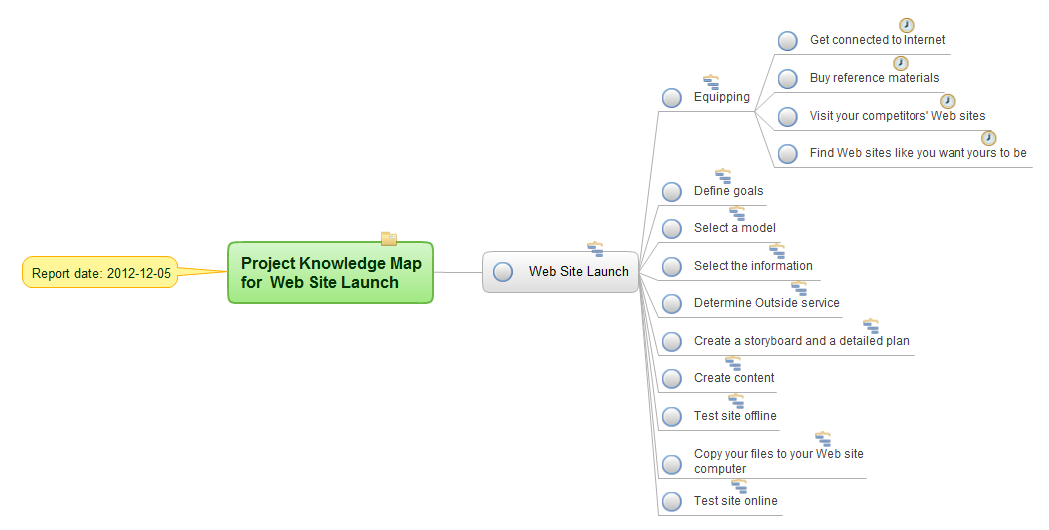
Picture: How To Use Collaboration Tool in Project Management
Related Solution:
The Event-driven Process Chain ( EPC ) Diagrams allows users present business process models in terms of work flows. The EPC diagram can show various ways for improvement throughout an organisation.
Picture: EPC Diagrams Illustrate Business Process Work Flows
Related Solution:
ConceptDraw DIAGRAM diagramming and vector drawing software offers the Event-driven Process Chain Diagrams EPC Solution from the Business Processes Area of ConceptDraw Solution Park with powerful drawing tools to help you draw the EPC diagram of any complexity quick and easy.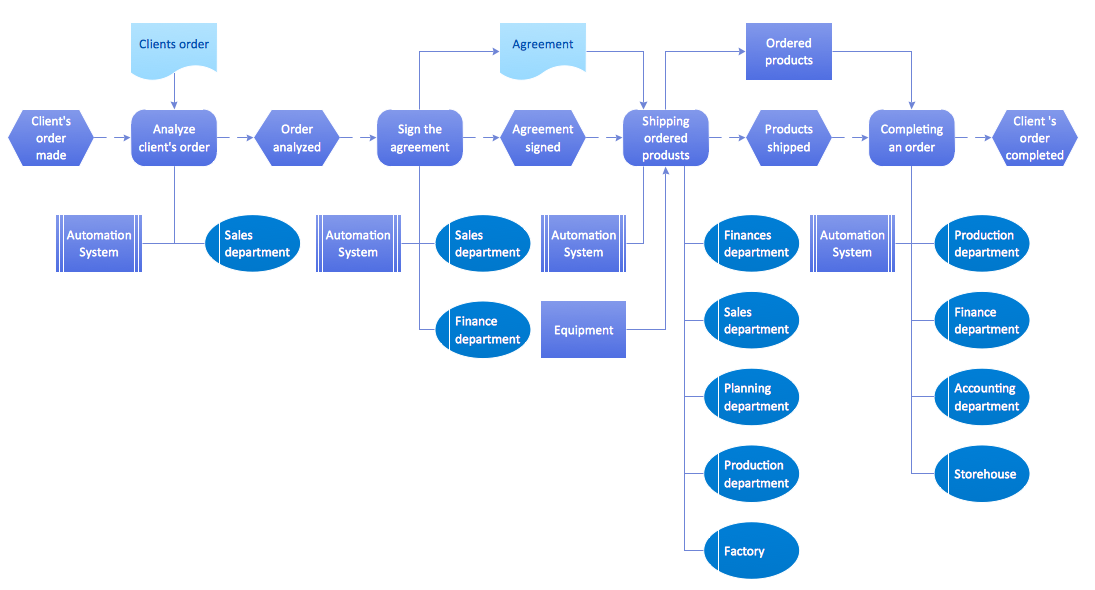
Picture: EPC Diagram
Related Solution:
ConceptDraw
DIAGRAM 18