
Example 1. Components of ER Diagram, Crow's Foot and Chen's notations
The Chen's ERD notation is still used and is considered to present a more detailed way of representing entities and relationships.
Most other notation systems are adaptations, or use part of these original styles. Here is a brief list of some of other standards that have been developed:
- Bachman notation
- Barker’s notation (ERDs for Oracle)
- EXPRESS and EXPRESS-G notation
- IDEFX1
- UML class diagrams
- Merise
- Object role modeling
- (Min – Max) notation

Example 2. ER Diagram, Chen's notation
ERDs are an invaluable tool for software engineers, particularly since computing capacity, and thus data storage capacity, has markedly increased in recent years. They allow every aspect of database design to be managed, tested and communicated before implementation. Because ERDs have such a broad scope of influence across database activities, it’s imperative the standardized notation can be utilized and interpreted by a wide variety of stakeholders.

Example 3. ER Diagram, Crow's Foot
The Entity-Relationship Diagram (ERD) solution from ConceptDraw Solution Park extends ConceptDraw DIAGRAM ector graphics and diagramming software with the ability to draw your own entity relationship diagrams using Chen's or Crow's Foot notations applying 2 libraries with numerous predesigned ER icons:
- ERD, Chen's Notation library
- ERD, Crow's Foot Notation library

Example 4. ERD Solution
The samples you see on this page were created in ConceptDraw DIAGRAM using the components of ER diagram from the libraries of Entity-Relationship Diagram (ERD) Solution. An experienced user spent 10-15 minutes creating each of these samples.
Use the Entity-Relationship Diagram (ERD) Solution for ConceptDraw DIAGRAM to create your own Entity-Relationship Diagrams of any complexity quick, easy and effective.
The Entity-Relationship Diagrams designed with ConceptDraw DIAGRAM are vector graphic documents and are available for reviewing, modifying, converting to a variety of formats (image, HTML, PDF file, MS PowerPoint Presentation, Adobe Flash or MS Visio), printing and send via e-mail in one moment.
TEN RELATED HOW TO's:
Local area network connects computers and other network appliances within an area, such as office building or a campus. It can be difficult to provide such network without a predesigned plan. For these purposes you can use network diagram software, which helps you to create LAN network diagrams and office network diagrams quickly and effortless. This will speed up your work and you can save the diagram for the future network improvements.
The following diagram illustrates a network topology of the small office. LAN configuration has a star topology. The local network joins 8 computers among which are several desktop PCs, laptop, two iMacs and iBook. The end-point devices are divided into three groups. Each group is connected to its hub. There is a network printer and a modem, which are interconnected with other devices through a network server. Each computer on the LAN can access the server through a corresponding hub.
Picture: Network Diagram Software. LAN Network Diagrams. Physical Office Network Diagrams
Related Solution:
For depicting the onion model are actively used Stakeholder Onion Diagrams. The ConceptDraw DIAGRAM diagramming and vector drawing software extended with Stakeholder Onion Diagrams Solution from the Management Area of ConceptDraw Solution Park offers the number of useful tools and Stakeholder Onion Diagram template for their easy design.
Picture: Stakeholder Onion Diagram Template
Related Solution:
Process mapping helps with sharing business results and reorganizing workflow. In almost every case, after creating a sales process flowchart the steps that are redundant become obvious for a manager. It's easy to find a flowchart examples that will help in developing one for your business.
This sales process flowchart consists of a sequence of steps that represent a simple sale process. Each step is shown graphically by a rectangle representing processing steps or an activity, or a diamond representing a decision. These rectangles are linked by arrows, that indicate the direction of the sales workflow. ConceptDraw Sales Flowcharts solution delivers a the full set of classical flowchart notation symbols, along with sales-related icons and pictograms.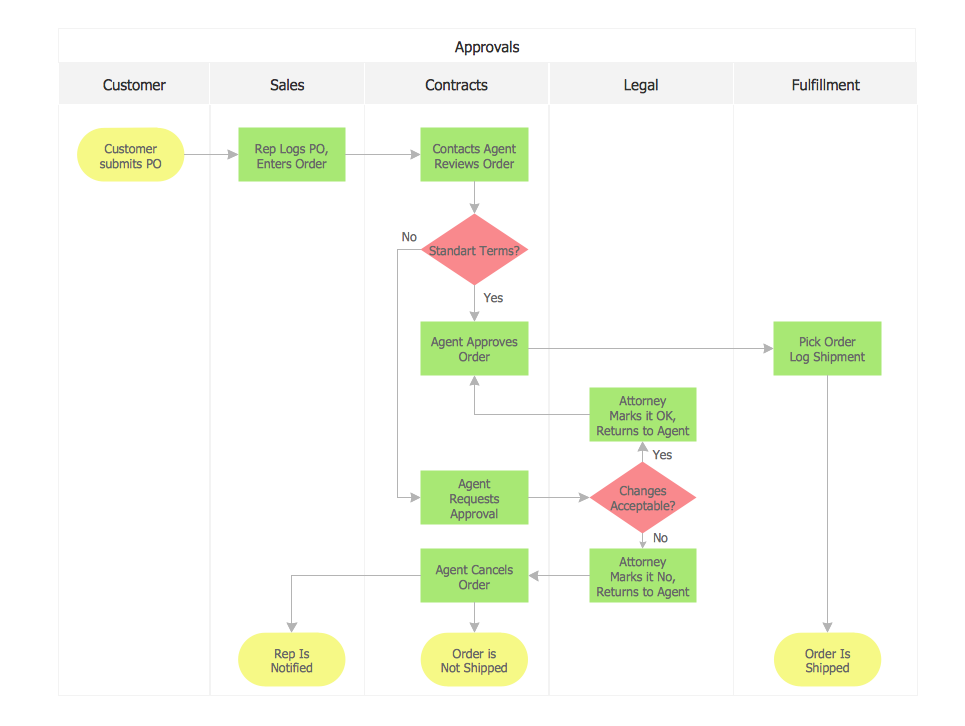
Picture:
Sales Process Flowchart
Flowchart Examples
Related Solutions:
While creating flowcharts and process flow diagrams, you should use special objects to define different statements, so anyone aware of flowcharts can get your scheme right. There is a short and an extended list of basic flowchart symbols and their meaning. Basic flowchart symbols include terminator objects, rectangles for describing steps of a process, diamonds representing appearing conditions and questions and parallelograms to show incoming data.
This diagram gives a general review of the standard symbols that are used when creating flowcharts and process flow diagrams. The practice of using a set of standard flowchart symbols was admitted in order to make flowcharts and other process flow diagrams created by any person properly understandable by other people. The flowchart symbols depict different kinds of actions and phases in a process. The sequence of the actions, and the relationships between them are shown by special lines and arrows. There are a large number of flowchart symbols. Which of them can be used in the particular diagram depends on its type. For instance, some symbols used in data flow diagrams usually are not used in the process flowcharts. Business process system use exactly these flowchart symbols.
Picture: Flowchart Symbols: Meaning and Examples
Related Solution:
ORM diagrams are a straightforward and incredibly effective way to explore domain concepts with your stakeholders.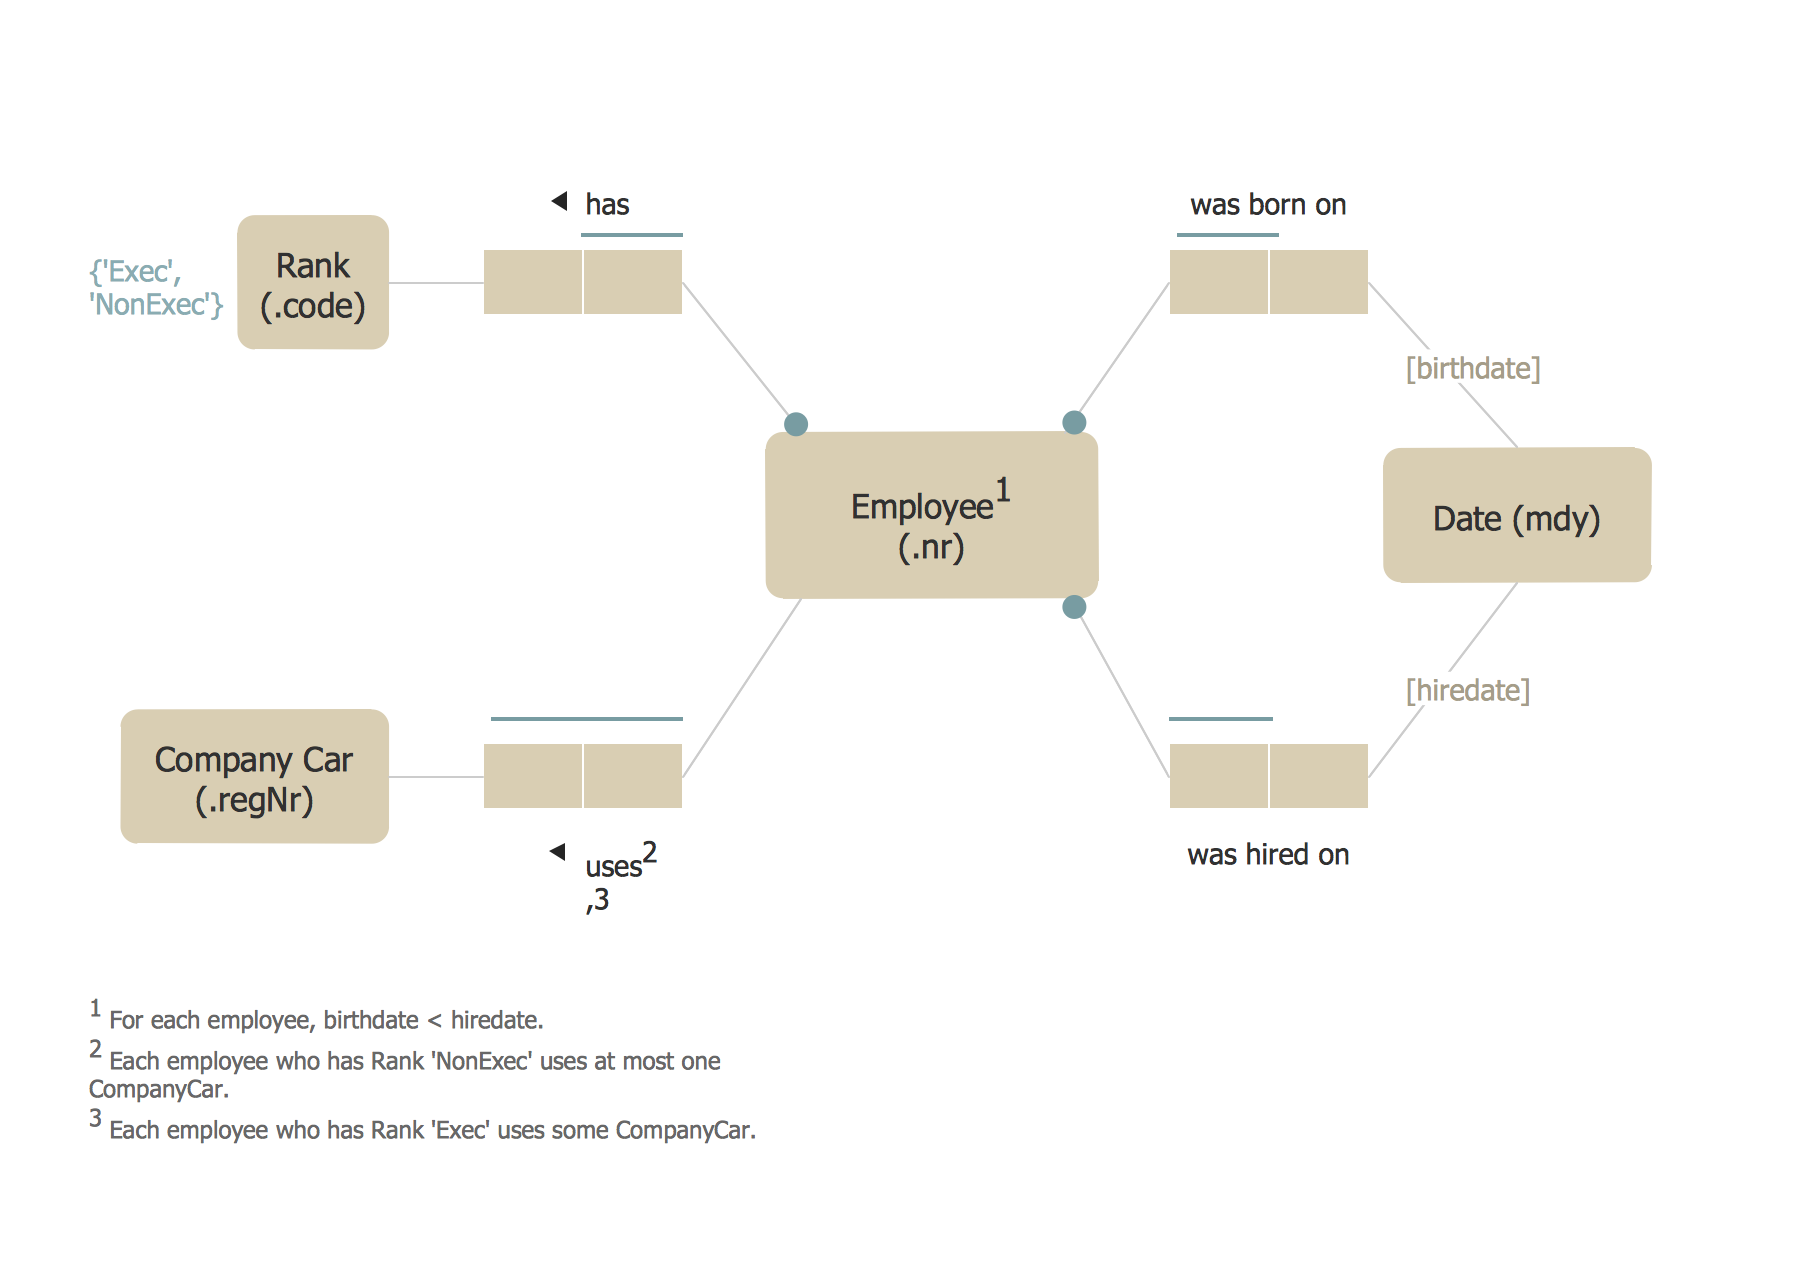
Picture: ORM Diagram
A flowchart is a powerful tool for examining processes. It helps improving processes a lot, as it becomes much easier to communicate between involved people, to identify potential problems and to optimize workflow. There are flowcharts of different shapes, sizes and types of flowchart vary from quite basic process flowcharts to complex program flowcharts. Nevertheless, all these diagrams use the same set of special symbols like arrows to connect blocks, parallelogram to show data receiving or rectangles for showing process steps.
Basic flowcharts are used to represent a simple process algorithm. A basic flowchart notation consists of rectangles (business processes), arrows (the flow of information, documents, etc.). The same notation is used in items such as the "decision", which allow you to do the branching. To indicate the start of the entire business process and its termination can be used the "Terminator" element. The advantages of Basic Flowchart are simplicity and clarity. With it you can quickly describe the business process steps. Creating of Basic Flowchart does not require any special knowledge, as easily understand by employees with different levels of education and IQ.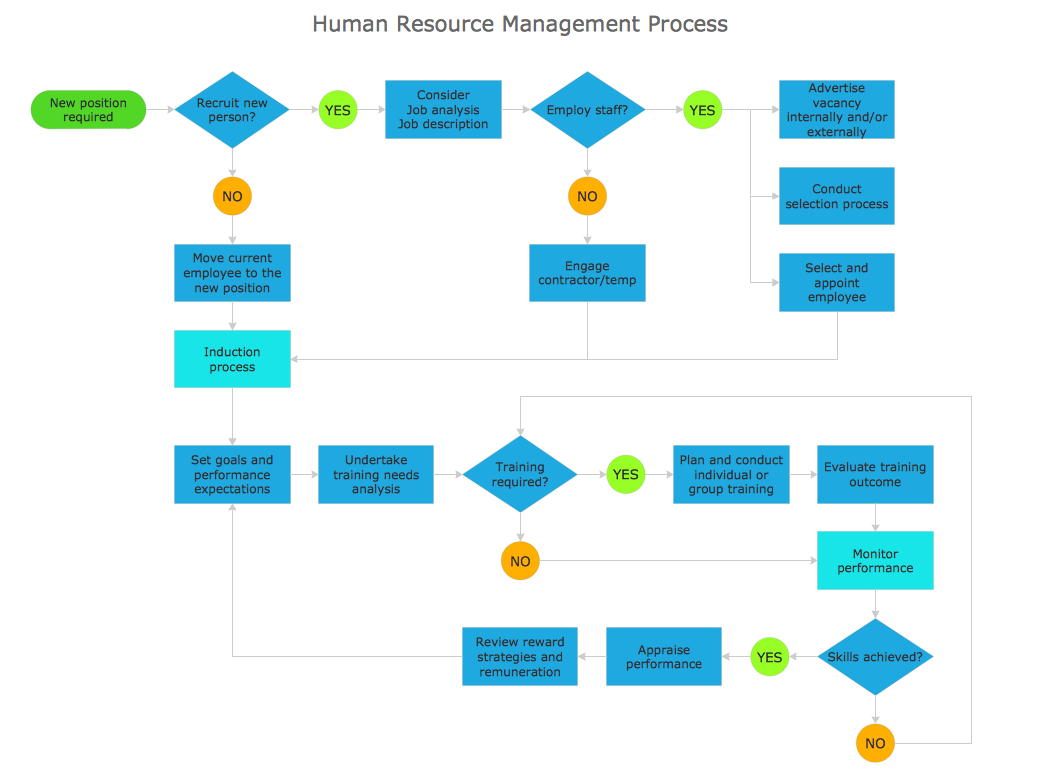
Picture: Types of Flowchart: Comprehensive Overview
Related Solution:
UML Class Diagrams describes the structure of a system by showing the system's classes, their attributes, and the relationships among the classes.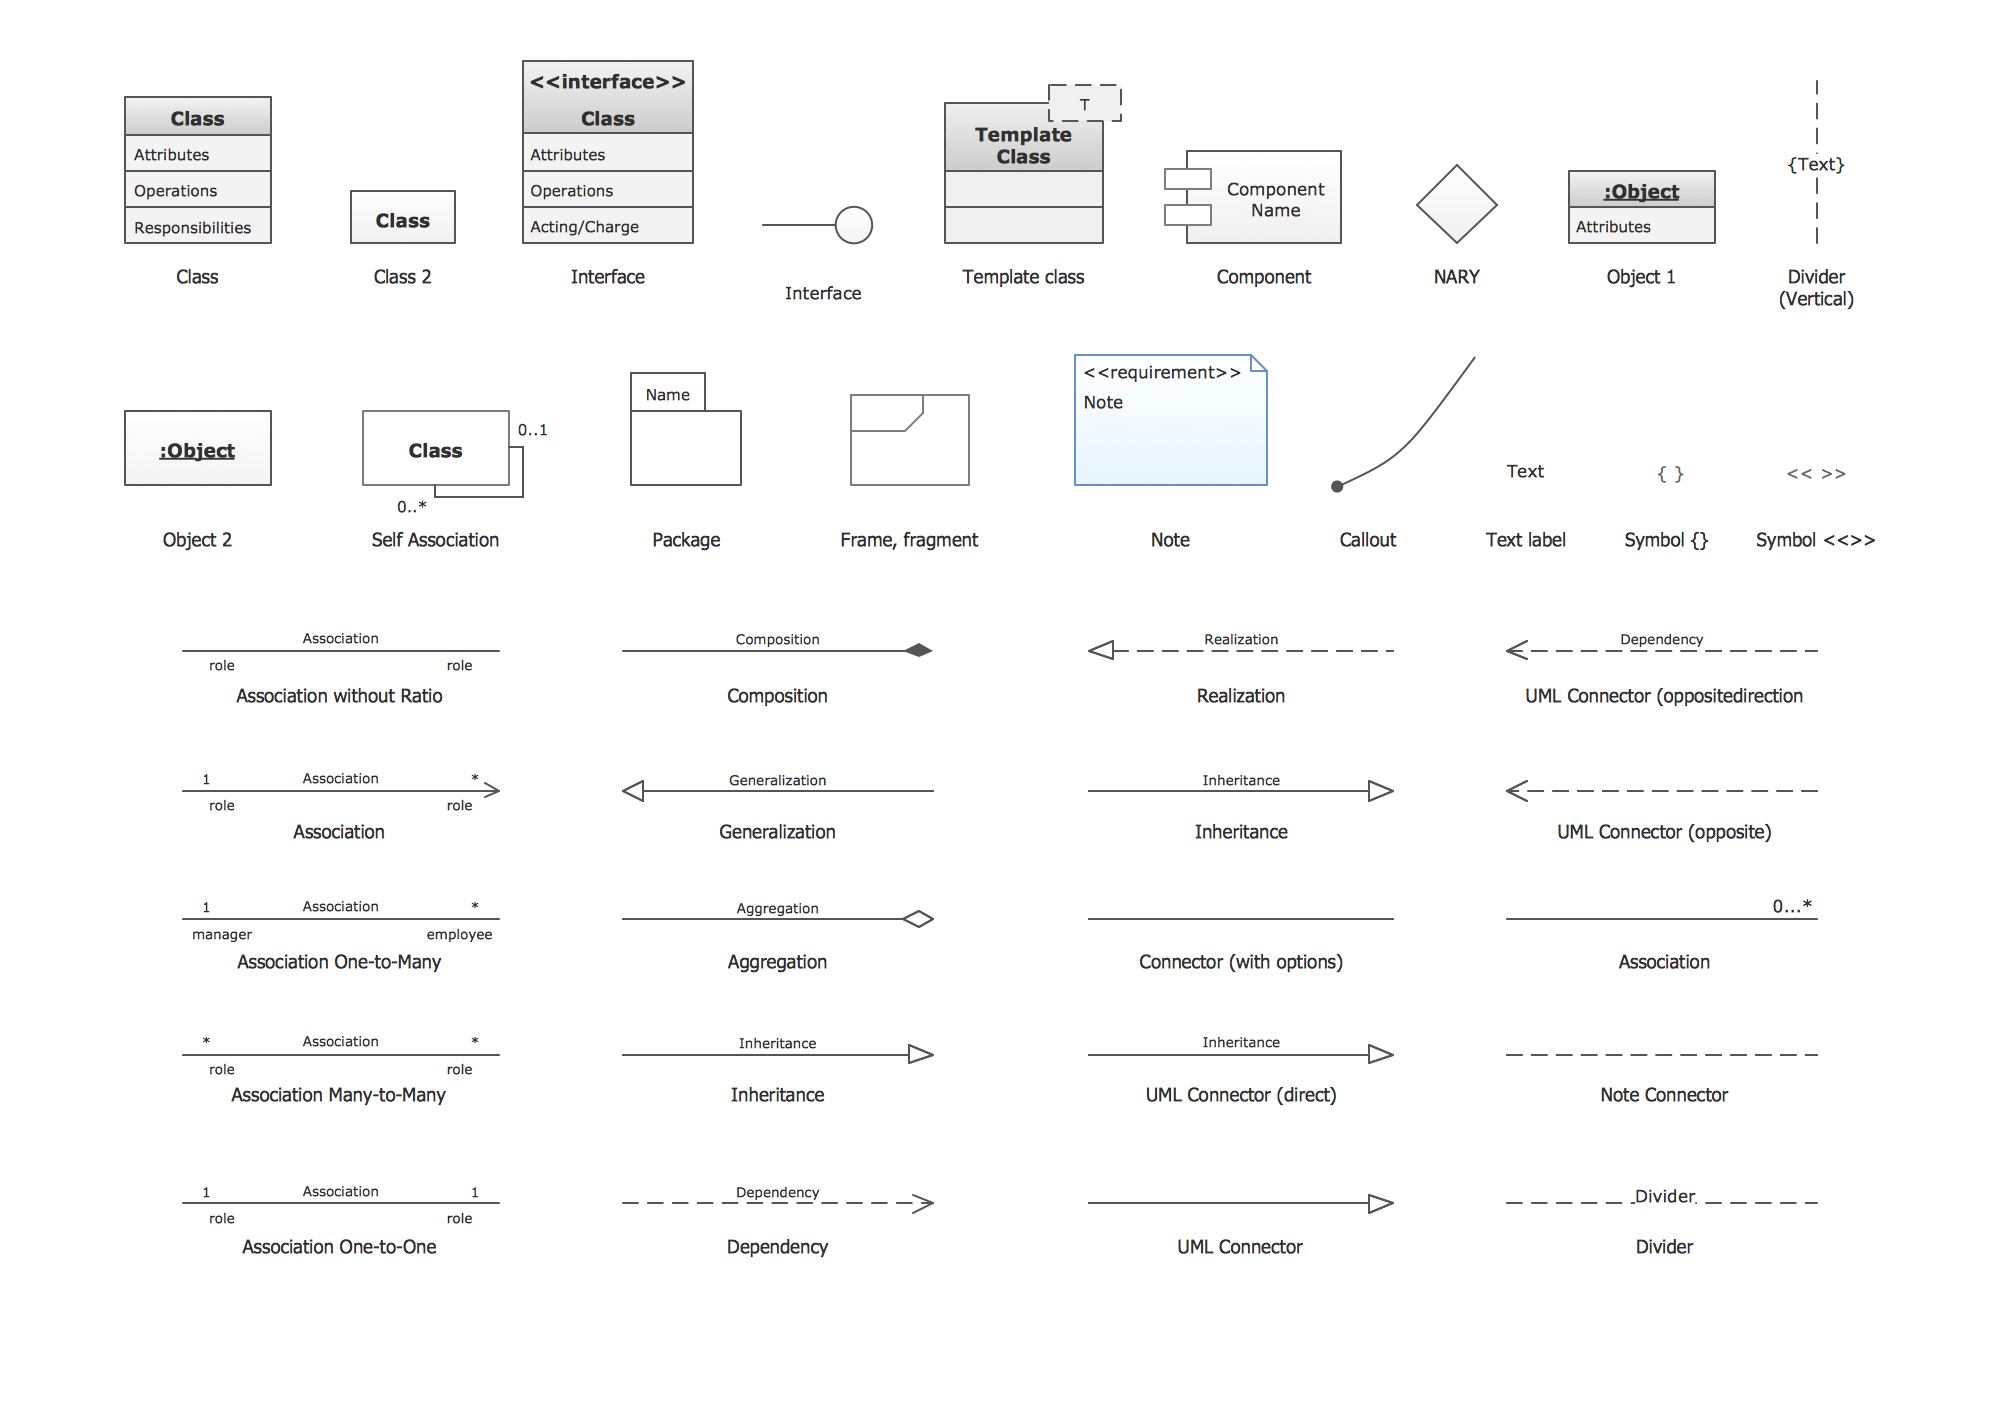
Picture: UML Class Diagram. Design Elements
Related Solution:
Flowcharts can be used in designing and documenting both simple and complex processes or programs and, similar to the other types of diagrams, they can help visualize what happens and so help understand some definite process, and, as a result, find flaws, bottlenecks and other features within it.
Picture: Flowchart Programming Project. Flowchart Examples
Related Solution:
ConceptDraw PROJECT’s powerful reporting engine lets you generate a set of tabular reports with just one click, or visualize your project as Radial Tasks Structures, Work Breakdown Structures and Resource Calendars. It also provides you with dynamic Project Dashboards.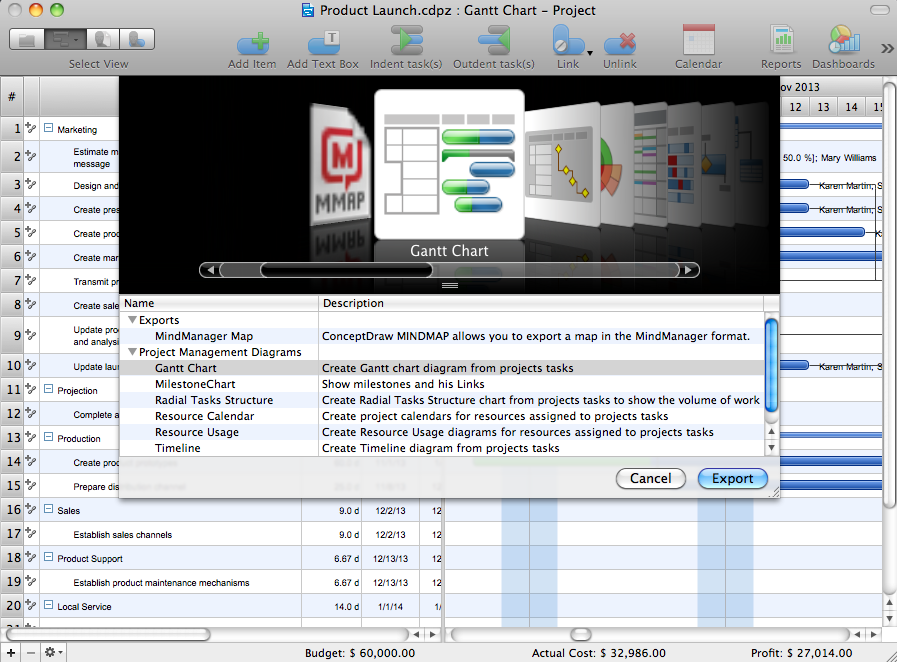
Picture: How to Report Task's Execution with Gantt Chart
Draw your own business process flowcharts using ConceptDraw DIAGRAM diagramming and business graphics software.
The Flowcharts Solution for ConceptDraw DIAGRAM is a comprehensive set of examples and samples in several different color themes for professionals that need to graphically represent a process.
Picture: Flow Chart Diagram Examples
Related Solution:


