Design Element: Crows Foot
for Entity Relationship Diagram - ERD
Entity-relationship Diagram (ERD) is a perfect tool which lets execute the detalization of data warehouse for designed system, as well as documenting the entities of the system and their interactions each other, including the identification of important domain objects (entities), the properties of these objects (attributes) and their relationships to other objects.
Creating an ERD requires choosing a specific set of notations that best serve the specific database being designed. Chen’s original notation had a linguistic approach, where boxes representing entities could be thought of as nouns, and the relationships between them were in verb form, shown on a diagram as a diamond.
Eventually Chen’s style was adapted into the Crow’s Foot notation, where relationships were shown as single labeled lines – this quickly became the popular standard, due to improved readability on diagrams, with a more efficient use of space on the page.
ConceptDraw DIAGRAM software extended with Entity-Relationship Diagram (ERD) solution from Software Development area of ConceptDraw Solution Park allows you to draw ER diagrams for depicting a database using the ERD diagram design element Crow's Foot - Crow′s Foot notation icons.

Example 1. Design Elements — Crow's Foot (Mac OS X, Windows) for Entity Relationship Diagrams
The Entity-Relationship Diagram (ERD) solution offers also a lot of samples of ER Diagrams of Crow's Foot and also Chen's notations, and two templates providing useful quick start. All they are professional looking, stylish and attractive and are proposed for using from ConceptDraw STORE.

Example 2. Entity Relationship Diagrams solution, examples and template
The samples you see on this page were created in ConceptDraw DIAGRAM software using the Entity-Relationship Diagram (ERD) solution and show the ER Diagrams created with Crow's Foot notation. An experienced user spent 10 minutes creating these samples.
Use the Entity-Relationship Diagram (ERD) Solution for ConceptDraw DIAGRAM to create quick and easy your own ERDs using the Crow's Foot and Chen's notations.
All source documents are vector graphic documents. They are available for reviewing, modifying, or converting to a variety of formats (PDF file, MS PowerPoint, MS Visio, and many other graphic formats) from the ConceptDraw STORE. The Entity-Relationship Diagram (ERD) Solution is available for all ConceptDraw DIAGRAM or later users.
TEN RELATED HOW TO's:
In software engineering, a UML Class Diagrams is a type of static structure diagram that is used both for general conceptual modeling of the systematics of the application, and for detailed modeling translating the models into programming code.
Use ConceptDraw DIAGRAM with UML class diagram templates, samples and stencil library from Rapid UML solution to show the classes of system, their attributes, operations or methods, and the relationships among the classes.
Picture: UML Class Diagrams. ConceptDraw DIAGRAM - Diagramming Software for Design UML Diagrams
Related Solution:
Website wireframe is a detailed view of design or its skeleton. It shows all the important elements of the final website, the main groups of contents, information structure, describes the user's interaction with interface and its estimated visualisation.
ConceptDraw DIAGRAM extended with Website Wireframe solution from the Software Development area is the best wireframing software. Using the wireframe tools, libraries of vector objects, template and examples which offers a Website Wireframe solution, you will easily design the websites wireframes of any complexity.
Picture: Wireframing
Related Solution:
ConceptDraw DIAGRAM charting and vector drawing software offers the Circle Spoke Diagram Template included to the Business Diagrams Solution from the Management Area. The use of ready template is the easiest way of drawing professional-looking Circle-Spoke Diagrams.
Picture: Circle Spoke Diagram Template
Related Solution:
Diagramming is an astonishing way to visualize business processes. The list of the most common business process flowchart symbols is quite long starting from basic flowcharts, continuing with SIPOC diagrams. Business process modeling was never easier than now, with special ConceptDraw Business Process Mapping solution.
To carry out all professional standard requirements for business processes mapping, it is necessarily to follow the special graphical notations. ConceptDraw Business Process Mapping solution offers an exhaustive suite of tools to aid business process mapping. There are three vector libraries SIPOC Diagrams, Business Process Flowcharts, and Swim Lanes that contains totally more than 50 symbols of standard BPM notations. This is all that professionals need to effectively evaluate and manage quality in business processes.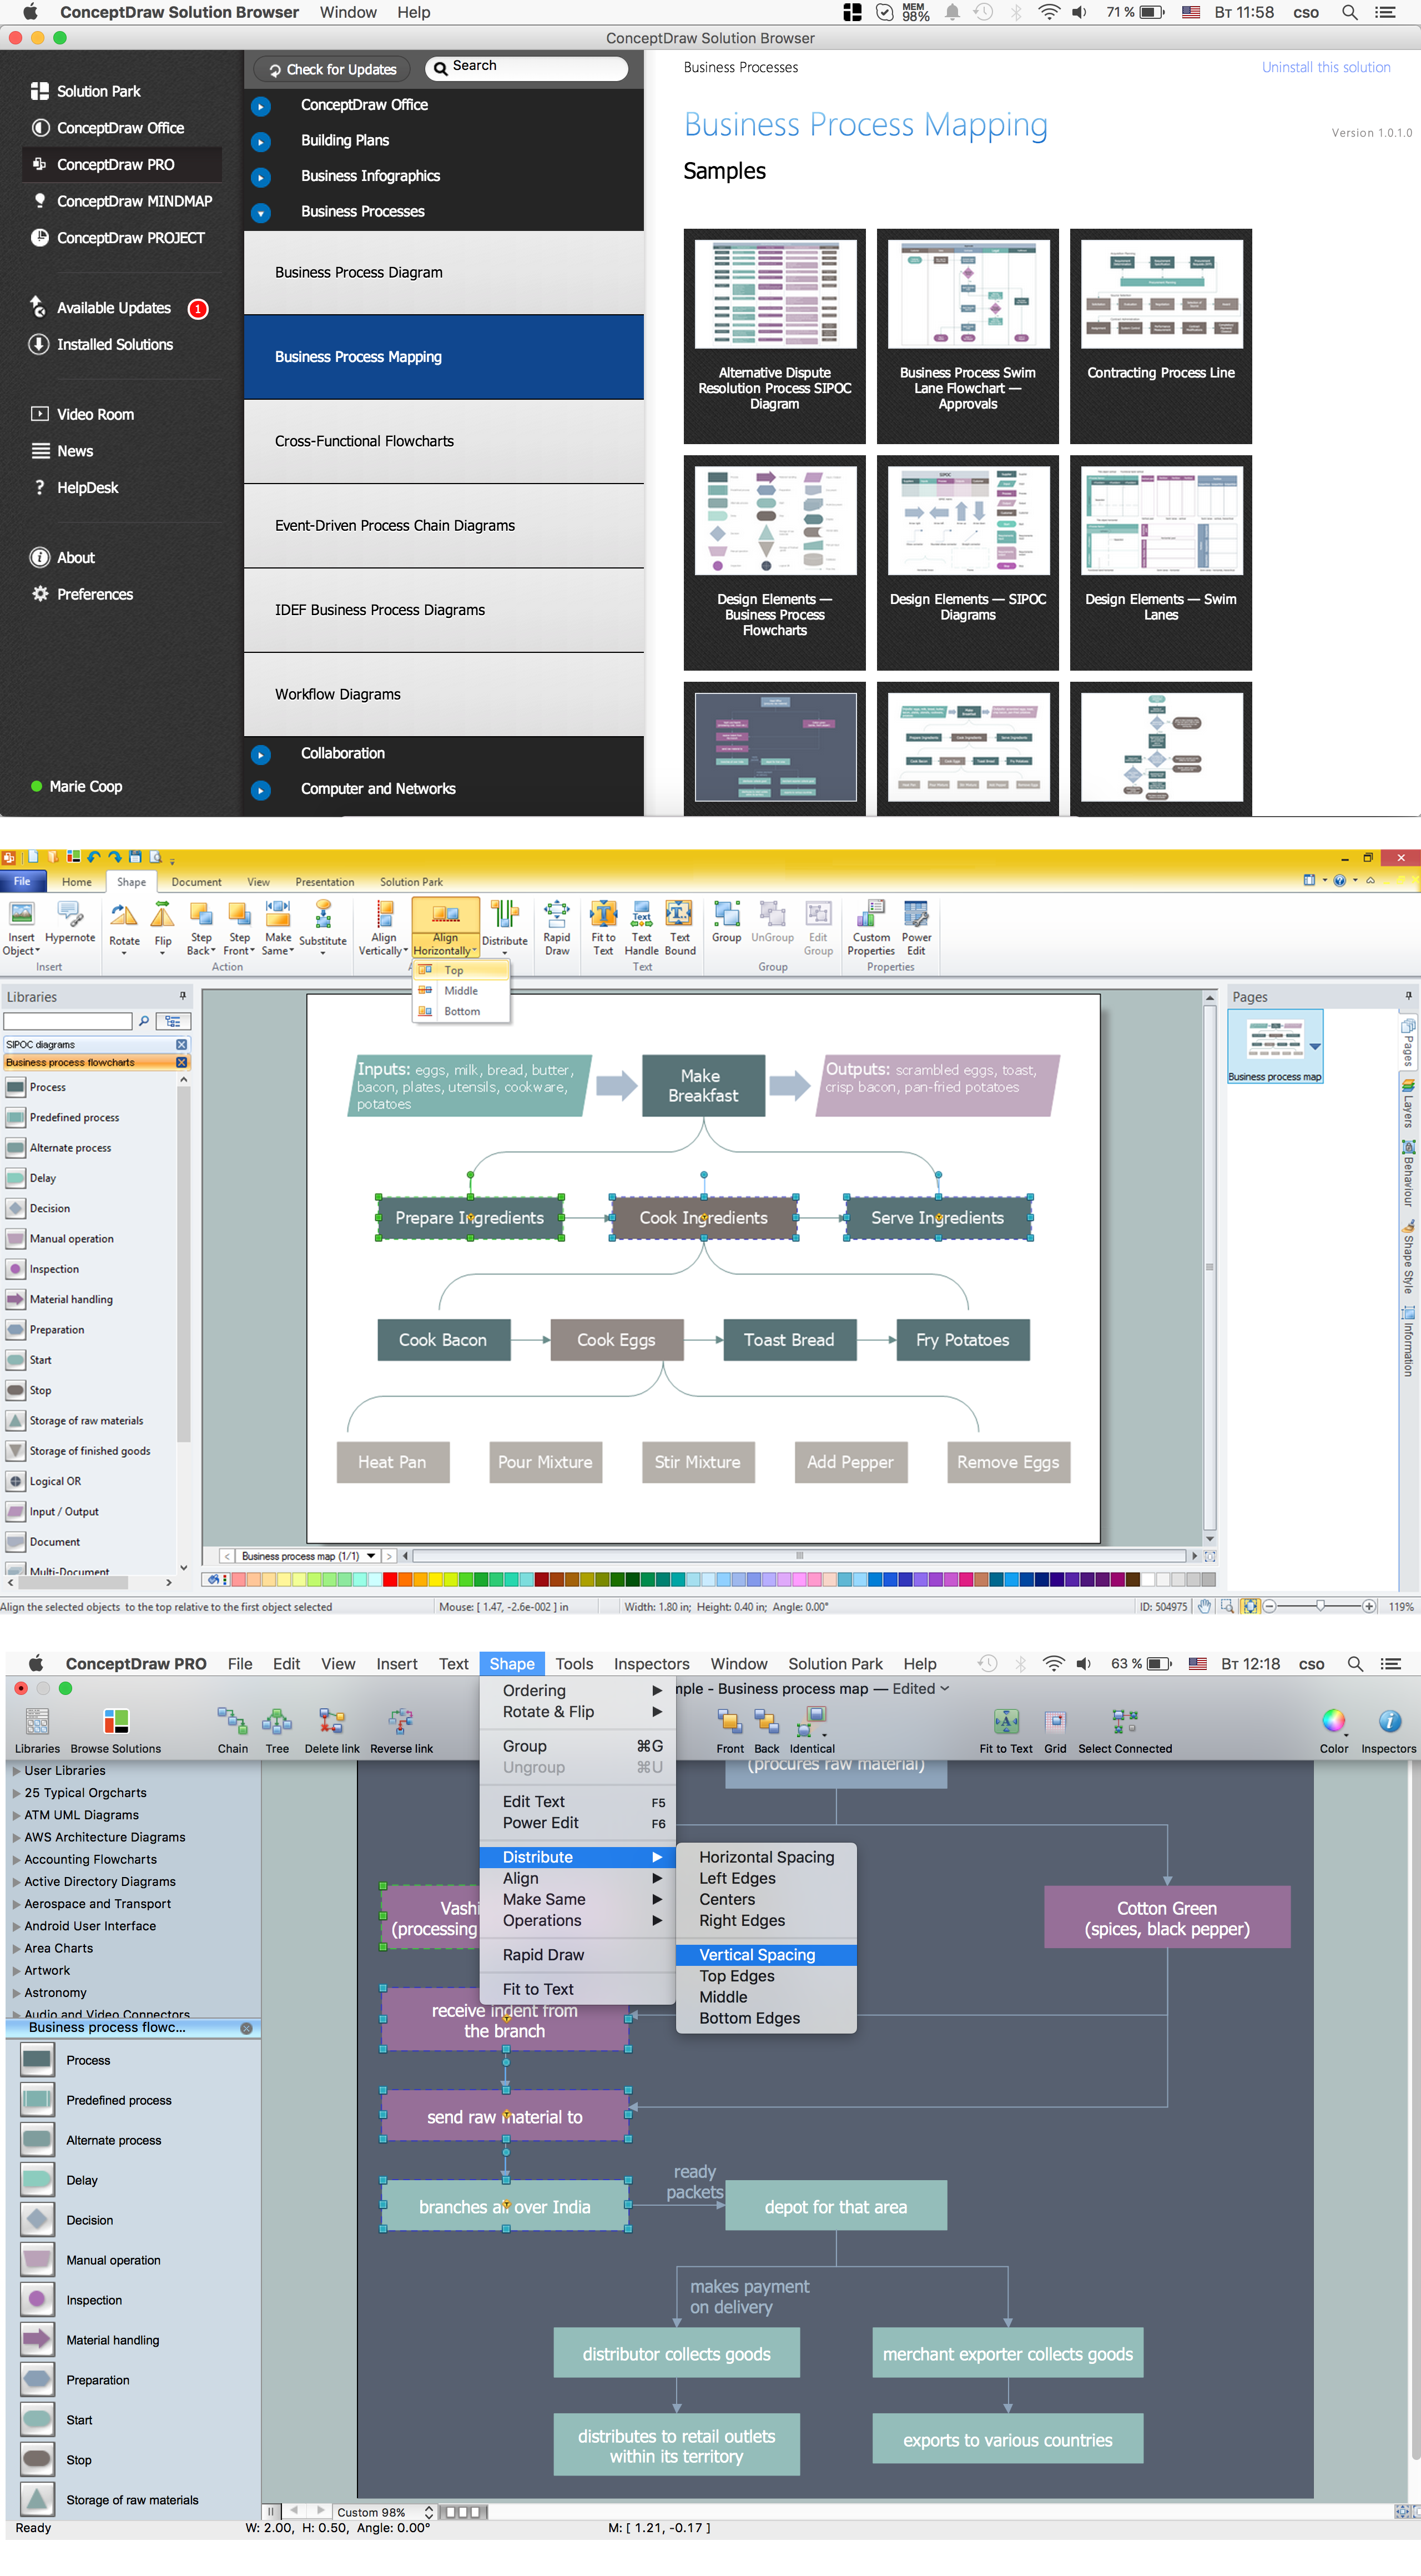
Picture: Business Process Flowchart Symbols
Related Solution:
Mechanical design is a labour-intensive process. To facilitate the task of Mechanical Engineering Diagrams creating, ConceptDraw DIAGRAM diagramming and vector drawing software was extended with Mechanical Engineering solution from the Engineering area. Now, ConceptDraw DIAGRAM is a powerful Mechanical Design Software.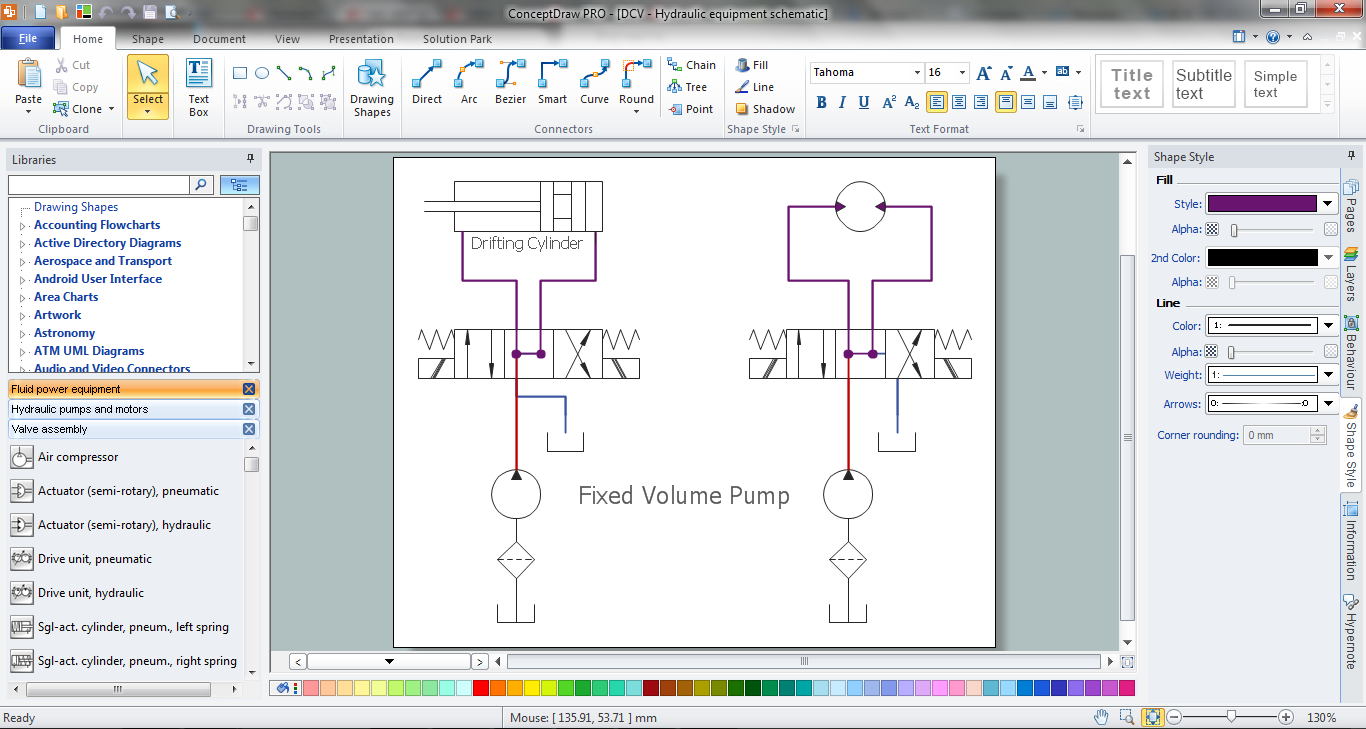
Picture: Mechanical Design Software
Related Solution:
The Architecture Diagrams are the type of diagrams which help to system designers, system developers, and application developers to visualize the overall high-level structure of the system or application and depict the interactions between software systems, users, external systems, data sources, and services. The ConceptDraw DIAGRAM Architecture Diagrams Software provides the unique Cloud Computing Diagrams solution from the Computers and Network area of ConceptDraw Solution Park with wide set of powerful tools for fast and easy creating various types of Architecture diagrams.
Picture: Architecture Diagrams
Related Solution:
You need design the Functional Block Diagram and dream to find the useful tools to draw it easier, quickly and effectively? ConceptDraw DIAGRAM offers the Block Diagrams Solution from the Diagrams Area which will help you!
Picture: Functional Block Diagram
Related Solution:
Customer relationship management is an important component of sales success. Visualizing sales data you may put some KPI related to customers relationship management to your Sales dashboard and track this important aspect in real time.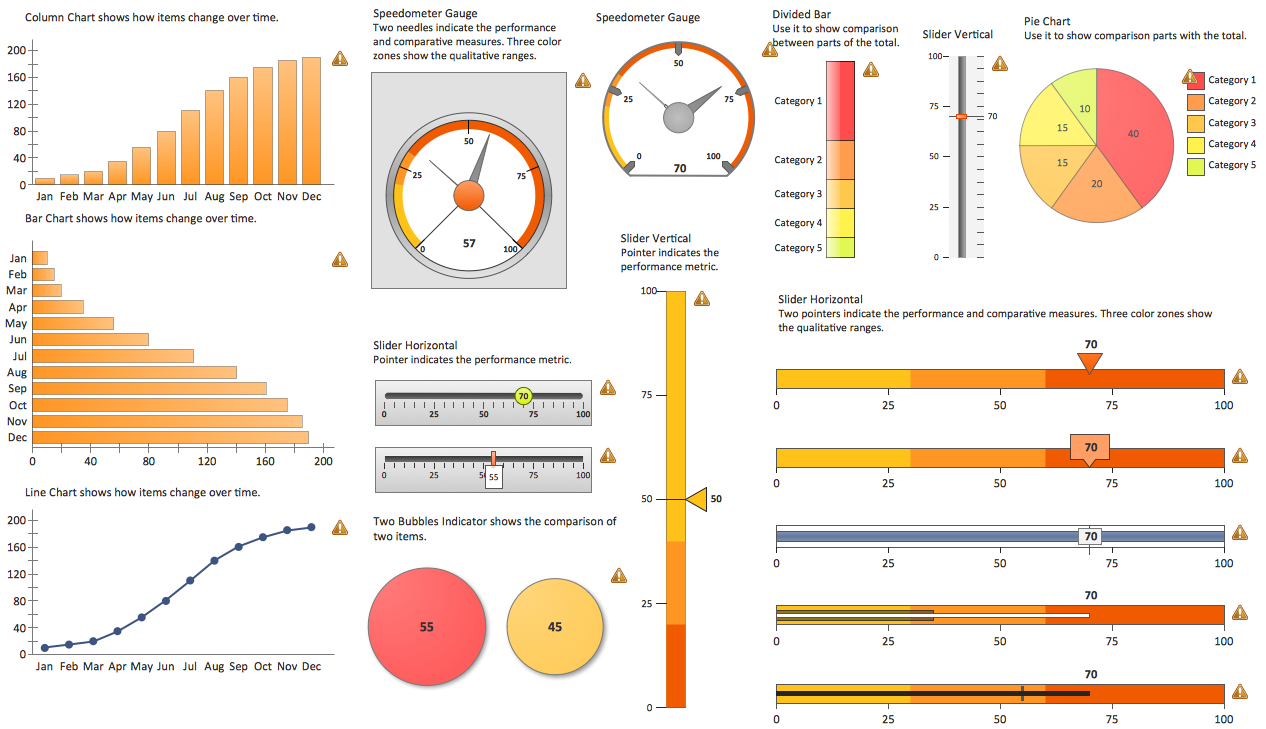
Picture: Customer Relationship Management
The ConceptDraw DIAGRAM Planogram Software and Retail Plan Software offers powerful tools of Enterprise Architecture Diagrams Solution for visualization the market analysis and easy making successful Retail Plans and Planograms with useful detailed recommendations about placing products and optimization the shelf space.
Picture: Planogram Software and Retail Plan Software
Related Solution:
A database is a data collection, structured into some conceptual model. Two most common approaches of developing data models are UML diagrams and ER-model diagrams. There are several notations of entity-relationship diagram symbols and their meaning is slightly different. Crow’s Foot notation is quite descriptive and easy to understand, meanwhile, the Chen notation is great for conceptual modeling.
An entity relationship diagrams look very simple to a flowcharts. The main difference is the symbols provided by specific ERD notations. There are several models applied in entity-relationship diagrams: conceptual, logical and physical. Creating an entity relationship diagram requires using a specific notation. There are five main components of common ERD notations: Entities, Actions, Attributes, Cardinality and Connections. The two of notations most widely used for creating ERD are Chen notation and Crow foot notation. By the way, the Crow foot notation originates from the Chen notation - it is an adapted version of the Chen notation.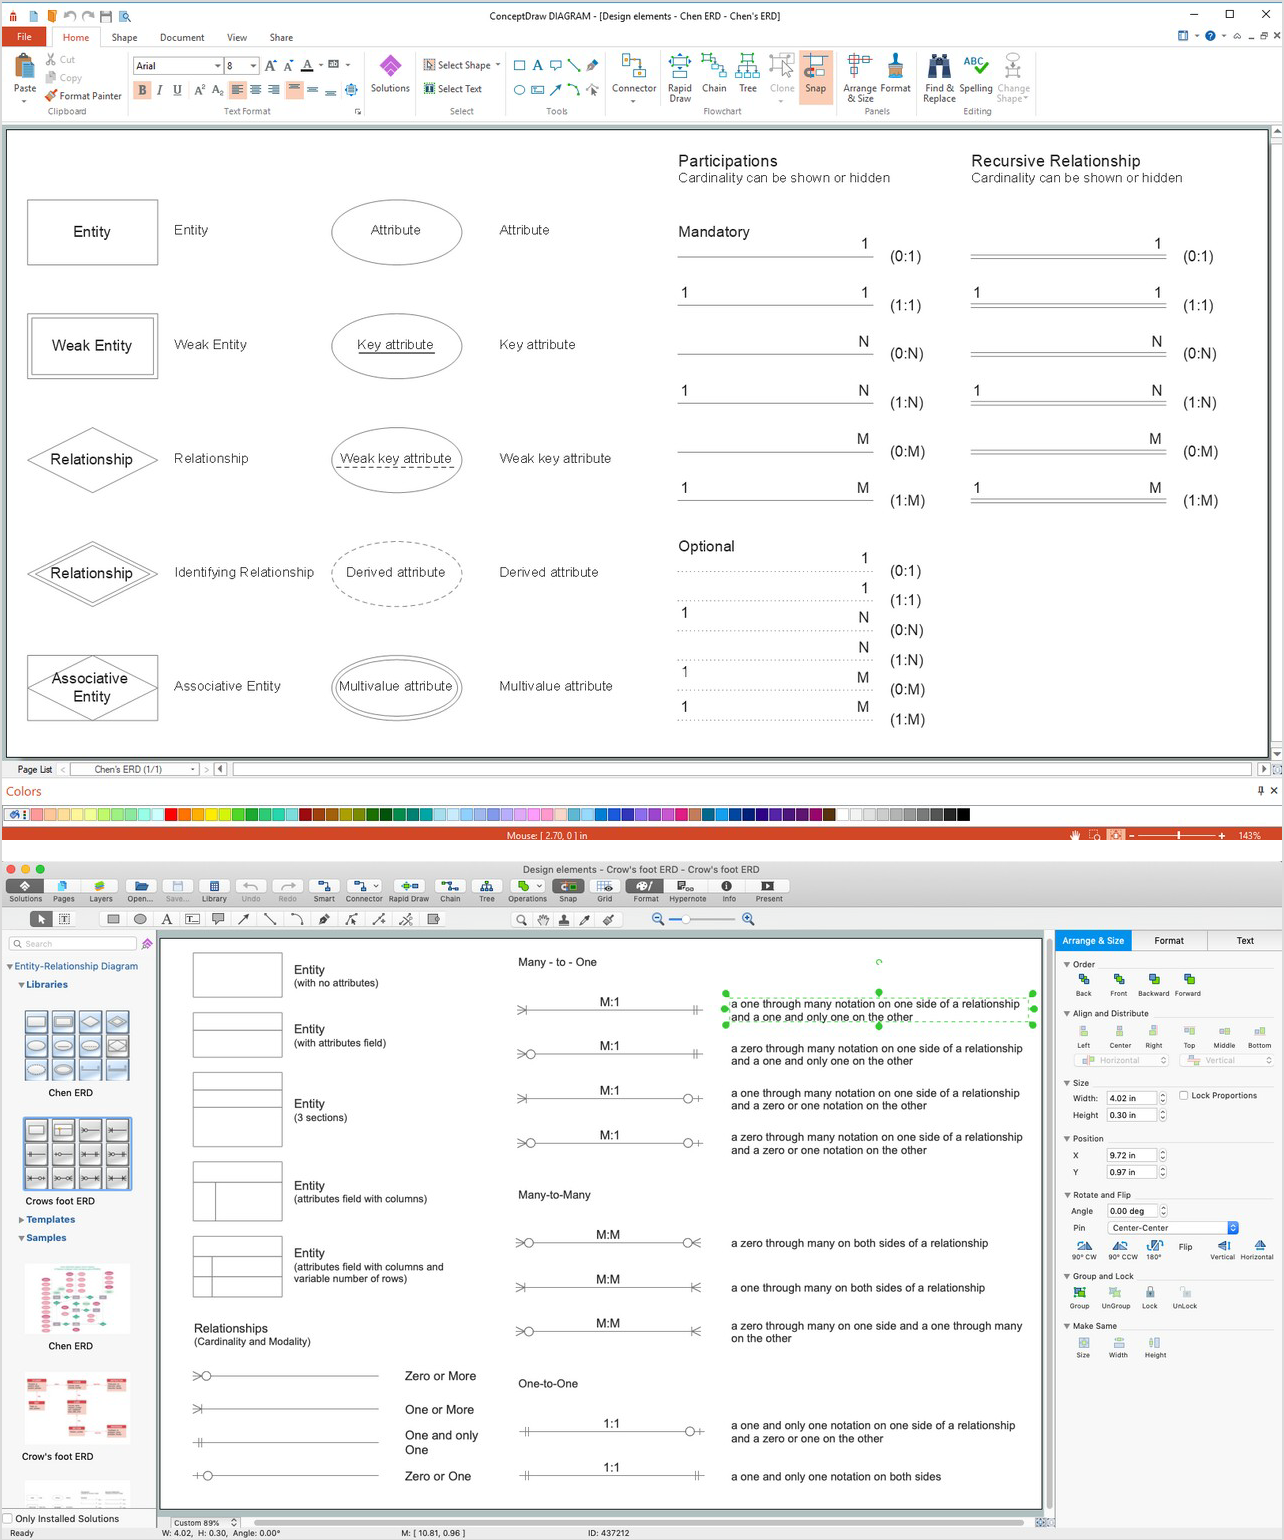
Picture: ERD Symbols and Meanings
Related Solution:
