Entity Relationship Diagram - ERD - Software for Design
Crows Foot ER Diagrams
ER-model is used in a high-level (conceptual) design databases. You can use it to identify key entities and designate connections that can be established between these entities. During database design the ER model is converted into specific database scheme based on the selected data model (relational, objective, networking, or any other).
Crow's Foot notation was proposed by Gordon Everest, originally called Inverted Arrow. According to this notation, the entity is represented by rectangle containing its name. Name of the entity must be unique within this model. In this case, the name of the entity is a name of type, rather than a specific instance of this type. A concrete representative of the entity is called by the entity instance.
The entity attributes are written inside the rectangle depicting entity. Among the attributes is also highlighted the entity key - the set of attributes the values of which in aggregate are unique for each instance of the entity.
Relation is depicted by line which ties two entities involved in a relationship. The plurality of the relationship is indicated graphically by a "plug" on the end of the link. Optionality of a link is marked by a circle at the end of the link.
Entity-relationship diagrams based on both Chen's and Crow's Foot notations, can be easily drawn using the ConceptDraw DIAGRAM ERD diagrams software tools for design element Crow's Foot and Chen from Entity-Relationship Diagram (ERD) solution.
ERD Crow's Foot library from Entity-Relationship Diagram (ERD) solution contains 17 Crow's Foot notation symbols.

Example 1. Crow's Foot notation symbols
The shapes which include circles, bars, and symbols, indicate various possibilities. A single bar at Crows foot notation indicates one, a double bar indicates one and only one, a circle indicates zero, and a crow's foot indicates many.
Entity Relationship Diagrams (ERD) illustrates the logical structure of databases. The vector graphic diagrams produced when using the ConceptDraw ERD solution can be successfully used in whitepapers, presentations, datasheets, posters, or any technical materials.
_Win_Mac.png)
Example 2. Entity Relationship Diagram Software
Design Elements — Crow's Foot (Windows, Macintosh).
The samples you see on this page were created in ConceptDraw DIAGRAM software in macOS and Windows using the Entity-Relationship Diagram (ERD) solution and show the ER Diagrams created with Crow's Foot notation. An experienced user spent 10 minutes creating each of these samples.
Use the Entity-Relationship Diagram (ERD) Solution for ConceptDraw DIAGRAM to create quick and easy your own Entity-Relationship Diagrams using the Crow's Foot and Chen's notations.
 solution")
Example 3. Entity-Relationship (ERD) Diagram Solution
All source documents are vector graphic documents. They are available for reviewing, modifying, or converting to a variety of formats (PDF file, MS PowerPoint, MS Visio, and many other graphic formats) from the ConceptDraw STORE. The Entity-Relationship Diagram (ERD) Solution is available for all ConceptDraw DIAGRAM users.
TEN RELATED HOW TO's:
ERD drawing becomes easier with predesigned entity relationship symbols, work flow shapes, entity relationship stencils. All variety of ERD symbols you may need for ERDs design is packed into libraries and templates from Entity-Relationship Diagram (ERD) Solution for ConceptDraw DIAGRAM diagramming and vector drawing software.
But anyone have an ERD symbols quick reference? Detailed reference information for them is represented at the tables.
Picture: Anyone Have an ERD Symbols Quick Reference?
Related Solution:
ConceptDraw Note Exchange Solution permits users to develop and organize notes and tasks in ConceptDraw MINDMAP. Your work can be accessed later, just with one click, regardless of preferred platform.
Picture: Detail Specifications Exchanging Mind Maps with Evernote
Related Solution:
Use ConceptDraw DIAGRAM diagramming and business graphics software for drawing your own PM life cycle flow charts.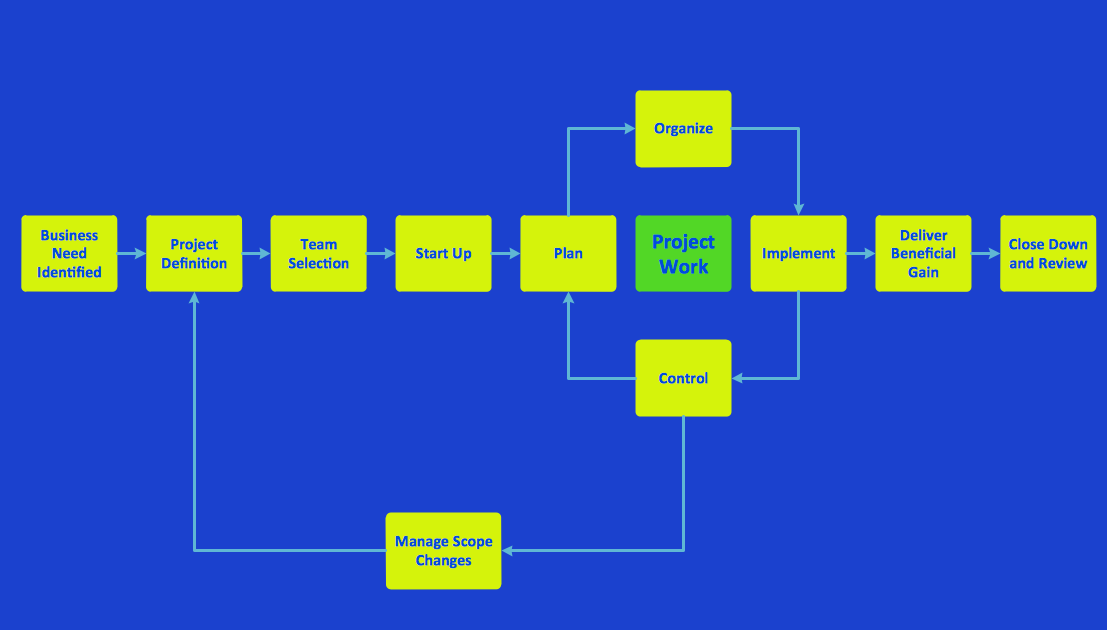
Picture: Program to Make Flow Chart
Related Solution:
In general, you can use any icons to represent network equipment on a diagram. However, there are some icons, for instance, Cisco icons, shapes, stencils and symbols, that are recognizable worldwide. Using those icons you can create Cisco network topology diagrams in minutes and share them anywhere.
The icons depicting Cisco network equipment are recognized and generally applied as standard images for designing network diagrams. They are free to used , but can not be reworked. Cisco network diagrams are created to depict how signals processed on the network equipment and end-user computers and how data transfer through LAN or WLAN between nodes. The vector graphic library of ConceptDraw CISCO Network Diagrams solution includes about 90 icons of Cisco network equipment for designing computer network diagrams with ConceptDraw DIAGRAM.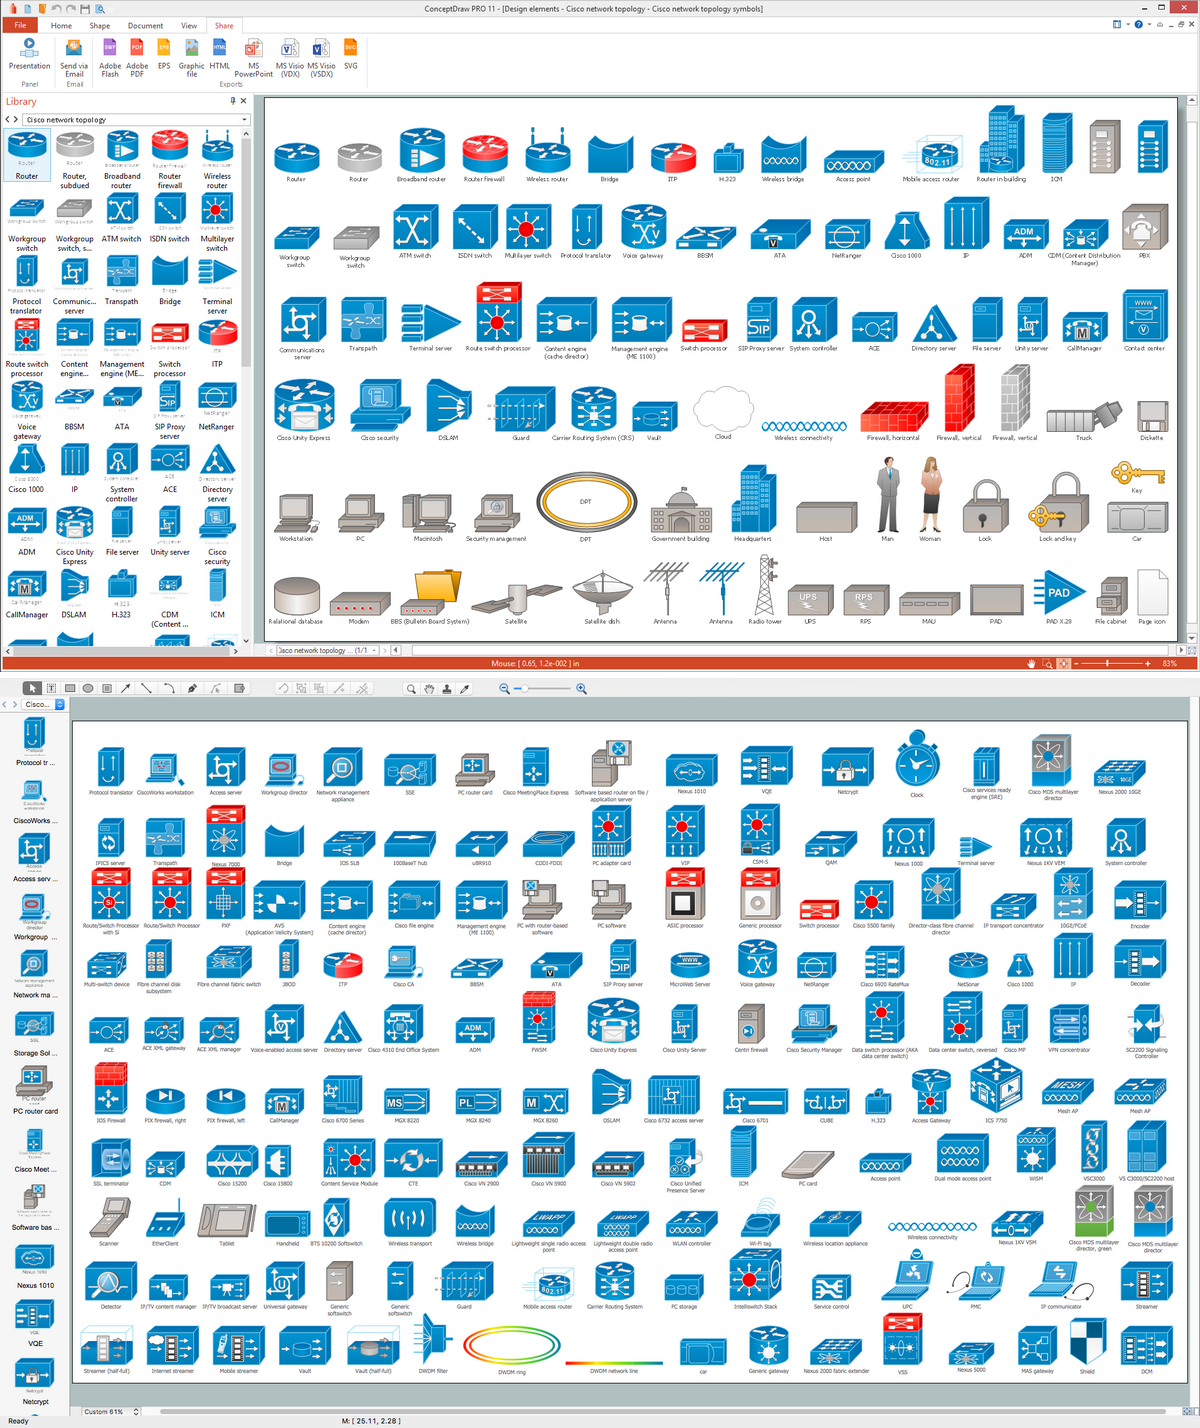
Picture: Cisco Network Topology. Cisco icons, shapes, stencils and symbols
Related Solution:
Every corporate network is unique, though there are guidelines and best practices in developing networks. As it is quite difficult to implement a pure topology within a company, using a hybrid network topology is considered a better solution. As a rule, such network assembles advantages and features of source topologies.
This diagram is an example of the Hybrid network. This type of network topology means a conjunction of other network topologies. Such as star-bus, ring-mesh topologies, etc. It should be obviously diverse networks. The final computer network inherits both advantages and disadvantages of its ingredients. Using the ConceptDraw Computer and Networks solution including vector graphic libraries and templates one can develop professional custom network diagrams of any topology and complexity.
Picture: Hybrid Network Topology
Related Solution:
Any hierarchical structure of any company can be represented as a triangle or a pyramid. You can create a pyramid diagram and pyramid chart of any complexity using special libraries included in ConceptDraw DIAGRAM. Actually, any knowledge or chain of facts can also be depicted as a pyramid.
A wide range of graph and chart are utilized in marketing to maintain documentation and various visual issues, that deal with marketing information and data. The marketing value pyramid can be created to illustrate how the value of company, or product is based on its competitiveness. To design this diagram we used ConceptDraw DIAGRAM drawing tools in conjunction with Pyramid solution for Solution Park.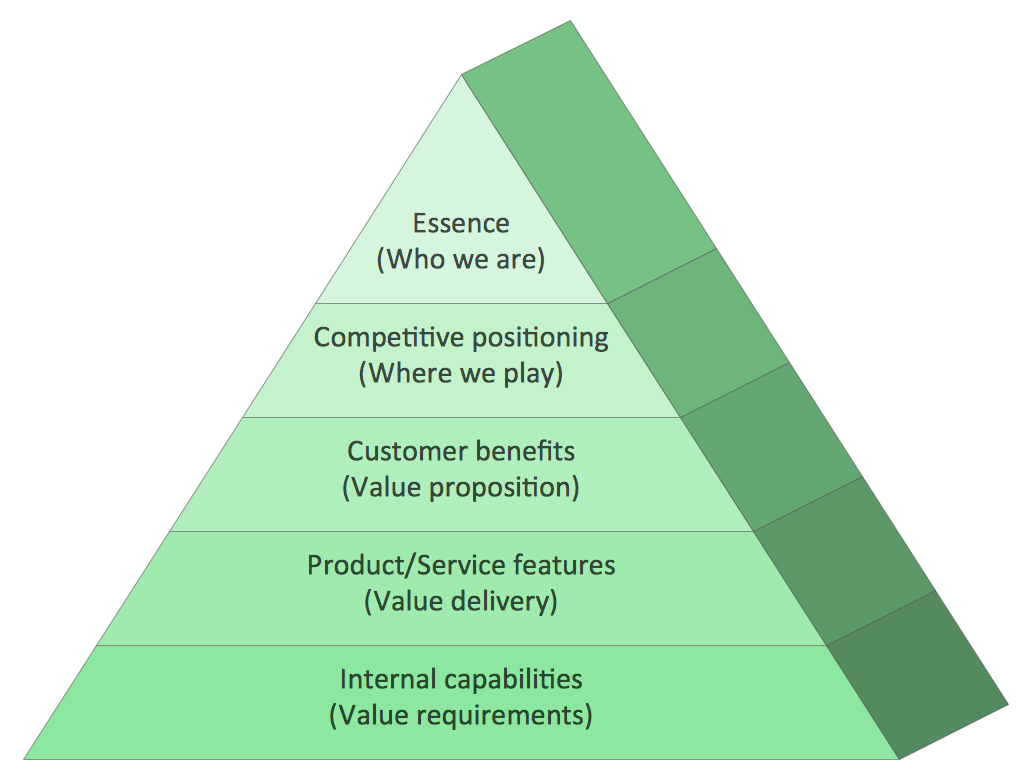
Picture: Pyramid Diagram and Pyramid Chart
Related Solutions:
ConceptDraw DIAGRAM extended with Windows 8 User Interface solution from the Software Development area is the best gui software. Using the drawing tools, libraries of vector objects, graphical user interface examples that offers Windows 8 User Interface solution, you will easily design the Windows 8 user interfaces and Windows 8 UI design patterns of any complexity.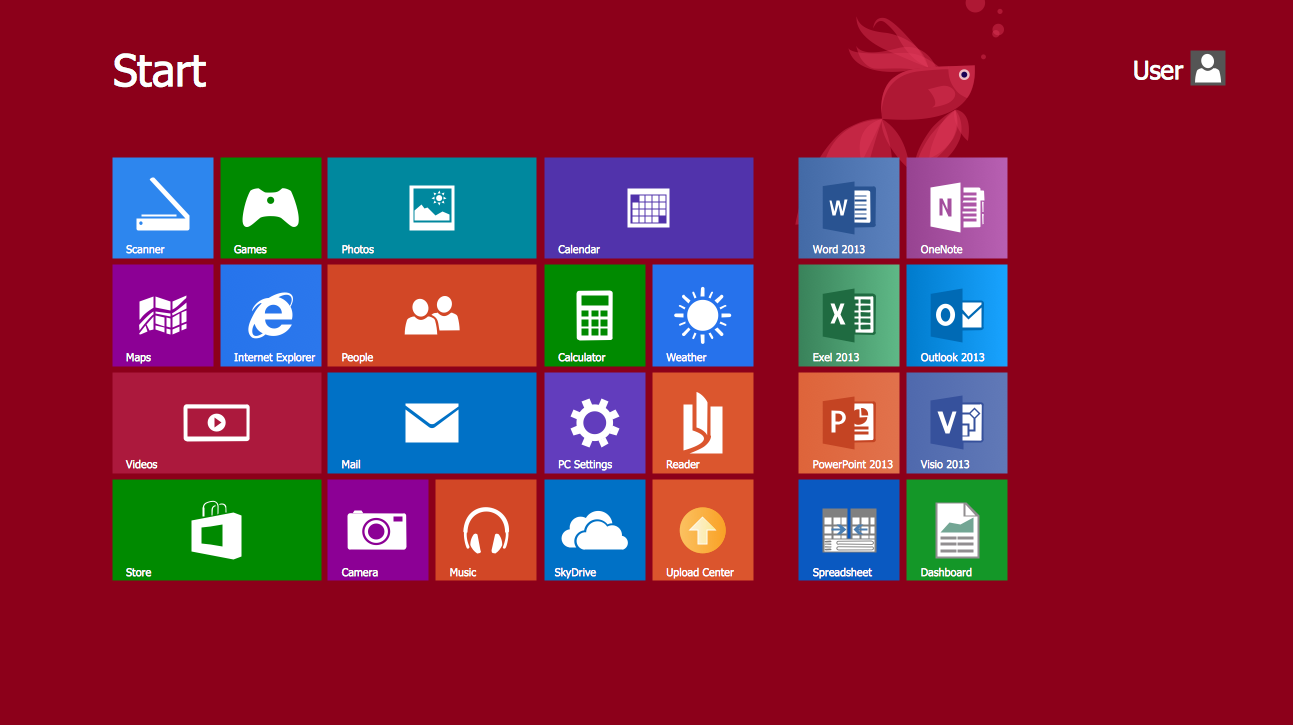
Picture: Graphical User Interface Examples
Related Solution:
A Venn diagram, sometimes referred to as a set diagram, is a diagramming style used to show all the possible logical relations between a finite amount of sets. Having ConceptDraw DIAGRAM software one allows anyone who cares for their drawings to look not only nice but also smart and professional.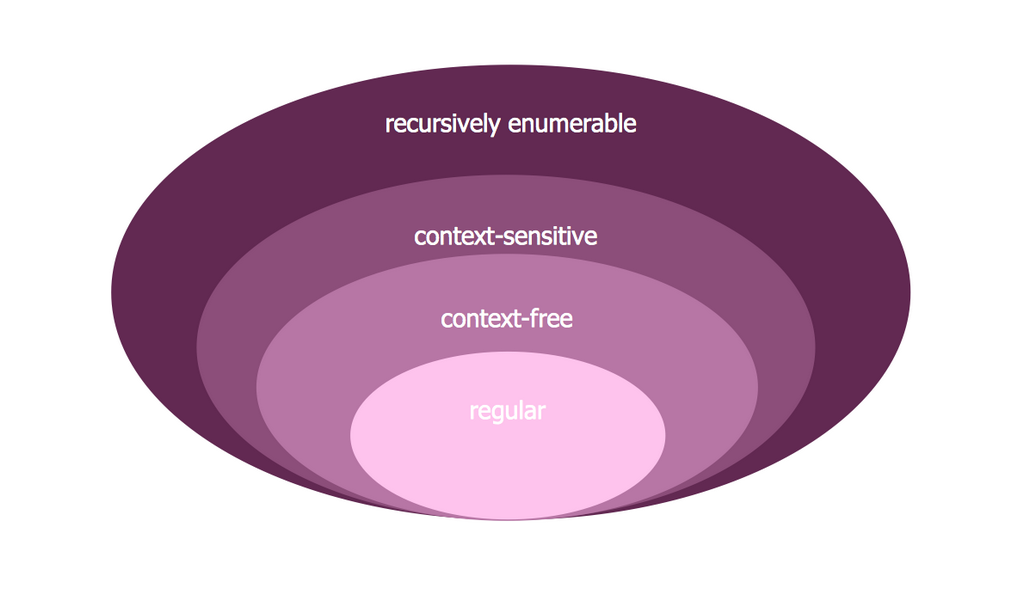
Picture:
Venn Diagram Examples for Problem Solving
Computer Science. Chomsky Hierarchy
Related Solution:

 solution")