Entity Relationship Diagram Examples
Crow’s Foot and Chen's notation examples
Creating the entity-relationship (ER) model by visually representing the structure of some database, mainly the business one, which data equates to its entities (or objects) that are connected by relationships showing requirements and dependencies, you need proper software to provide you with the symbols necessary in this case.
ConceptDraw DIAGRAM мector drawing and diagramming software allows you to make any of needed models, plans, charts, diagrams with help of our application STORE where lots of layouts can be found as well as samples and templates of the flowcharts depending on the business sphere you work in and requirements you have. You can also find examples of ERD in Solutions here on this site in order to make it look really smart. Making entity-relationship diagram based on the Chen ERD notation is simple now having ConceptDraw DIAGRAM and you can check it yourself once you download and use it. Advice your colleagues and your friends, business partners, in order to simplify their lives as well as yours making the charts looking professional and simply sophisticated. Because we guarantee the quality of our great software developed to please everyone who needs this product in their work.

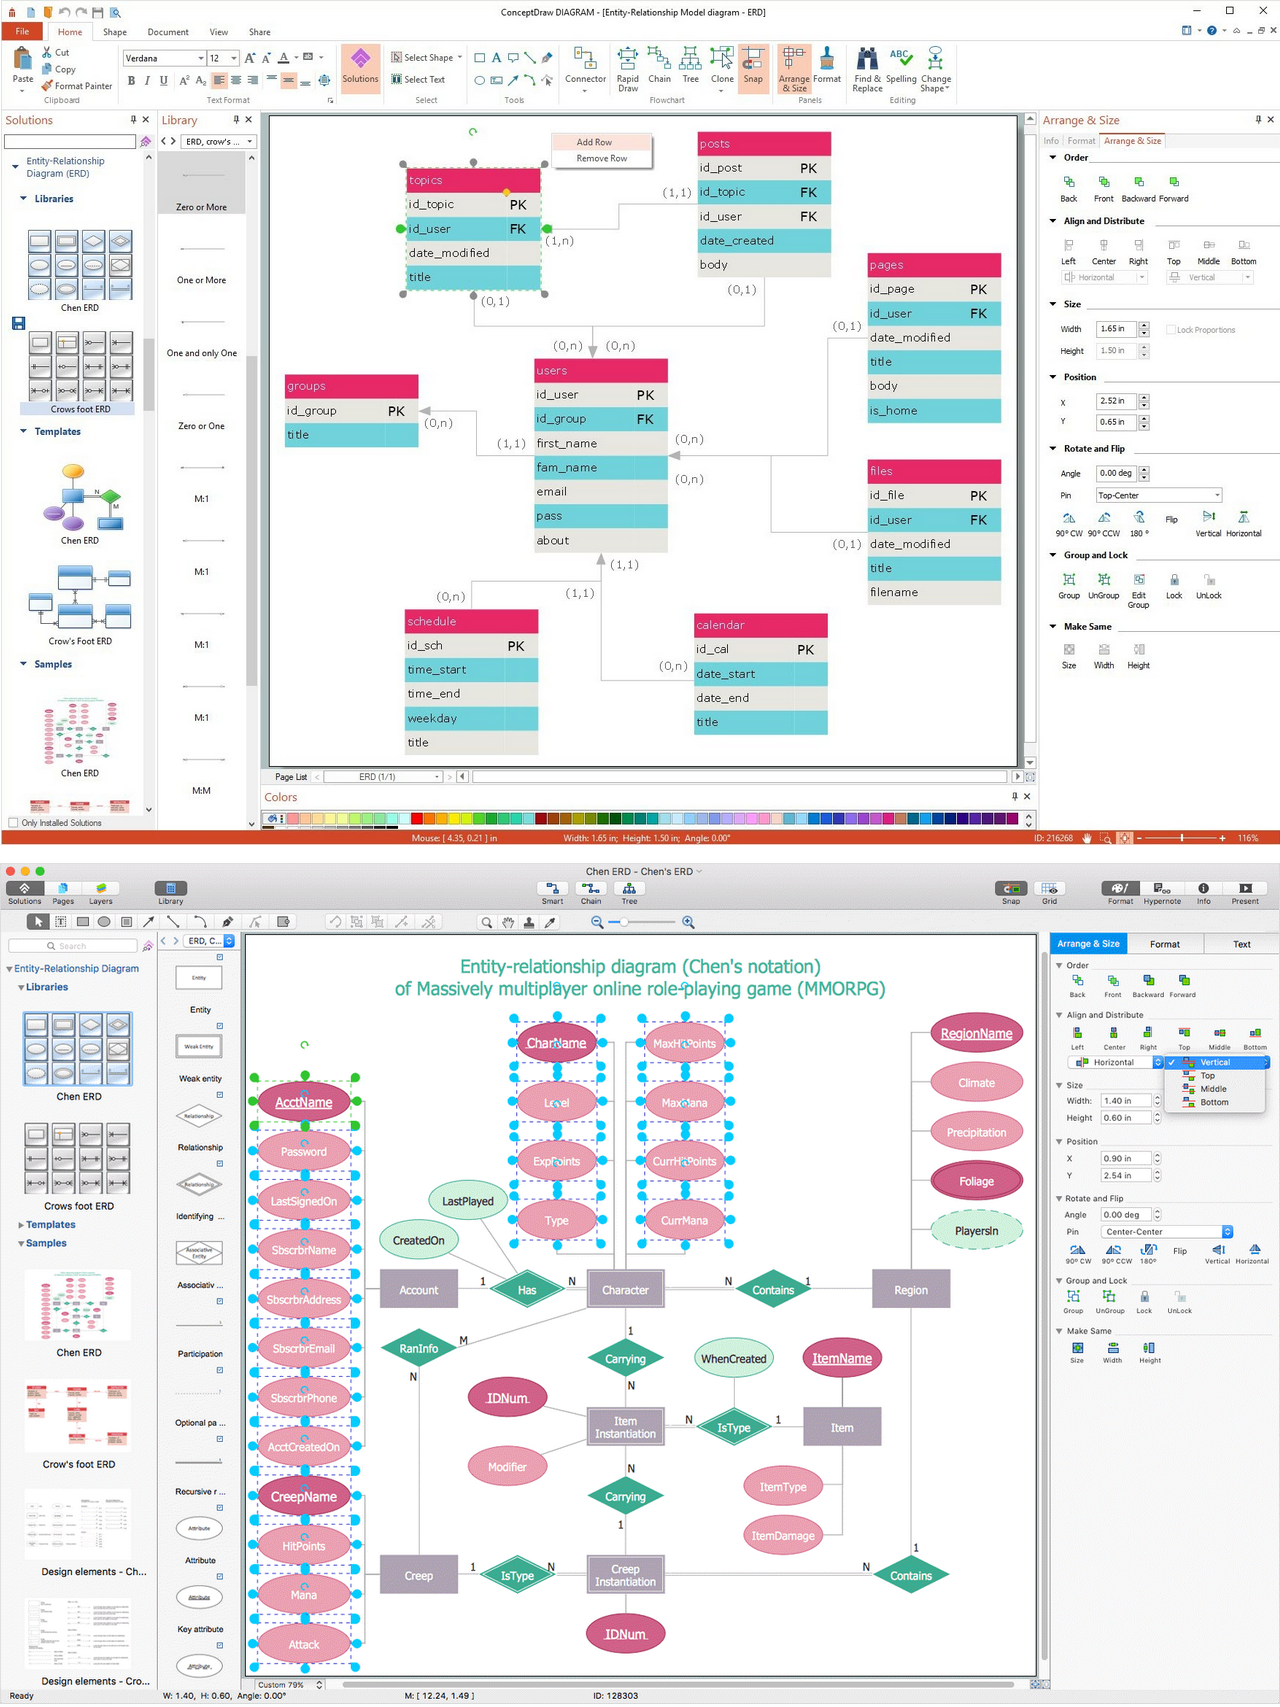
Example 1. ERD Example — Chen Diagram
This sample diagram is one of ER Diagram examples included to Entity-Relationship Diagram (ERD) solution. It shows the type of icons and graphics you can use to develop a model of a database of arbitrary complexity according to Chen's notation.

Example 2. ERD Example — Crows's Foot diagram
This sample diagram was created using the drawing tools of Entity-Relationship Diagram (ERD) solution and shows the type of icons and graphics you can use to develop a model of a database of arbitrary complexity using Crow's Foot notation.

Example 3. Entity Relationship Model Diagram — Crows's Foot notation
This sample demonstrates an Entity-relationship model diagram. Highlight the boxes in the ERD diagram with bright colors to make it attractive and easy to remember.

Example 4. Crows's Foot ERD notation — Students and Teachers
This Entity-Relationship Diagram shows the relationships between the Students and Teachers entities. Drawing all entities of ER-diagram in one color spectrum, highlighting the headers, you will make your diagram look stylish and then successfully use it in different conferences, discussions, publications.

Example 5. Chen ERD notation — WordPress File reference
This ERD example shows an Entity-Relationship Diagram of a WordPress file reference using Chen’s Notation, which represents the entities as rectangles and attributes as ovals. Creating similar Entity Relationship Diagram examples and diagrams in ConceptDraw DIAGRAM will take just minutes.

Example 6. Chen ERD Template
This template from Entity Relationship Diagram (ERD) solution contains special objects and settings for creating entity relationship diagrams based on the Chen ERD notation.
How to Create an ERD Diagram
The ability to describe a database using the Entity-Relationship model is delivered by the Entity-Relationship Diagram (ERD) solution.
Open ConceptDraw STORE, check the ERD solution and click “Install”.
This solution extends ConceptDraw DIAGRAM with 2 libraries that contains 45 objects advocated by Chen's and Crow’s Foot notations that can be used when describing a database.

Pic. 1. ERD symbols - Chen's notation

Pic. 2. ERD symbols - Crow's Foot notation
- From the ConceptDraw STORE open the Chen's ERD, or the Crow's Foot ERD template from the ERD section.
- Add objects to the diagram by dragging them from the Chen's ERD, or the Crow's Fot ERD library to the document page.
- Use Clone tool
 (Mac),
 (Win) to quickly add copies of the selected object.
- Select the Smart Connector tool
 . To connect elements using this tool, drag the connector from one connect dot to another.
- Use Line, Fill, Shadow and Text tools to format diagram objects.
Example 6. Entity Relationship Diagram Examples
The ERD solution from ConceptDraw Solution Park extends ConceptDraw DIAGRAM ector graphics and diagramming software with the ability to describe a database using the Entity-Relationship model.
The ERD solution provides entity relationship diagram examples, templates and library of vector stencils.

Example 7. Entity Relationship Diagram solution
Entity Relationship Diagram examples from ERD solution for ConceptDraw DIAGRAM can be used as a start point for professional ERD drawing. Entity Relationship Diagram examples can be simply modified to illustrate the logical structure of exact database.
TEN RELATED HOW TO's:
ConceptDraw DIAGRAM is a powerful diagramming and vector drawing software. Extended with Chemical and Process Engineering Solution from the Industrial Engineering Area of ConceptDraw Solution Park, it became the best Chemical Engineering software.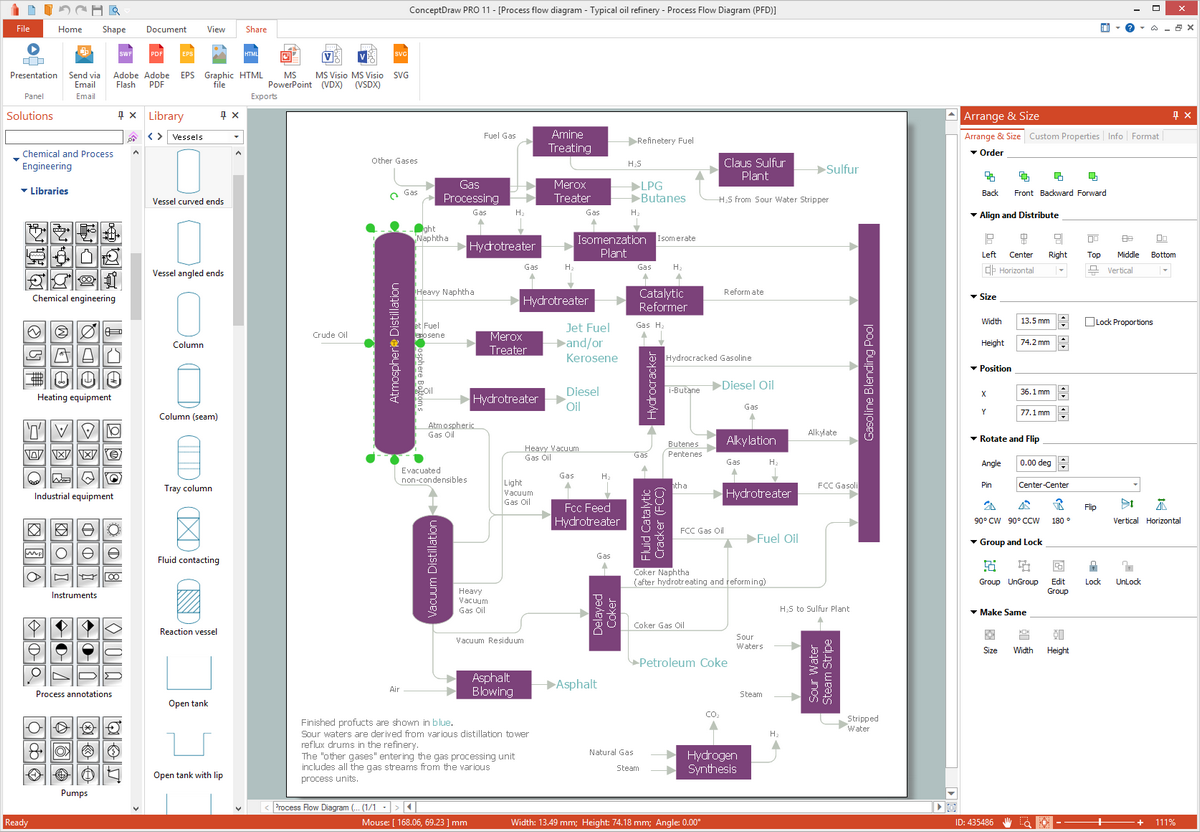
Picture: Chemical Engineering
Related Solution:
Both Crow’s Foot and Chen’s notations are used to build database models. Each of them has its’ own features, and if you use a proper entity relationship diagram software, you’ll be able to create diagrams of any notation. Database model with clearly defined entities and relationships between them facilitates further work greatly.
This ERD represents the model of Employee Certification Entity. The entity-relationship diagram is a visual instrument of database software development. It is used to structure data and to define the relationships between structured data groups. This ERD was designed with a help of ConceptDraw Entity-Relationship Diagram (ERD) solution. The solution supports the both basic ERD notations used to describe the structure of database: Chen's and Crow’s Foot notations.
Picture: Entity Relationship Software
Related Solution:
The use case diagram (behavior scenarios, precedents) is the initial conceptual representation of the system during its design and development. This diagram consists of actors, use cases and relationships between them. When constructing a diagram, common notation elements can also be used: notes and extension mechanisms.
This sample was created in ConceptDraw DIAGRAM diagramming and vector drawing software using the UML Use Case Diagram library of the Rapid UML Solution from the Software Development area of ConceptDraw Solution Park.
This sample shows the types of user’s interactions with the system and is used at the registration and working with the database system.
Picture: UML Use Case Diagram Example. Registration System
Related Solution:
The first thing that usually comes to mind when talking about database models is ER-diagrams, and the ways to create them. The second most recognizable notation is the Crow’s Foot, which visually differs from Chen’s notation. Actually, it doesn’t matter which notation you’ll use for your entity relationship diagram (ERD), but the content is what matters.
When designing an Entity-Relationship Diagram one need to use a certain notated symbols that were developed and standardized especially for databases description. First of them - the Chen’s notation had a linguistic origin. It includes rectangle boxes to show entities that may be described as nouns, and the relationships between them described as verbs depicted in a form of diamond. Finally the Chen’s notation was simplified up to the Crow’s Foot notation. It represents a relationship as labeled line. It is precisely this notation is shown in the given figure. ConceptDraw DIAGRAM together with its Entity-Relationship Diagram (ERD) solution is designed to support professionals who deals with creating ER diagrams using the element of both - Chen’s and Crow's Foot notations.
Picture: Design Element: Crows Foot for Entity Relationship Diagram - ERD
Related Solution:
When we start to speak about databases, we must always mention database structure visualization. One of the most common ways to do it is to create an entity relationship diagram, and to put appropriate symbols on it. It is important either for database projecting and for its' future maintenance.
Entity Relationship Diagram describes data elements and their relationships within a database. There are a set of special symbols that depict each element of an entity relationship diagram. Entities - represents some stable components such as supplier, employee, invoice, client, etc. Relation symbols show how the entities interact. Attributes define characteristics of the relationships. Attributes can be one-to-one or many-to-many. Physical symbols is used in the physical models. They represent items such as fields, tables, types and keys. ERD physical symbols are the building material for the database. Notation lines are used to illustrate the relationships. The most common method is Crow’s Feet notation. You can use ConceptDraw Entity-Relationship Diagram (ERD) solution to represent a database using the Entity-Relationship model.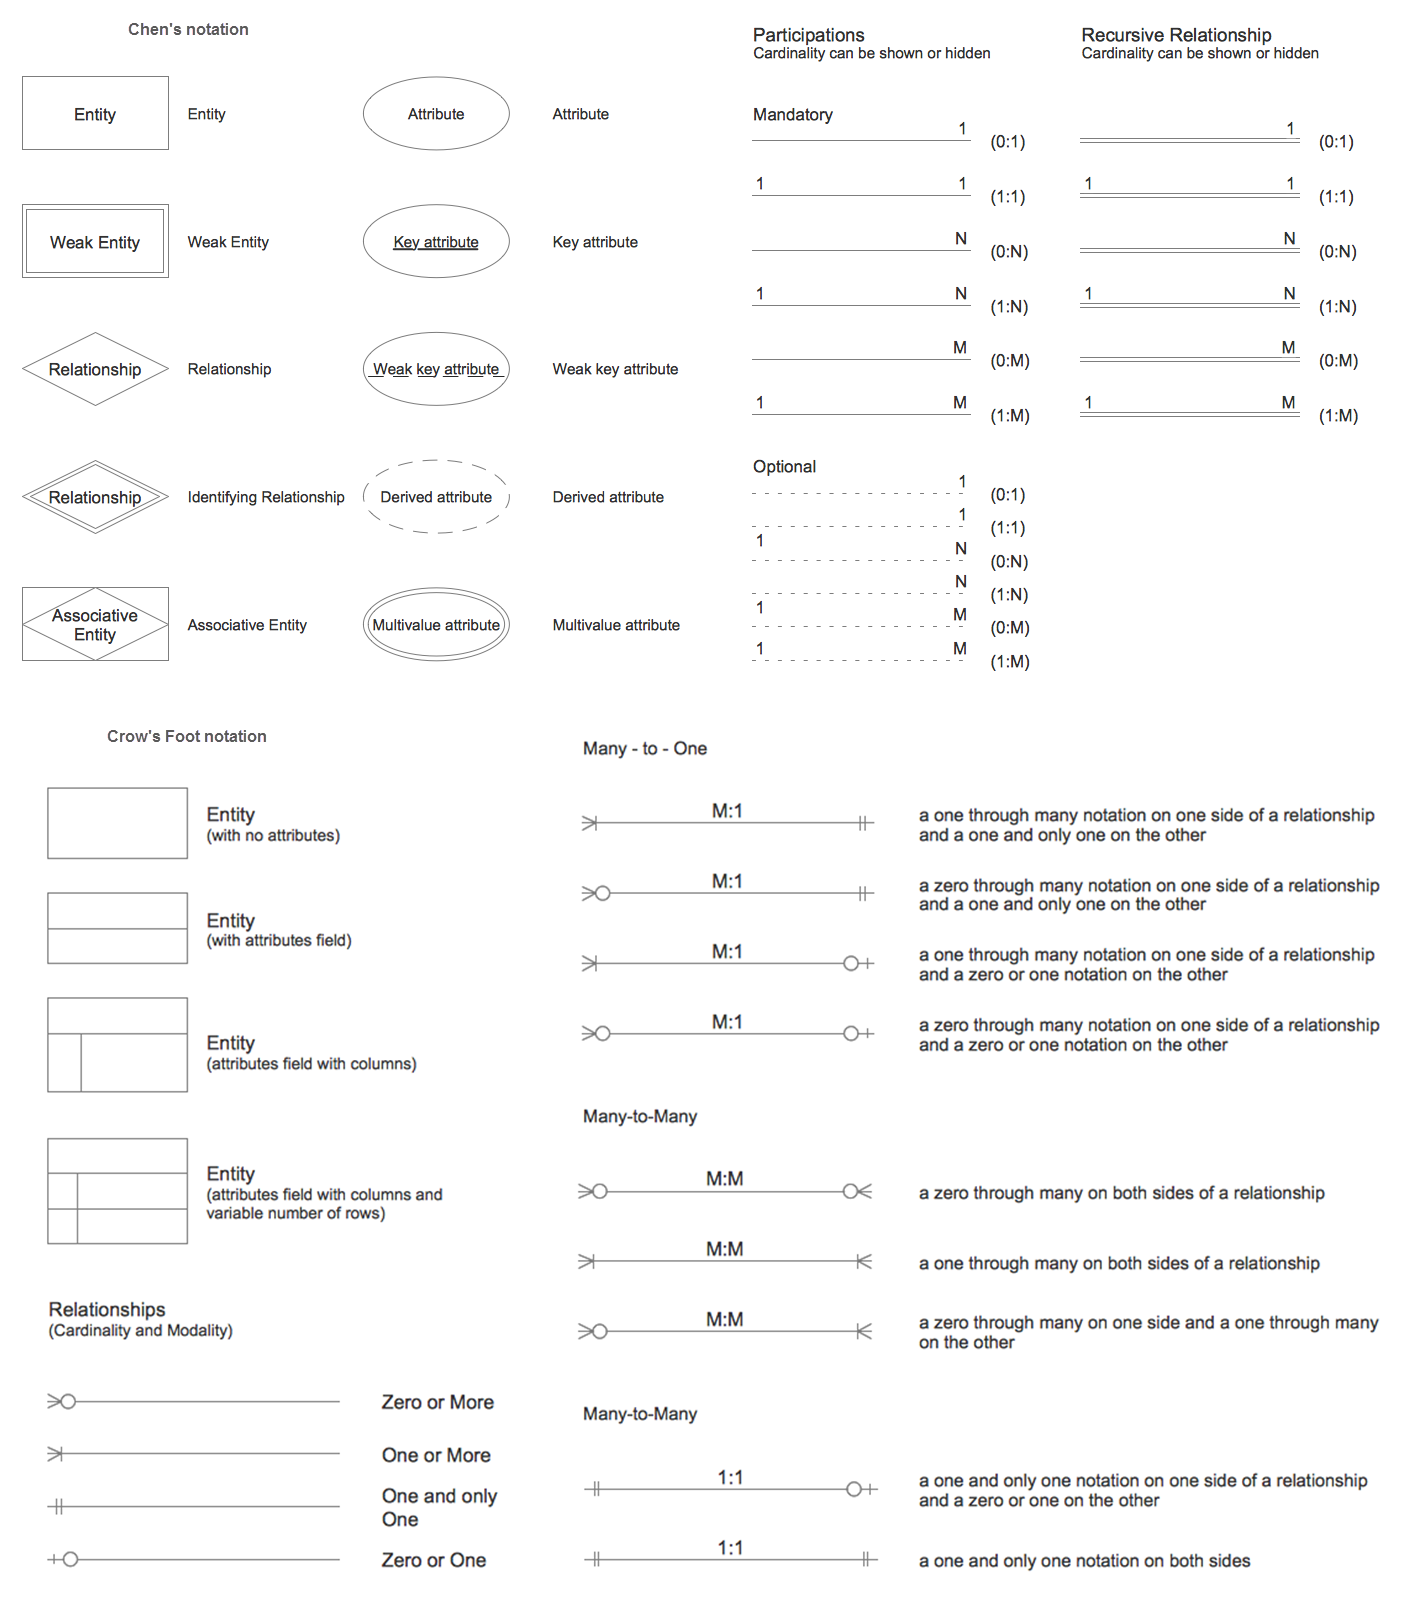
Picture: Entity Relationship Diagram Symbols
Related Solution:
A database is a data collection, structured into some conceptual model. Two most common approaches of developing data models are UML diagrams and ER-model diagrams. There are several notations of entity-relationship diagram symbols and their meaning is slightly different. Crow’s Foot notation is quite descriptive and easy to understand, meanwhile, the Chen notation is great for conceptual modeling.
An entity relationship diagrams look very simple to a flowcharts. The main difference is the symbols provided by specific ERD notations. There are several models applied in entity-relationship diagrams: conceptual, logical and physical. Creating an entity relationship diagram requires using a specific notation. There are five main components of common ERD notations: Entities, Actions, Attributes, Cardinality and Connections. The two of notations most widely used for creating ERD are Chen notation and Crow foot notation. By the way, the Crow foot notation originates from the Chen notation - it is an adapted version of the Chen notation.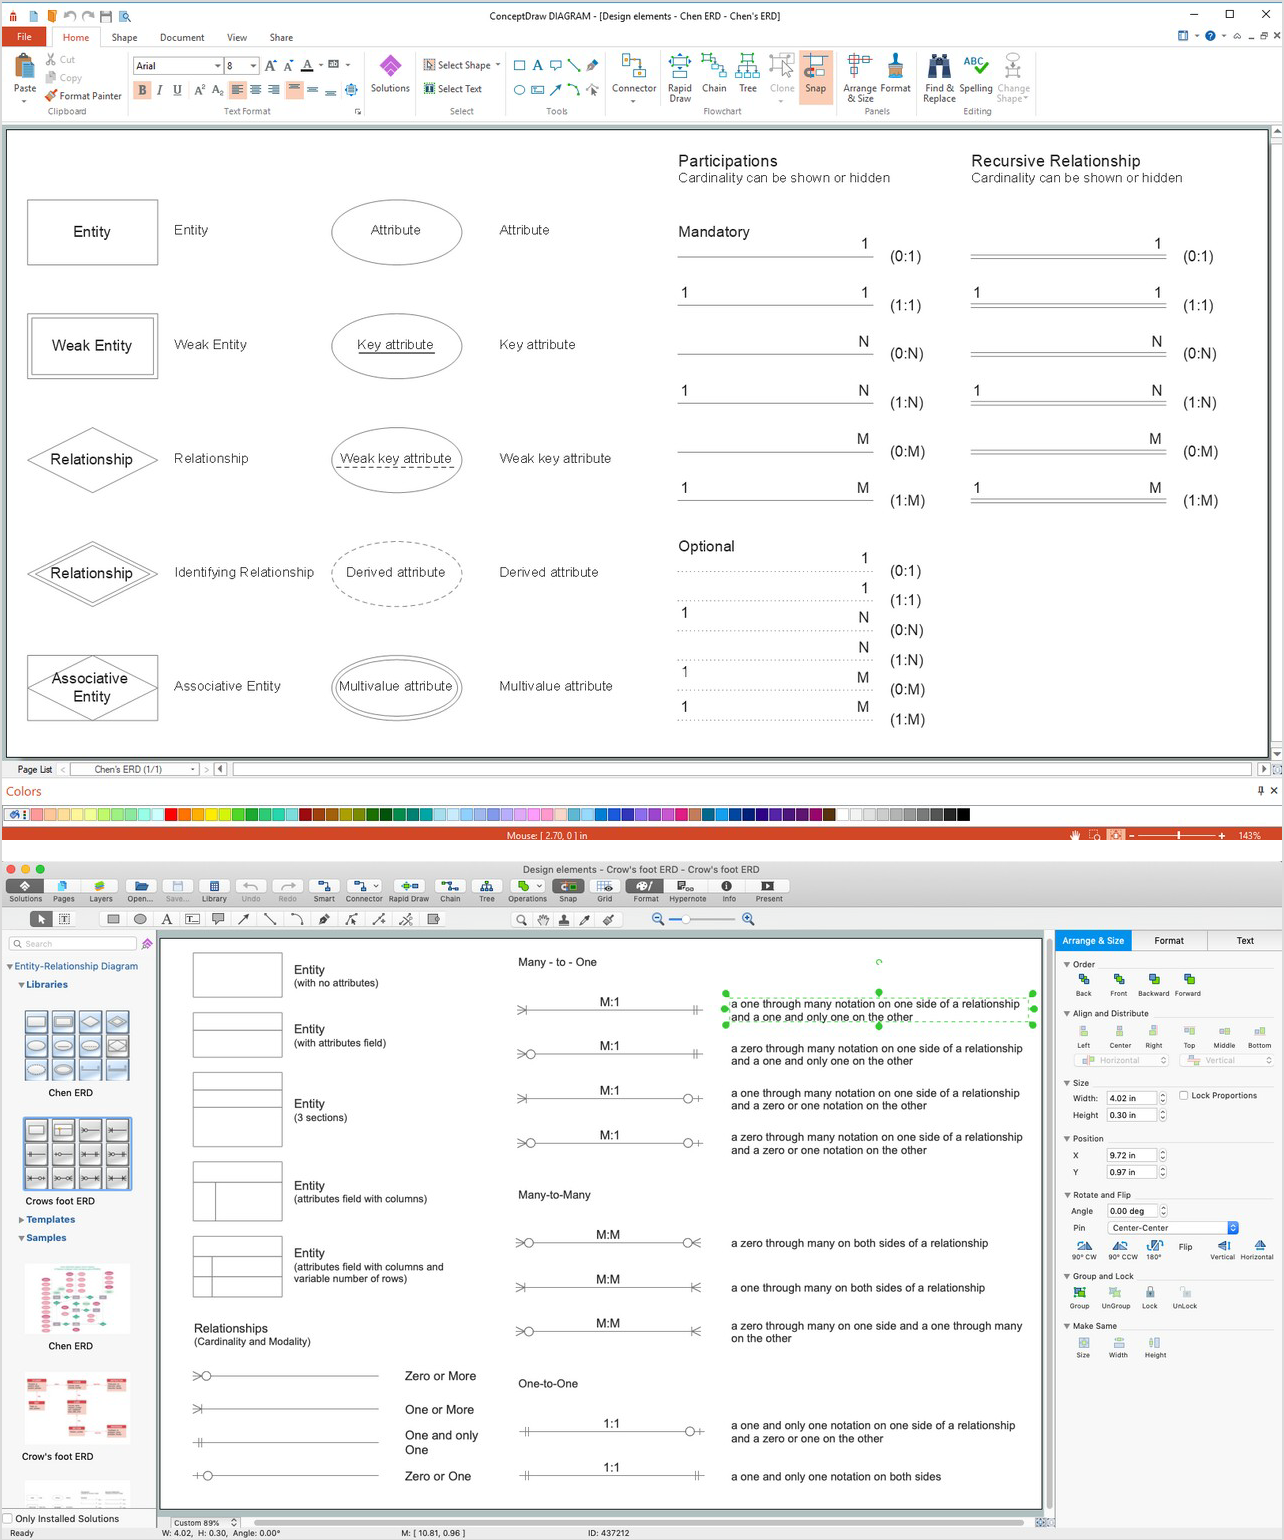
Picture: ERD Symbols and Meanings
Related Solution:
Structured-systems analysis and design method uses data flow diagrams to represent the process of data flowing through a system. Talking about this might be useless without a proper example of DFD for online store (Data Flow Diagram). This DFD example shows all the distinctness that a diagram can bring into a scattered data structure.
Data flow diagrams are used to show how data is processed within some business processes. Making DFD is a common practice for business process modeling and analysis. This diagram represents the online store business flow. It describes inputs and outputs within online selling process and depicts the interactions between its participants. This DF diagram can be used by system analysts to create an overview of a business, to study and discover its inherent strengths and weak points.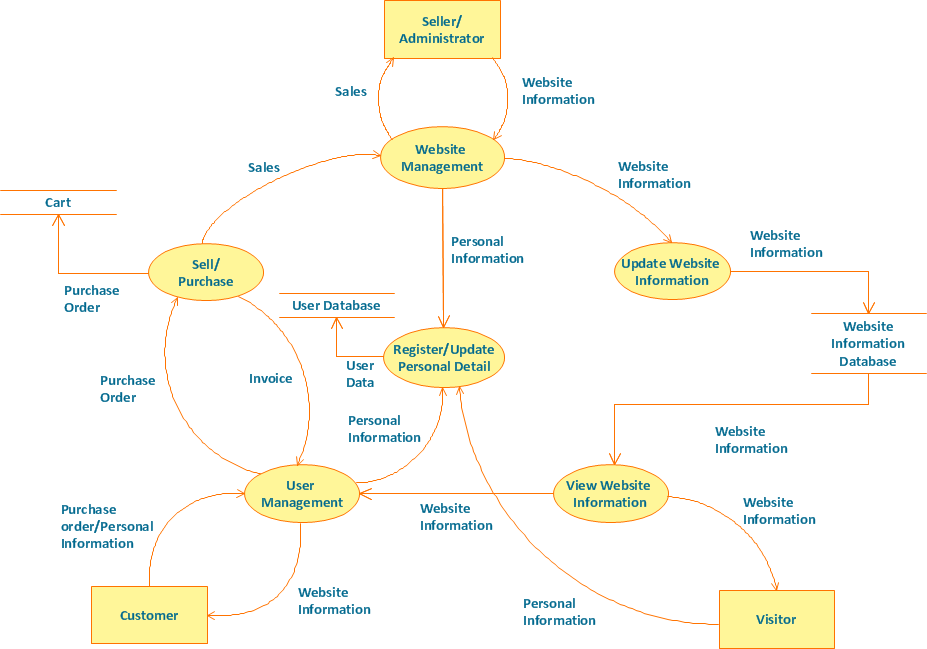
Picture: Example of DFD for Online Store (Data Flow Diagram)
Related Solution:
Visual navigation through the stages of a response process helps you locate specific actions to be taken via Action Mind Maps. Use ConceptDraw DIAGRAM and ConceptDraw MINDMAP for organize the process of response for interactions occurring in social media.
Picture: Create Response Charts
Related Solution:
Describing a workflow or approval process can take hours and be too complicated, especially since there are options to do it quickly and vividly. Diagrams called flowcharts replace long paragraphs of boring text and represent information in a graphic way. You can draw one on paper or you can use flowchart software to do it quickly and scalable. This kind of software is easy to use and you don’t need any special skills to start using it. In addition, there are a lot examples and predesigned templates on the Internet.
Flowcharts are a best tool for staking out a huge and complex process into some small readable parts. Surely, flowcharts can be drawn manually but the use of standard symbols that make it clear for a wide audience makes a software tool preferred for this task. The core for a successful flowchart is its simplicity. That is why often before beginning making flowchart through software, people draw the sketch on a piece of paper. Designing an effective flowchart means the combination of the data needed to be shown and the simplicity with which you depict it.
Picture: Flowchart Software: A Comprehensive Guide
Related Solution:
While creating flowcharts and process flow diagrams, you should use special objects to define different statements, so anyone aware of flowcharts can get your scheme right. There is a short and an extended list of basic flowchart symbols and their meaning. Basic flowchart symbols include terminator objects, rectangles for describing steps of a process, diamonds representing appearing conditions and questions and parallelograms to show incoming data.
This diagram gives a general review of the standard symbols that are used when creating flowcharts and process flow diagrams. The practice of using a set of standard flowchart symbols was admitted in order to make flowcharts and other process flow diagrams created by any person properly understandable by other people. The flowchart symbols depict different kinds of actions and phases in a process. The sequence of the actions, and the relationships between them are shown by special lines and arrows. There are a large number of flowchart symbols. Which of them can be used in the particular diagram depends on its type. For instance, some symbols used in data flow diagrams usually are not used in the process flowcharts. Business process system use exactly these flowchart symbols.
Picture: Flowchart Symbols: Meaning and Examples
Related Solution:


