What is Entity-Relationship Diagram
A database is a data collection, structured into some conceptual model. Two most common approaches of developing data models are:
- UML diagrams
- ER-model diagrams.
What is Entity-Relationship Diagram? Entity relationship diagrams look very similar to flowcharts, the main difference is the symbols provided by specific ERD notations. There are several models applied in entity-relationship diagrams: conceptual, logical and physical.

Example 1. What is Entity-Relationship Diagram, Crow's foot notation
Creating an entity relationship diagram requires using a specific notation. There are several notations of entity-relationship diagram symbols and their meaning is slightly different. Five main components of common ERD notations are Entities, Actions, Attributes, Cardinality and Connections.

Example 2. What is Entity-Relationship Diagram, Chen's notation
ERD notations
The two of notations most widely used for creating Entity-Relationship Diagrams are:
- Chen's notation
- Crow's foot notation.
Crow’s Foot notation is quite descriptive and easy to understand, meanwhile, the Chen notation is great for conceptual modeling. By the way, the Crow's foot notation originates from the Chen's notation - it is an adapted version of the Chen's notation.
Professional ERD drawing implies knowing of ERD symbols and meanings. Entity-Relationship Diagram (ERD) solution from Software Development area of ConceptDraw Solution Park includes icons advocated by Chen's and Crow’s Foot notation that can be used when describing a database.

Example 3. ERD Libraries
In Entity-Relationship Diagram (ERD) solution for ConceptDraw DIAGRAM all entity relationship diagram symbols and meaning, work flow shapes, and entity relationship stencils have easy to understand labels helps you while building Entity Relationship Diagram.

Example 4. Entity-Relationship Diagram Symbols
The Entity-Relationship Diagram (ERD) solution from ConceptDraw Solution Park extends ConceptDraw DIAGRAM ector graphics and diagramming software with the ability to describe a database using the Entity-Relationship model. Use it to draw with pleasure your own professional-looking Entity-Relationship Diagrams using Chen's or Crow's foot notations.
All source documents are vector graphic documents. They are available for reviewing, modifying, or converting to a variety of formats (PDF file, MS PowerPoint, MS Visio, and many other graphic formats) from the ConceptDraw STORE. The Entity-Relationship Diagram (ERD) Solution is available for all ConceptDraw DIAGRAM or later users.
TEN RELATED HOW TO's:
ConceptDraw Value Stream Mapping solution extends software with templates, samples and vector shapes for drawing Value Stream Maps (VSM).
Picture: Standard Shapes for Value Stream Mapping
Related Solution:
ConceptDraw gives the ability to draw Flowchart documents. Flowcharts solutionis a powerful tool that extends ConceptDraw application for drawing business flowcharts.
ConceptDraw DIAGRAM vector diagramming and business graphics software enhanced with with templates, green and interactive flowchart makers, samples and stencil libraries from ConceptDraw Solution Park which all focused to help with drawing flowcharts, block diagrams, bar charts, histograms, pie charts, divided bar diagrams, line graphs, area charts, scatter plots, circular arrows diagrams, Venn diagrams, bubble diagrams, concept maps, and others.
Picture: The Best Flowchart Software Available
Related Solution:
A family evening in a restaurant can be just charming, the problem is to find a one. If you spend an extra day to create a good restaurant floor plan, that will surely brings more clients. By the time your restaurant gets more popular, don’t forget about the quality of service.
The restaurant floor plan you see on this page was made with ConceptDraw DIAGRAM in accompanied with Cafe and Restaurant Plans solution. It introduces facilities of the solution and demonstrates the results, you can obtain if you deploy ConceptDraw tools for generating floor plans and interior designs for cafe, restaurants or other catering establishments. A little less than three hundred vector objects, and a set of built-in templates and a set of examples will maintain your creativeness.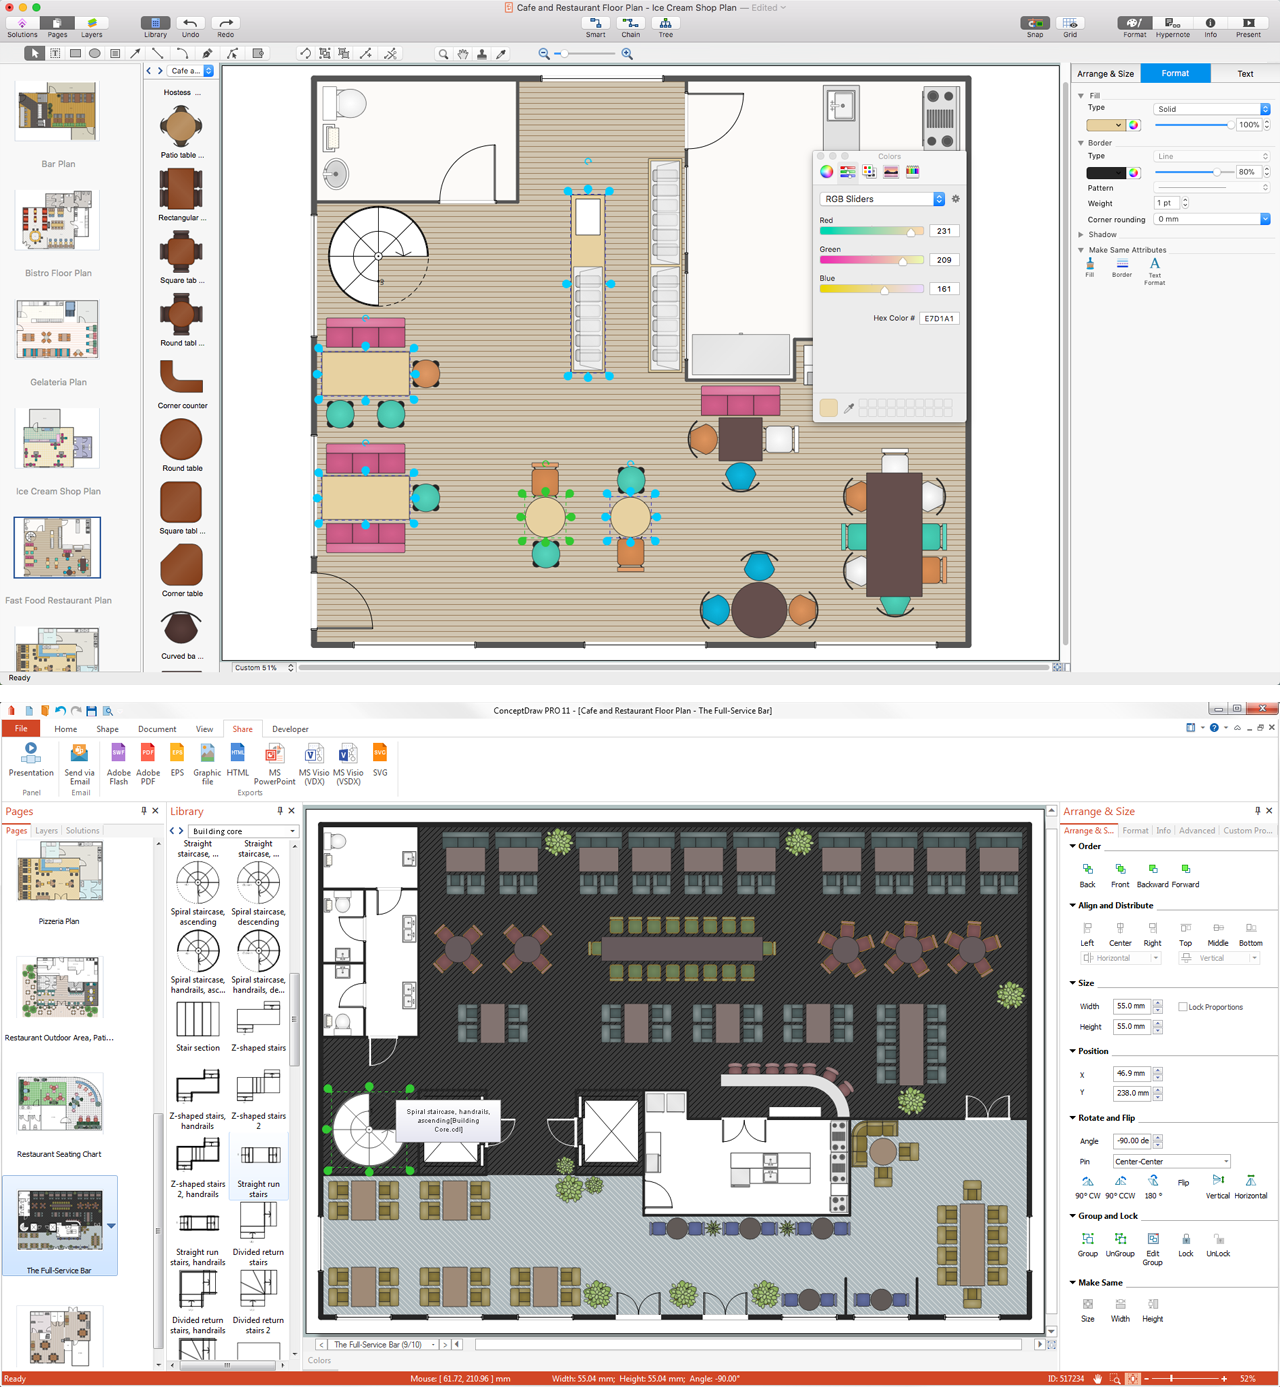
Picture: Restaurant Floor Plans
Related Solution:
Teams working with Scrum methodology use the product backlog items (PBIs), bug work item types (WITs), reports and dashboards. SCRUM Workflow solution for ConceptDraw DIAGRAM software offers collection of samples, variety of predesigned objects, clipart and graphic elements, a set of Scrum process work items and workflow which are developed for agile teams working using Scrum.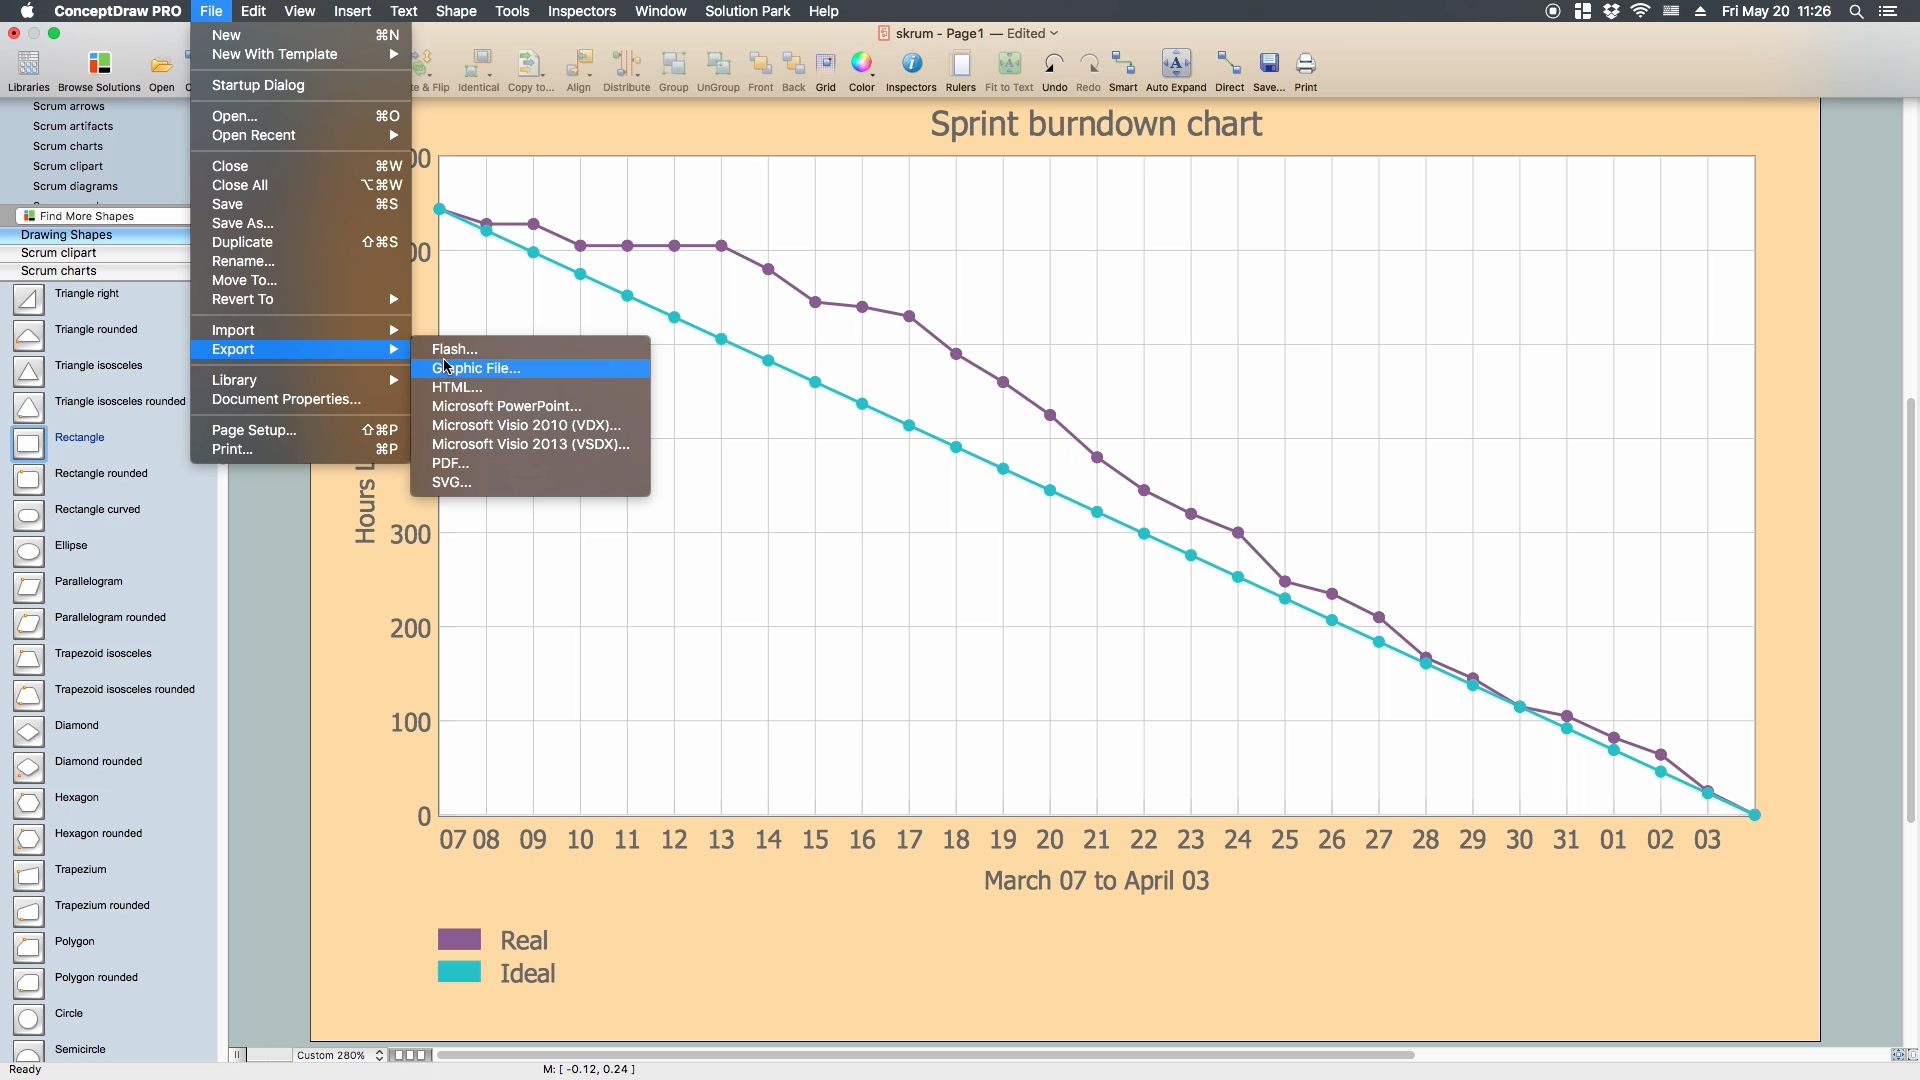
Picture: Scrum process work items and workflow
Related Solution:
ER diagram is the most popular database design tool which lets create graphical representations of database tables, their columns and also relationships. As for the Mac users, they are very interested in powerful database diagramming tools and ER diagram tool for OS X to design professional looking E-R Diagrams and ERD drawings. ConceptDraw DIAGRAM software on Mac OS X gives the ability to easy draw ERDs.
Picture: ER diagram tool for OS X
Related Solution:
The vector stencils library Chen ERD from the solution Entity-Relationship Diagrams (ERD) contains specific symbols of the Chen ERD notation including entity symbols and relationship symbols for ConceptDraw DIAGRAM diagramming and vector drawing software. The Entity-Relationship Diagrams (ERD) solution is contained in the Software Development area of ConceptDraw Solution Park.
Picture: Chen ERD Diagram
Related Solution:
This sample shows the Flowchart that displays the layout and work flow of the cloud marketing platform. This diagram has a style of the marketing brochure. This style displays the central product that is related to the other issues.
Using the ready-to-use predesigned objects, samples and templates from the Flowcharts Solution for ConceptDraw DIAGRAM you can create your own professional looking Flowchart Diagrams quick and easy.
Picture: Flowchart Marketing Process. Flowchart Examples
Related Solution:
The Process Flowchart or Process Flowchart Diagram (PFD) is a visual representation relations between major parts of the system, the steps in a process, and even connections between various systems. The possibility to easy create professional-looking and attractive Process Flowcharts, Business Process Diagrams and Maps which visualize the steps of complex processes is provided by Business Process Diagram Solution from the Business Processes Area of ConceptDraw Solution Park and 16 libraries with 230 process flowchart symbols from BPMN 1.2 and BPMN 2.0.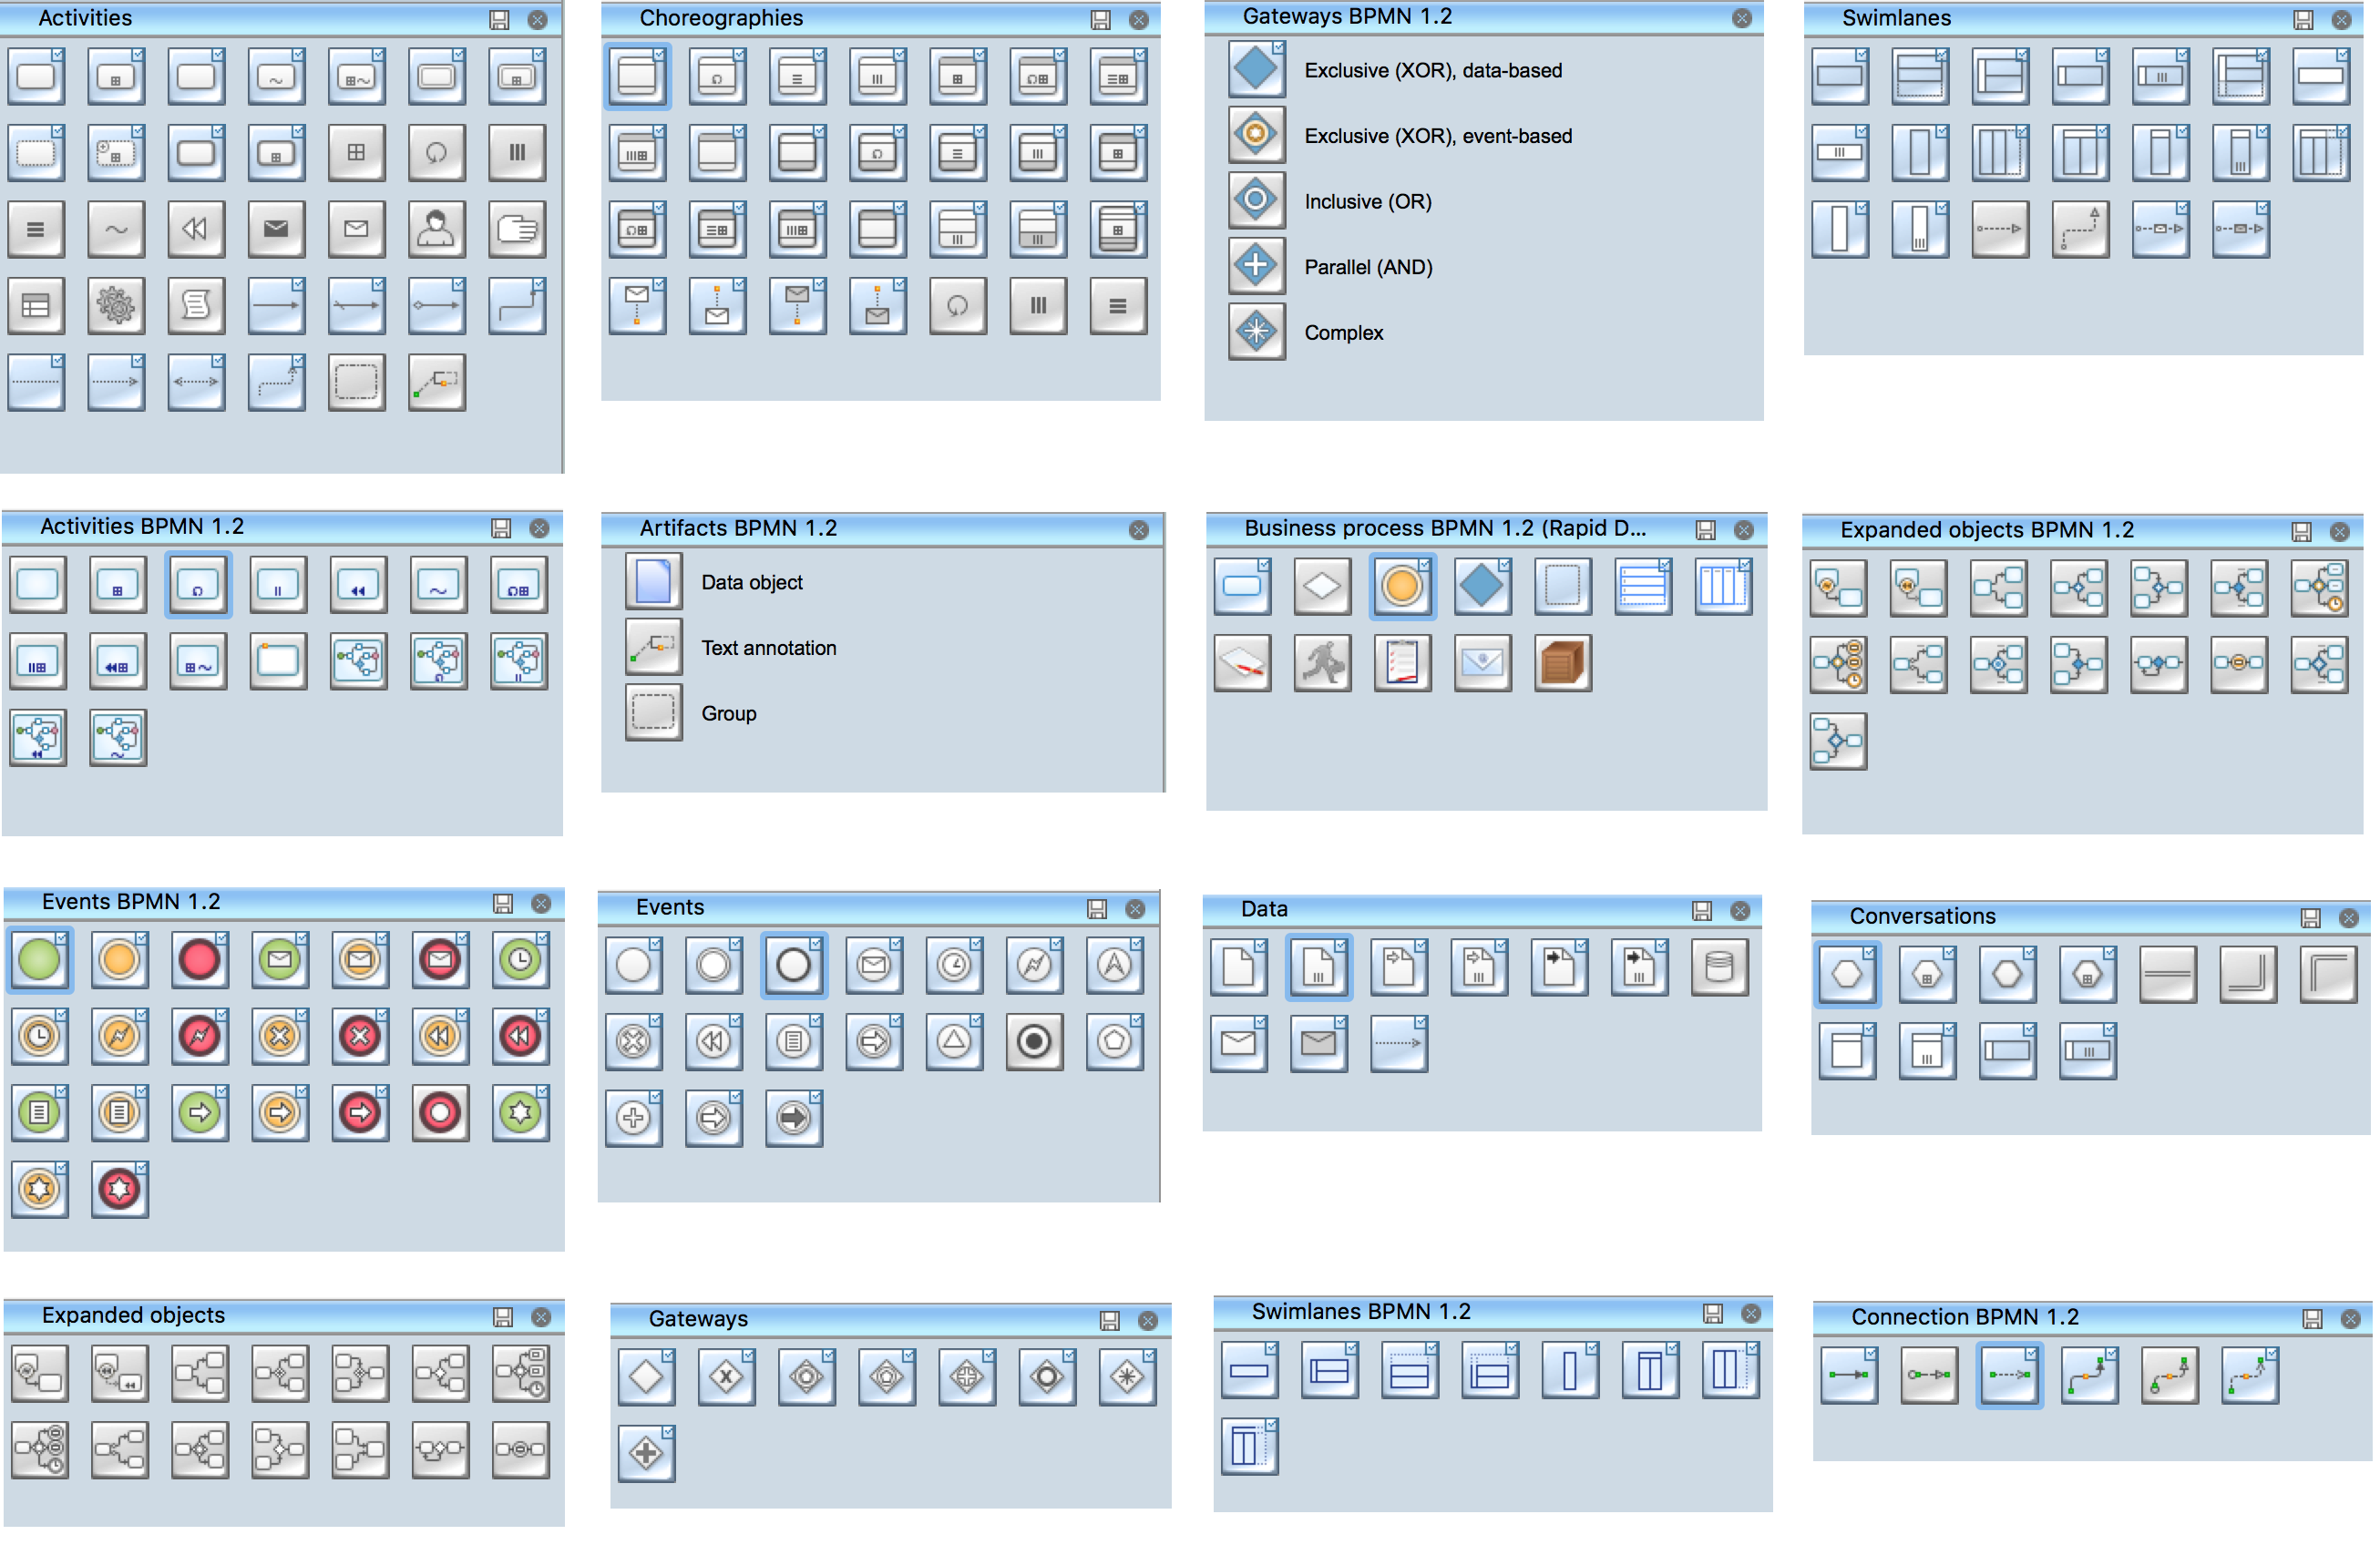
Picture: Process Flowchart Symbols
Related Solution:
Event-Driven Process chain Diagrams for improvement throughout an organisation. Best software for Process Flow Diagram. The Event-driven Process Chain (EPC) Diagrams allows managers to plan processes and resources.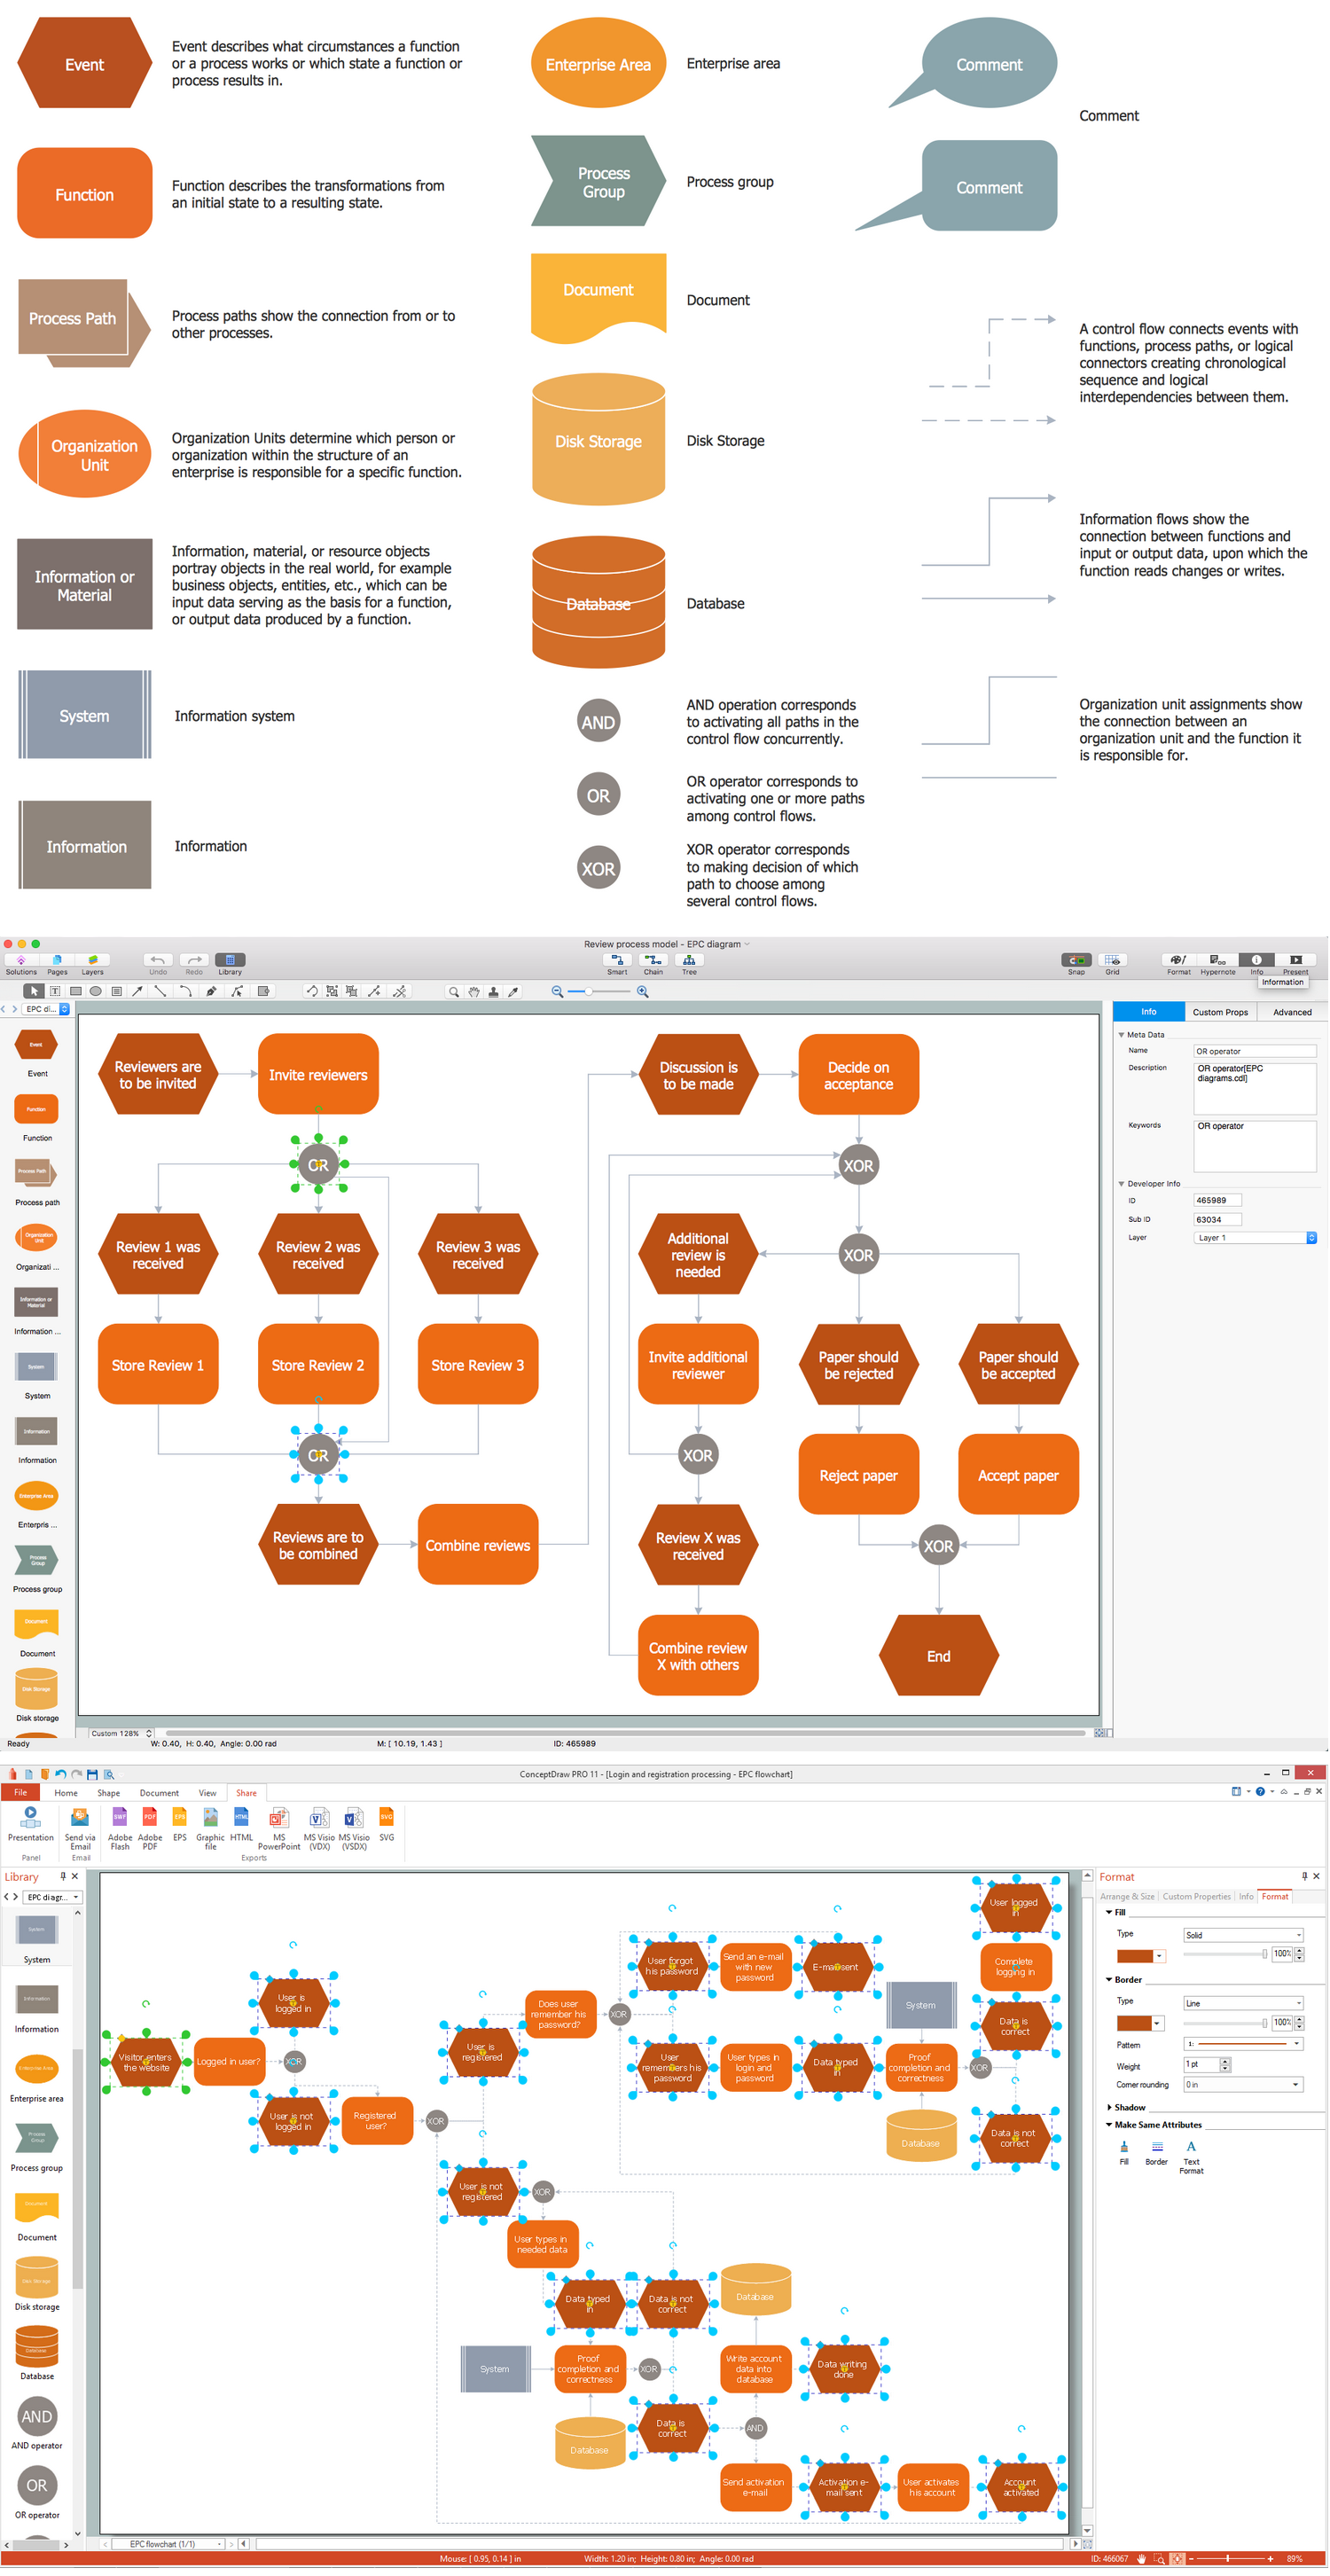
Picture: Business process Flow Chart — Event-Driven Process chain (EPC) diagrams
Related Solution:


