Example Basic Flowchart. Flowchart Examples
This sample was created in ConceptDraw DIAGRAM software using the Flowcharts solution from the "Diagrams" area of ConceptDraw Solution Park.
Example 1. Example Basic Flowchart.
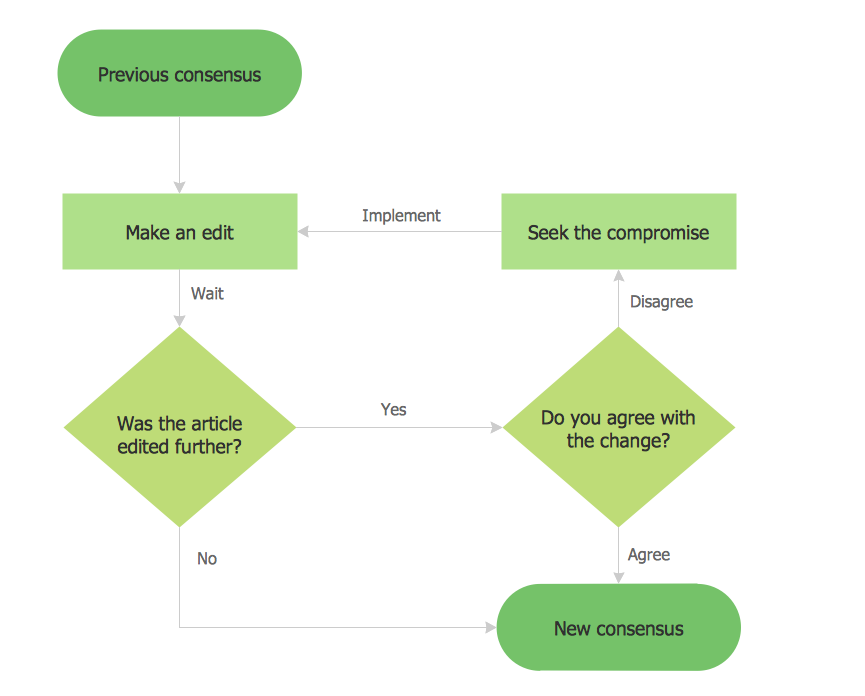
Consensus Flowchart
This example was redesigned from the Wikimedia Commons file [commons.wikimedia.org]
This sample shows the Flowchart that displays the process of the achievement the consensus, in other words solving for the acceptable solution.
This Flowchart has start point. The rectangles on it represent the steps of the process and are connected with arrows that show the sequence of the actions. The diamonds with yes/no shows the decisions. The Flowcharts are widely used in marketing, business, analytics, government, politics, engineering, architecture, science, manufacturing, administration, etc.
Using the ready-to-use predesigned objects, samples and templates from the Flowcharts Solution for ConceptDraw DIAGRAM you can create your own professional looking Flowchart Diagrams quick and easy.
The Flowcharts produced with ConceptDraw DIAGRAM are vector graphic documents and are available for reviewing, modifying, and converting to a variety of formats (image, HTML, PDF file, MS PowerPoint Presentation, Adobe Flash or MS Visio).
TEN RELATED HOW TO's:
Analysis is very important part for every business, as it helps to understand the weakness and to see the opportunities, and SWOT is one of the most effective tools. To illustrate the multifunctionality of this tool, let’s imagine a SWOT sample in area of computers networking, which can be carried out to realize the pros and cons of some equipment, for example. Even a network topology or a administer can be a subject for this analysis.
This SWOT analysis matrix illustrate the sample of using this useful technique for comprehension of Strengths and Weaknesses, and for determining the Opportunities open to business and the Threats it encounters. Used in a business scope, it will help to create a perspective niche in the market for particular business. The ConceptDraw SWOT and TOWS Analysis solution gives a lot of templates of both SWOT and TOWS matrices that allow managers and marketers create custom diagrams to perform SWOT or TOWS analysis in context of a particular business.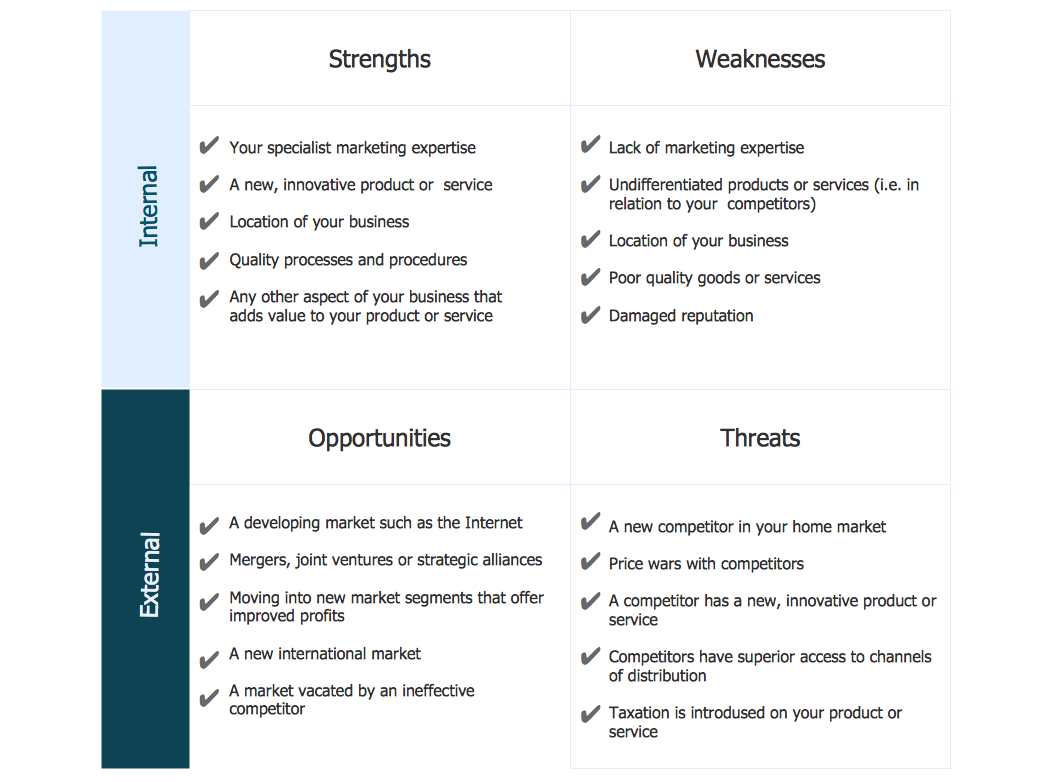
Picture: SWOT Sample in Computers
If you have doubts about some situation, there are tools that might help you. First used in the Stanford Research Institute in the 60s, SWOT analysis is a great solution and if you need to build a strategy, this tool is very effective. As a result, you will get the clear idea of all the opportunities and threats you might face.
This matrix was build for a TOWS analysis performance. A TOWS analysis includes the same process of listing strengths, weaknesses, opportunities and threats as a SWOT analysis. But, unlike SWOT, TOWS analysis primarily takes into account threats and opportunities and then at least - weaknesses and strengths. This is also a is a strategic planning tool. Beyond making a matrix, the strategy manager should investigate ways the organization can take edge of opportunities and reduce threats by turning to advantage strengths and weaknesses. Making SWOT and TOWS analysis uses the same approach and outputs close results. ConceptDraw SWOT and TOWS Matrix Diagrams solution supplies templates of matrices, that help to list clearly the constituents of SWOT and TOWS analysis.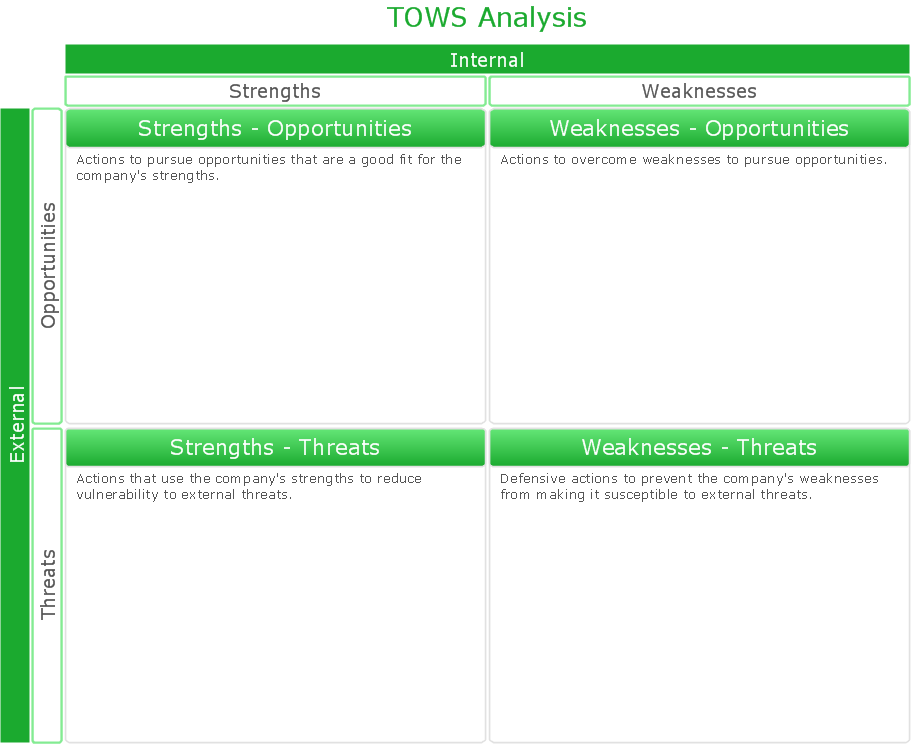
Picture: SWOT Analysis Solution - Strategy Tools
ConceptDraw Flowcharts visualize a process or algorithm of program as step/operation blocks of various shapes connected with arrowed lines showed the process flow direction. They are used to visualize business or technical processes and software algorithms.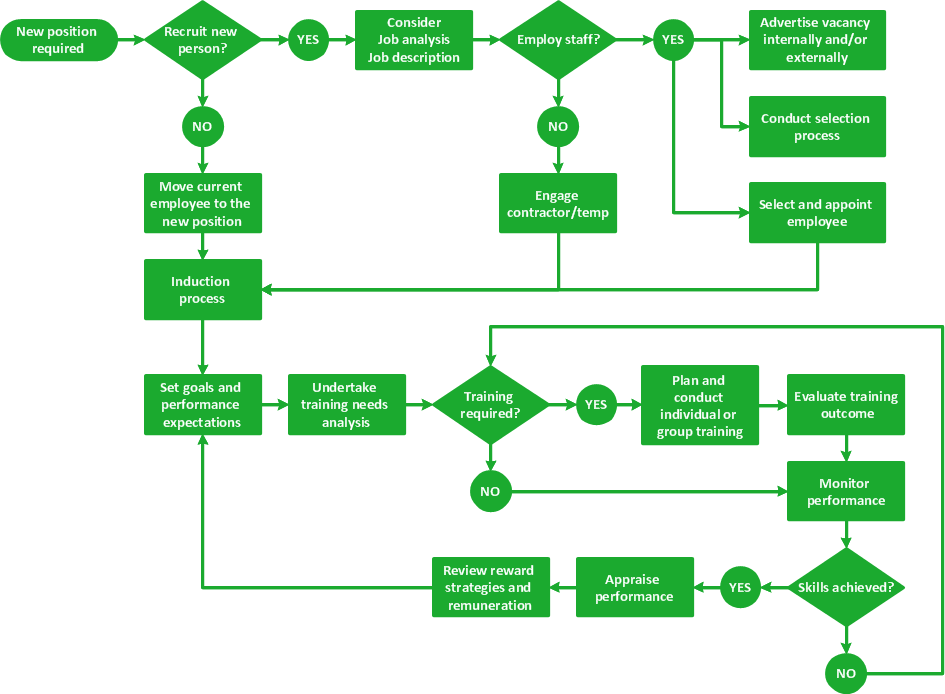
Picture: Selecting & Creating Flowcharts
Related Solution:
Process Flow Charts are very popular and widely used in chemical and process engineering for representation a general flow of plant processes and equipment. If you need often draw them, the ConceptDraw DIAGRAM diagramming and vector drawing software extended with tools of Flowcharts Solution will be useful for you.
The mostly used set of process flow chart symbols includes the following: Rectangle (box) process flow chart symbol, Rounded rectangle, Circle, Diamond.
Picture: Process Flow Chart Symbol
Related Solution:
Problem Solving - ConceptDraw OFFICT suite is a software for the problem solving. The Seven Management and Planning Tools solution is a set of such tools for investigating complex problems.
These tools are exemplary at organizing research, parsing complex problems, providing a structure for the details, helping managers make decisions, and organizing effective communications in a visual manner that keeps everyone involved.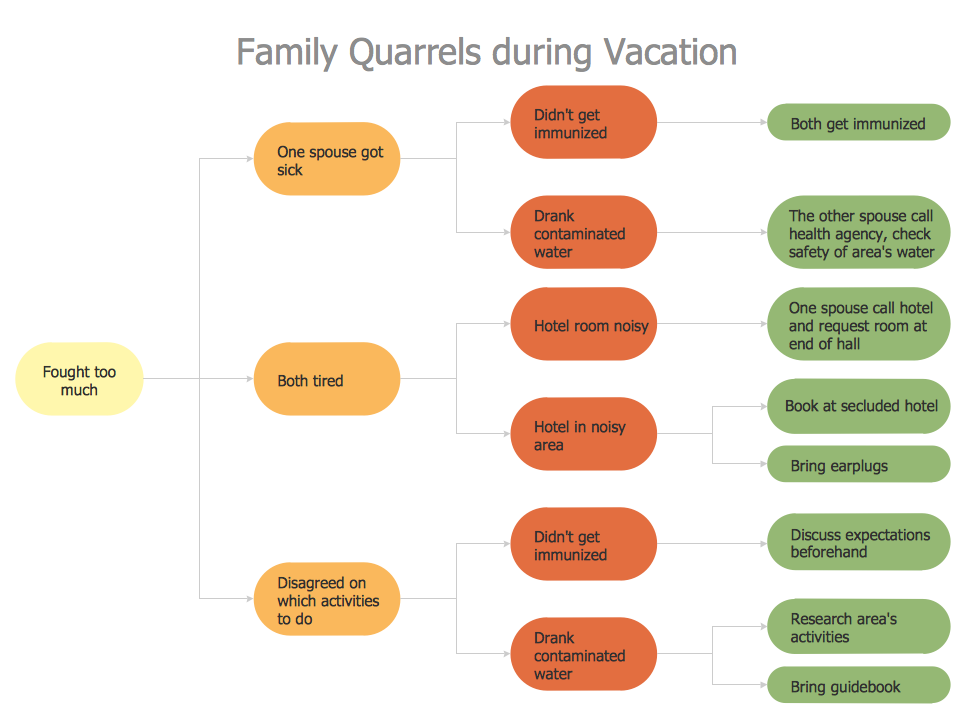
Picture: Problem solving
Try ConceptDraw program, the perfect drawing tool for creating all kinds of great-looking drawings, charts, graphs, and illustrations.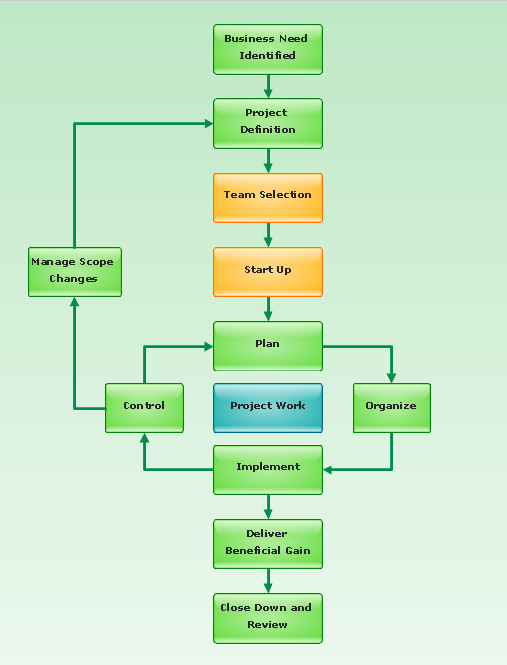
Picture: Basic Diagramming
Related Solution:
Flowcharts are helpful in understanding a complicated process. ConceptDraw DIAGRAM allows you to creating a simple flowchart. The ability to create flowcharts is contained in the Flowcharts solution. The solution provides a set of special tools for creating flowcharts.
Picture: Creating a Simple Flowchart
Related Solution:
Draw detailed Computer Network Diagrams, Designs, Schematics, and Network Maps with ConceptDraw DIAGRAM in no time! Pre-drawn shapes representing computers, network devices plus smart connectors help create accurate diagrams and documentation.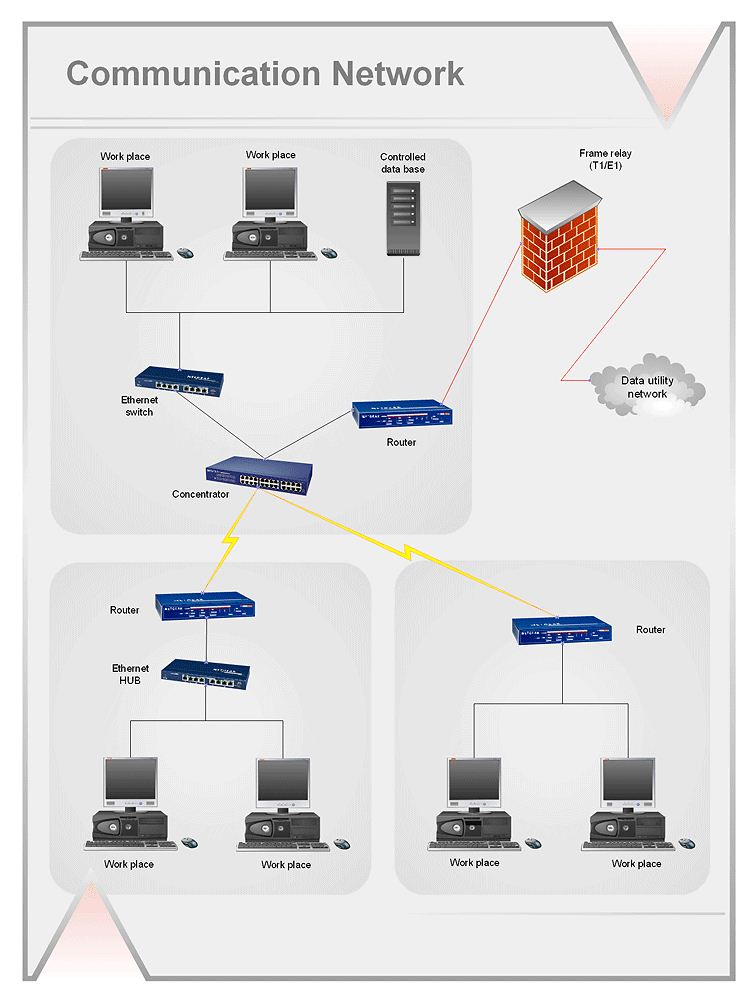
Picture: Network Diagramming with ConceptDraw DIAGRAM
This sample was created in ConceptDraw DIAGRAM drawing software using the Flowcharts solution.
Picture: Horizontal Flowchart
Related Solution:
The Value stream is a totality of all actions on the projection, order composition and production: starting from creation a product project to launching this product, from order to delivery, from extraction of raw materials to ready product manufacturing. Value stream mapping is a process of visualization of these actions and creation of a detailed and graphical map.
Picture: Value stream with ConceptDraw DIAGRAM
Related Solution: