Examples of Infographics
ConceptDraw DIAGRAM diagramming and vector drawing software offers the unique Data-driven Infographics Solution from the “Infographics” Area with variety of predesigned examples of infographics and data-driven infographic charts.
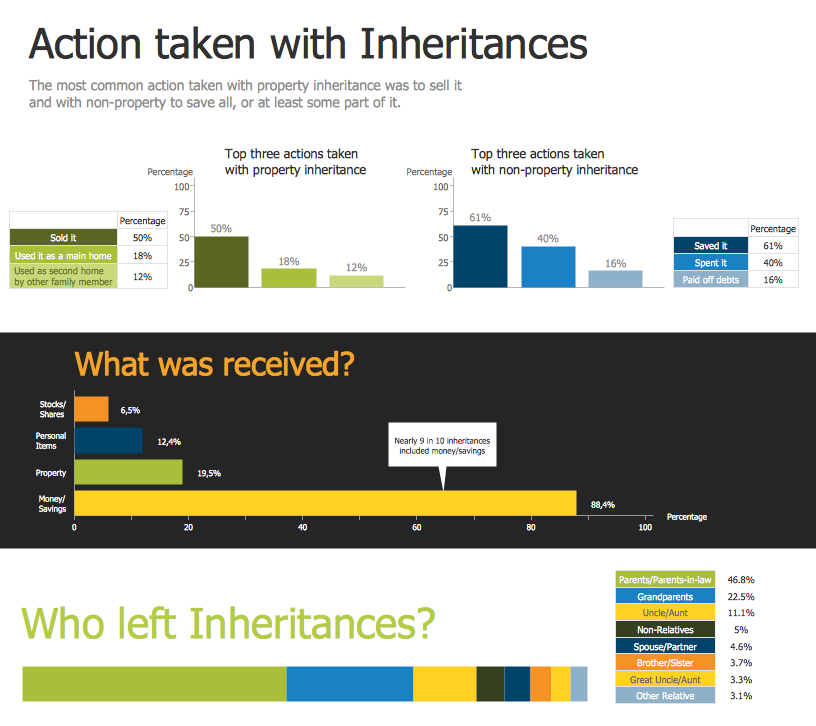
Example 1. Examples of Infographics - Inheritances in GB
Variety of infographics examples, samples and templates included in Data-driven Infographics Solution is available from ConceptDraw STORE. All data-driven examples of infographics and templates are available for changing and further successful using.

Example 2. Data-driven Infographics Solution in ConceptDraw STORE
Pay also special attention for the ready-to-use vector objects included in the Data-driven Charts library — they are smart objects, the change of the data at the tables and charts will change automatically their views.

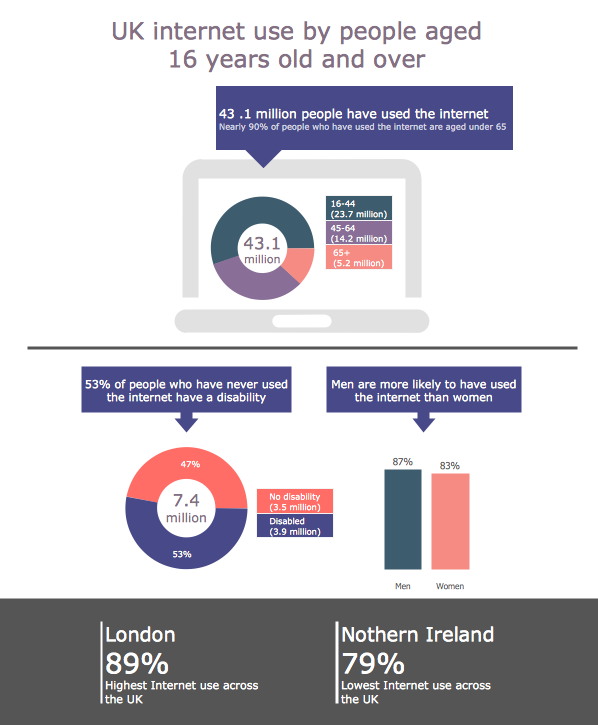
Example 3. Examples of Infographics - UK Internet Use
The examples of infographics you see on this page were created in ConceptDraw DIAGRAM software using the Data-driven Infographics Solution from the “Infographics” Area. An experienced user spent 10 minutes creating each of them.
Use the Data-driven Infographics Solution for ConceptDraw DIAGRAM Solution Park for drawing your own Data-driven Infographics quick, easy and effective.
All source documents are vector graphic documents. They are available for reviewing, modifying, or converting to a variety of formats (PDF file, MS PowerPoint, MS Visio, and many other graphic formats) from the ConceptDraw STORE. The Data-driven Infographics Solution is available for all ConceptDraw DIAGRAM or later users.
THREE RELATED HOW TO's:
Physical network represents the computer network topology that includes the computer devices, location and cable installation. Physical network includes the actual nodes, segments and hosts.
This example was created in ConceptDraw DIAGRAM using the Computer and Networks Area of ConceptDraw Solution Park and shows the Physical star network.
Picture: Physical network. Computer and Network Examples
Related Solution:
The popularity of visual Data Infographics grows day by day. So it would be nice to have effective ConceptDraw software for their quick and easy creating.
Picture: Data Infographics
Related Solution:
In the course of recent decades data visualization went through significant development and has become an indispensable tool of journalism, business intelligence and science. The way visual information may be conveyed is not limited simply to static or dynamic representation, it can also be interactive. Infographics can be conditionally divided into several general levels. Primarily, this is level of visualization of information, its interpretation and association on any ground. Second level can be defined as a visualization of knowledge, depiction of thoughts and ideas in the form of images or diagrams. Finally, the level of data visualization, which processes data arrays in charts, enabling the information to be more clearly perceived. You can also identify the main approaches to the creation of infographics: exploratory and narrative. Exploratory method insists on minimalist design in favor of data precision without unnecessary details and is common for scientific researches and ana
Picture: Design Pictorial Infographics. Design Infographics
Related Solution: