Export from ConceptDraw DIAGRAM Document
to PPT or PPTX (MS PowerPoint®) File
|
ConceptDraw DIAGRAM has extensive export capabilities which allow you to export your drawing to If you have a multipage document in ConceptDraw DIAGRAM it will be automatically converted to a .ppt or .pptx file with slides made of pages from your document. |
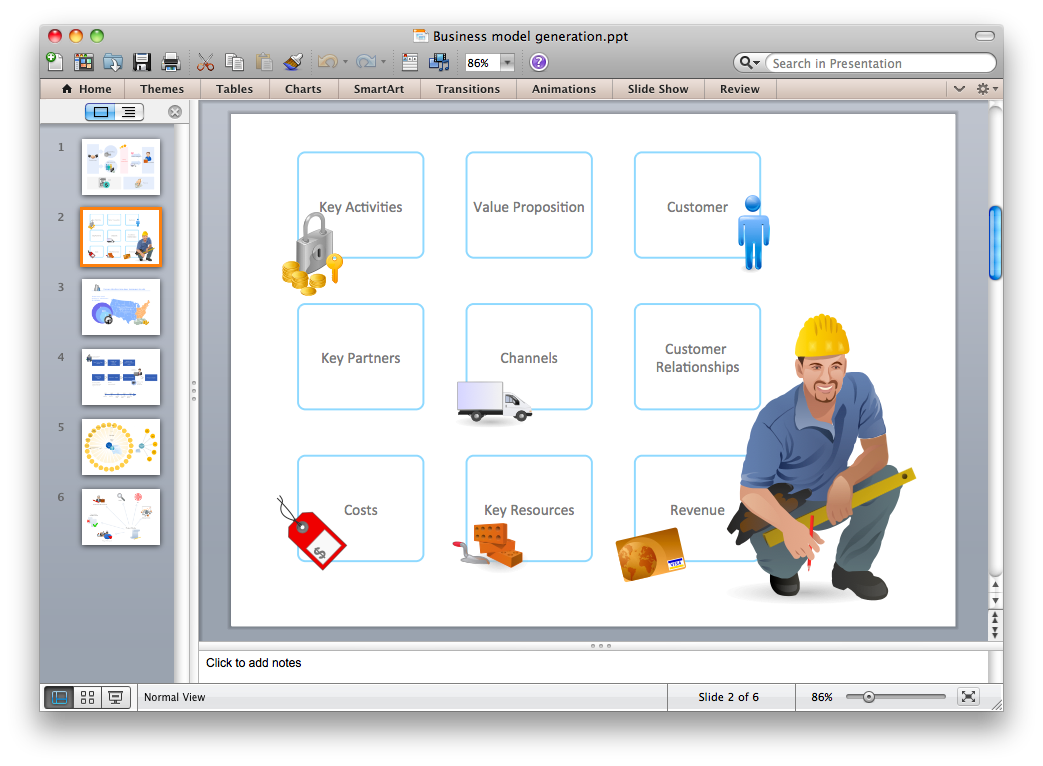
Pic. 1. A PowerPoint presentation file exported from a ConceptDraw DIAGRAM document.
There are no special settings required for this kind of export in CoceptDraw PRO, so you can create an
See also Samples:
- Business Process Diagrams
- Business Processes — Flow Charts
- Computer and Networks — Computer Network Diagrams
- Dashboards and KPI`s
- Fishbone Diagram
- Floor Plan and Landscape Design
TEN RELATED HOW TO's:
Database design is an important part of any project, as databases become more and more complex nowadays. To make the model more representative, entity relationship diagrams are widely used in software engineering area. These diagrams show sets of entities as rectangles connected via lines labeled with their cardinalities.
This an example of the ER-diagram developed to store information regarding some online role-playing game. It includes three main elements of ER diagram: entities, relationships and attributes. The entities, attributes and relationships on this ER-diagram is depicted according to the Chen's notation. Chen's notation for Entity Relationship diagrams admits using of rectangles to depict entities, ovals for attributes and ,at least, diamonds to show relationships. ConceptDraw Entity-Relationship Diagrams solution was applied as ERD software to create this diagram.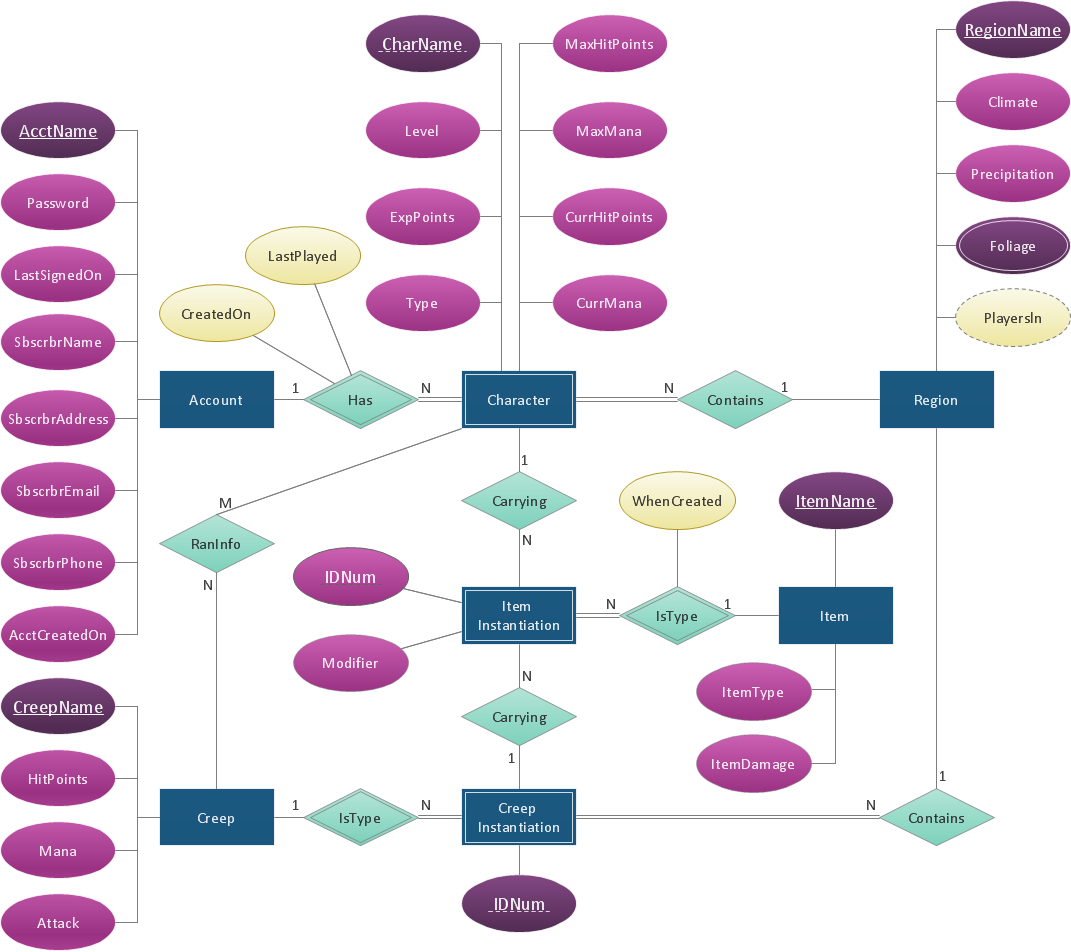
Picture: ConceptDraw DIAGRAM ER Diagram Tool
Related Solution:
In ConceptDraw DIAGRAM it really is sp simple to draw even the most complex cross-functional flowcharts. Use the RapidDraw technology and Cross-Functional libraries in ConceptDraw DIAGRAM for the best results.
Picture: How to Simplify Flow Charting — Cross-functional Flowchart
Related Solution:
This sample shows the Six Markets Model Chart. It was created in ConceptDraw DIAGRAM diagramming and vector drawing software using the Marketing Diagrams Solution from the Marketing area of ConceptDraw Solution Park.
The six markets model defines six markets that take the central place in the relationship marketing: internal markets, supplier markets, recruitment markets, referral markets, influence markets and customer markets. The six markets model allows the organization to analyze the stakeholders and key market domains that can be important to it.
Picture: Six Markets Model Chart
Related Solution:
ConceptDraw DIAGRAM diagramming and vector drawing software supplied with Sales Dashboard solution provides the full set of useful tools which make it the best for producing the live KPI Dashboard of any complexity.
Picture: KPI Dashboard
Related Solution:
Whenever you need quick presentations, the ability to choose specific content, the ability to focus on specific stakeholder needs, update data, or create polished slide decks — ConceptDraw MINDMAP provides a presentation solution for you.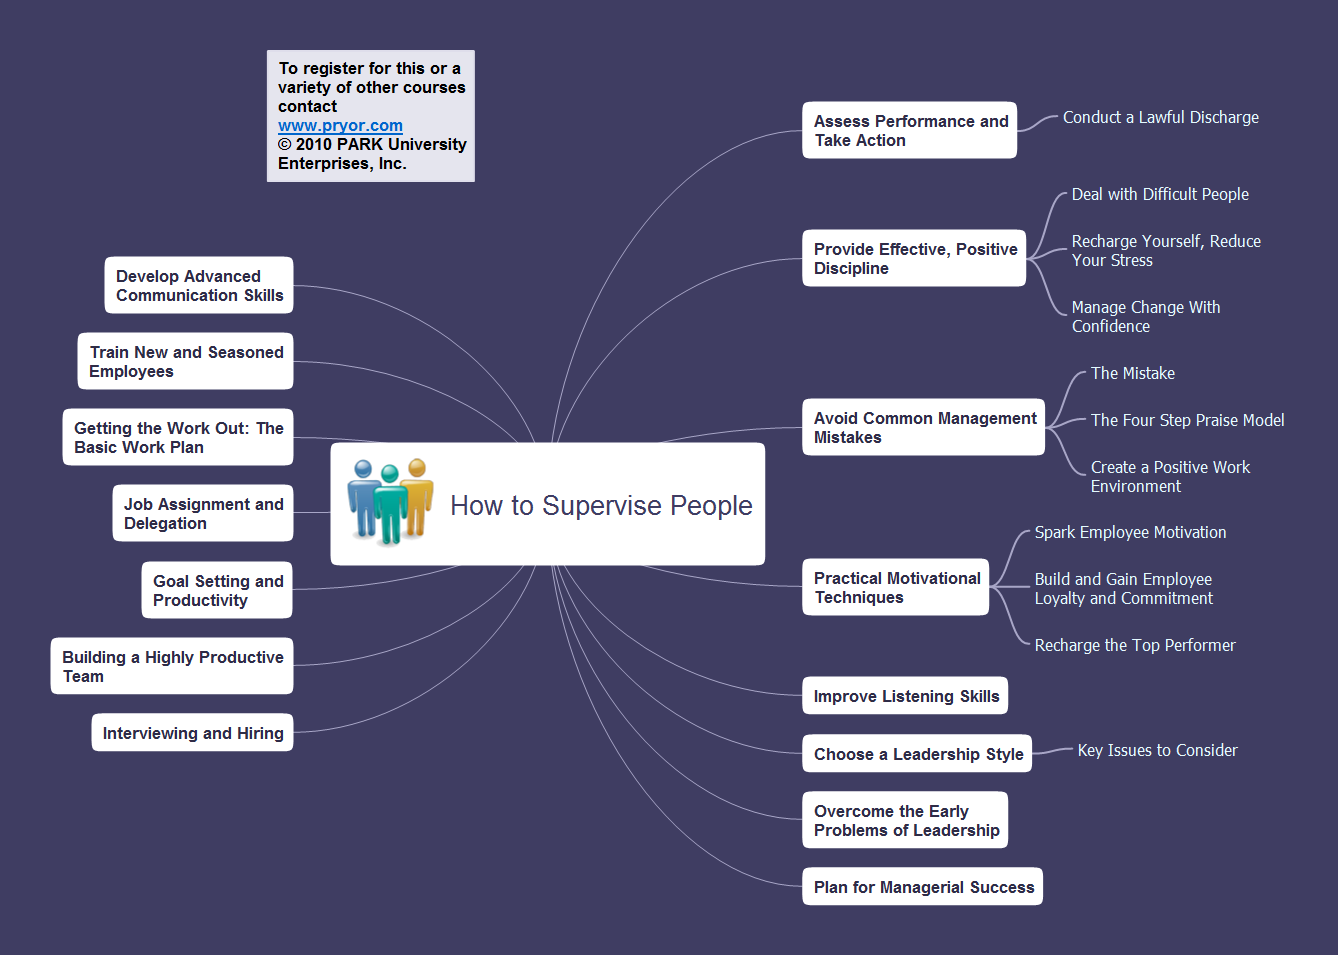
Picture: Presentation Preparation using Mind Maps
Related Solution:
Creating and organizing presentations, structuring received presentations, presenting mind maps, and preparing for public presenting.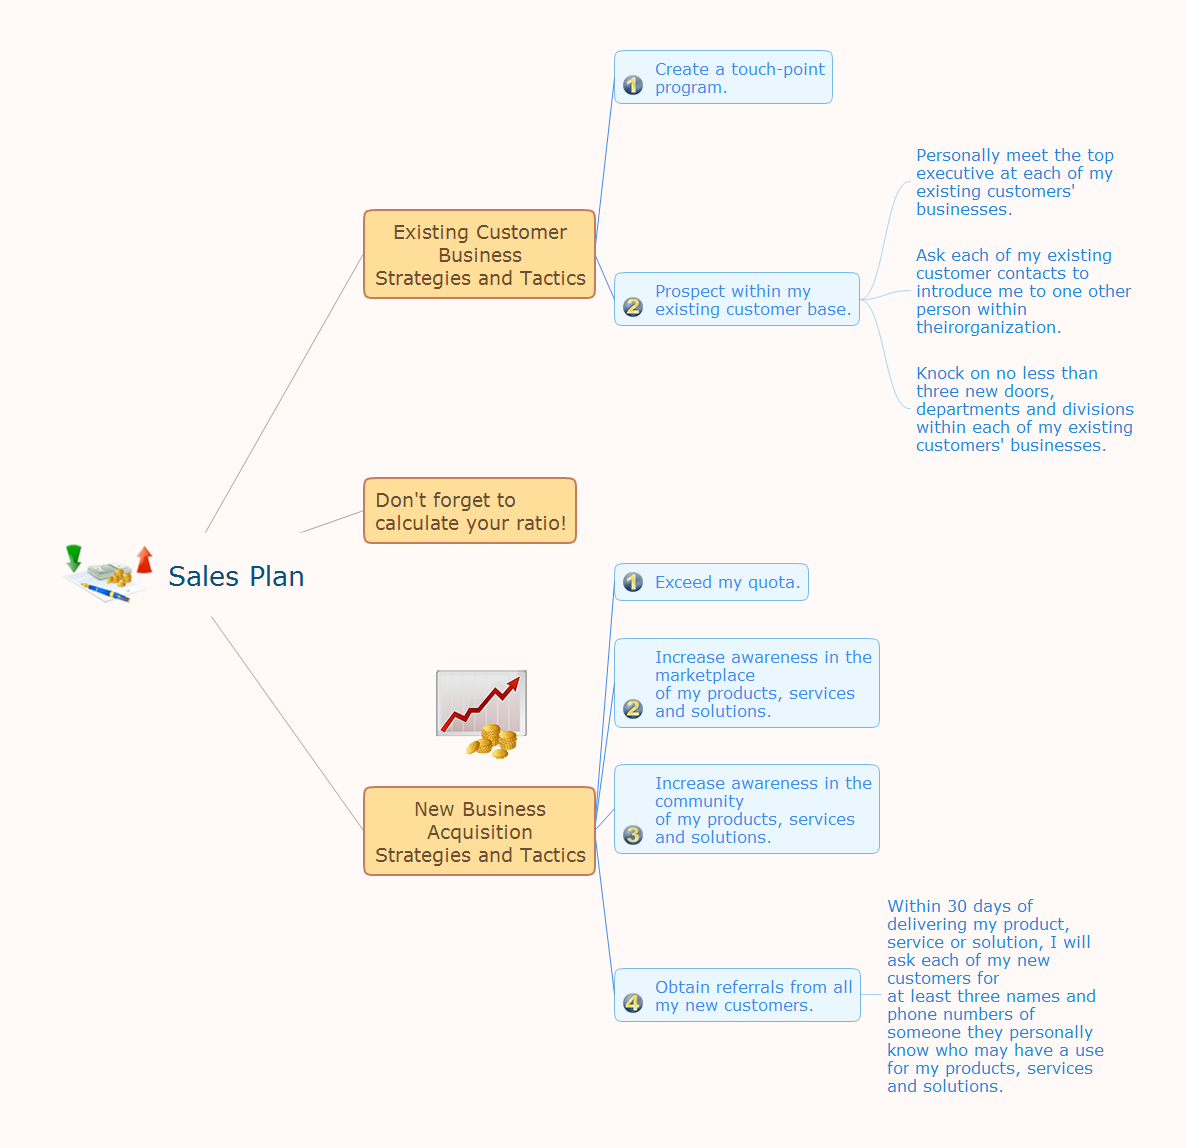
Picture: How to Deliver Presentations using Mind Maps
Related Solution:
Accounting Data Flow from the Accounting Flowcharts Solution visually describes the financial accounting process, shows the accumulated information about transactions and events for creating the balance sheet and the final income statement.
Accounting Flowcharts Solution contains also a wide variety of templates and samples that you can use as the base for your own Accounting Flowcharts of any complexity.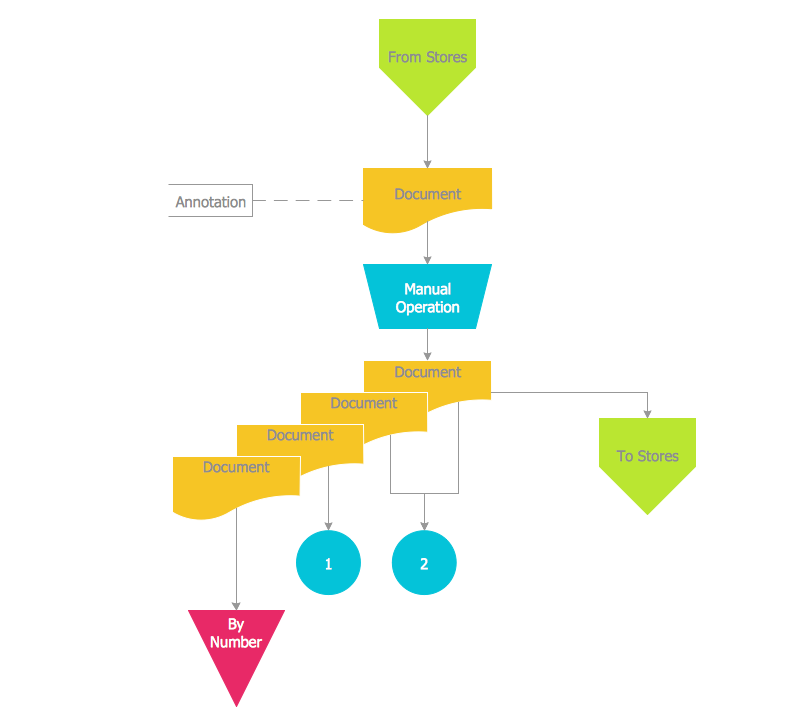
Picture: Accounting Data Flow from the Accounting Flowcharts Solution
Related Solution:
ConceptDraw DIAGRAM diagramming and vector drawing software supplied with Chemical and Process Engineering Solution from the Industrial Engineering Area of ConceptDraw Solution Park is powerful and effective process engineering software.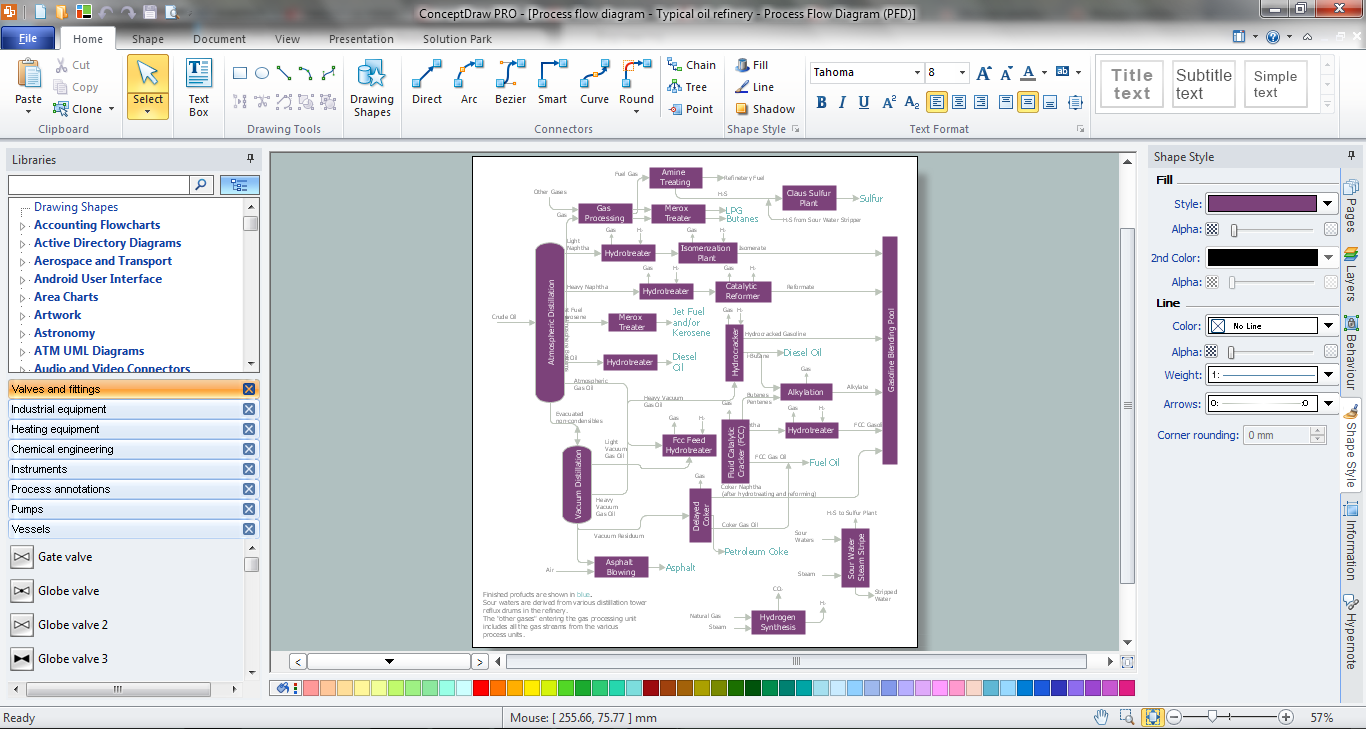
Picture: Process Engineering
Related Solution:
ConceptDraw MINDMAP the will guide you in creating and demonstrating powerful mind map presentations.
Picture: Program for Making Presentations
Related Solution:
Learning via presentations is used widely in education. This is a frequently used tool on trainings, especially for remote training via Skype.
Picture: How To Create Presentation for Trainings and Learning process
Related Solution:
ConceptDraw
DIAGRAM 18