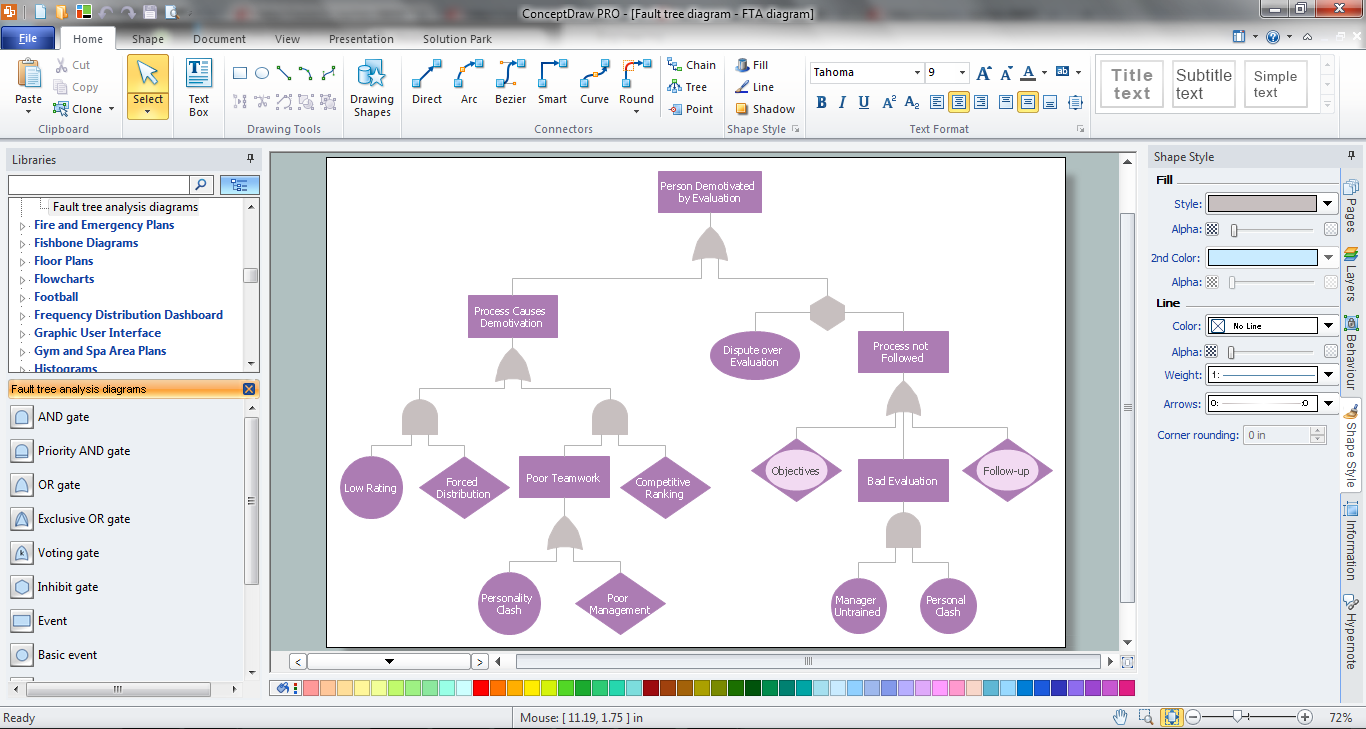
Example 1. Fault Tree Analysis Software
First of all, Fault Tree Analysis Diagrams Solution provides a set of samples which are the good examples of easy drawing professional looking Fault Tree Analysis Diagrams.

Example 2. Fault Tree Analysis Diagrams Solution in ConceptDraw STORE
All examples, samples, and templates included in Fault Tree Analysis Diagrams Solution for ConceptDraw DIAGRAM fault tree analysis software are available for viewing and editing from ConceptDraw STORE.
Fault Tree Analysis Diagrams symbols:
AND gate — The output event occurs if all input events occur.

Priority AND gate — The output event occurs if all input events occur in a specific sequence.

Inhibit gate — The input event occurs if all input events occur and an additional conditional event occurs.

Event

OR gate - The output event occurs if at least one of the input events occurs.

XOR gate - The output event occurs if exactly one input event occurs.

Voting gate - The output event occurs if k or more of the input events occur.

Basic event - A basic initiating fault (or failure event).

Undeveloped event — An event which is no further developed. It is a basic event that does not need further resolution.

House event — An event that is normally expected to occur. In general, these events can be set to occur or not occur, i.e. they have a fixed probability of 0 or 1.

Conditional event — A specific condition or restriction that can apply to any gate.

Transfer symbol — Indicates a transfer continuation to a sub tree.

Pay also attention for the Fault Tree Analysis Diagram library of predesigned vector elements. They will help design Fault Tree Diagrams without efforts.

Example 4. Fault Tree Analysis Diagram
The following features make ConceptDraw DIAGRAM the best Fault Tree Analysis Software:
- You don't need to be an artist to draw professional looking diagrams in a few minutes.
- Large quantity of ready-to-use vector objects makes your drawing diagrams quick and easy.
- Great number of predesigned templates and samples give you the good start for your own diagrams.
- ConceptDraw DIAGRAM provides you the possibility to use the grid, rules and guides. You can easily rotate, group, align, arrange the objects, use different fonts and colors to make your diagram exceptionally looking.
- All ConceptDraw DIAGRAM documents are vector graphic files and are available for reviewing, modifying, and converting to a variety of formats: image, HTML, PDF file, MS PowerPoint Presentation, Adobe Flash, MS Visio.
- Using ConceptDraw STORE you can navigate through ConceptDraw Solution Park, managing downloads and updates. You can access libraries, templates and samples directly from the ConceptDraw STORE.
- If you have any questions, our free of charge support is always ready to come to your aid.
TEN RELATED HOW TO's:
Nowadays, a constructor needs skills in various areas. For instance, knowing How To use Appliances Symbols for Building Plan, can be useful in developing illustrations for customers. Aware means armed.
This image shows the content of the Appliances library that is a component of the ConceptDraw Floor Plans solution. Being used with ConceptDraw DIAGRAM drawing facilities, this library allows you to create floor plan and interior design for your new family residence and its, undoubtedly the most important section such as kitchen and bathroom. As considering your kitchen arrangement and developing the properly variant for your apartment, one of the main points is the complete layout of the kitchen and its appliances. The vector graphical objects supplied with ConceptDraw Floor plans solution by allows you easily display the most original ideas of kitchen and bathroom layout.
Picture: How To use Appliances Symbols for Building Plan
Related Solution:
Drawing an electric circuit plan with all the wiring might seem very complex. If you ever felt afraid to ask how to use electrical and telecom plan software, then it’s time to actually start from altering the templates from the Solution Park. You won’t even notice the moment when you would become an experienced user.
This electrical and telecommunication floor plan plan presents electrical and telecommunication devices located in a country house floor plan. Each electrical or telecom device on this plan is indicated with the particular symbol. Using standard Electrical and Telecommunication symbols makes this floor plan clear for anybody who will be involved into construction process. All the electrical and telecom symbols used in the current floor plan are placed to a legend. This electrical and telecom floor plan can be included as a separate piece into a package of building documentation.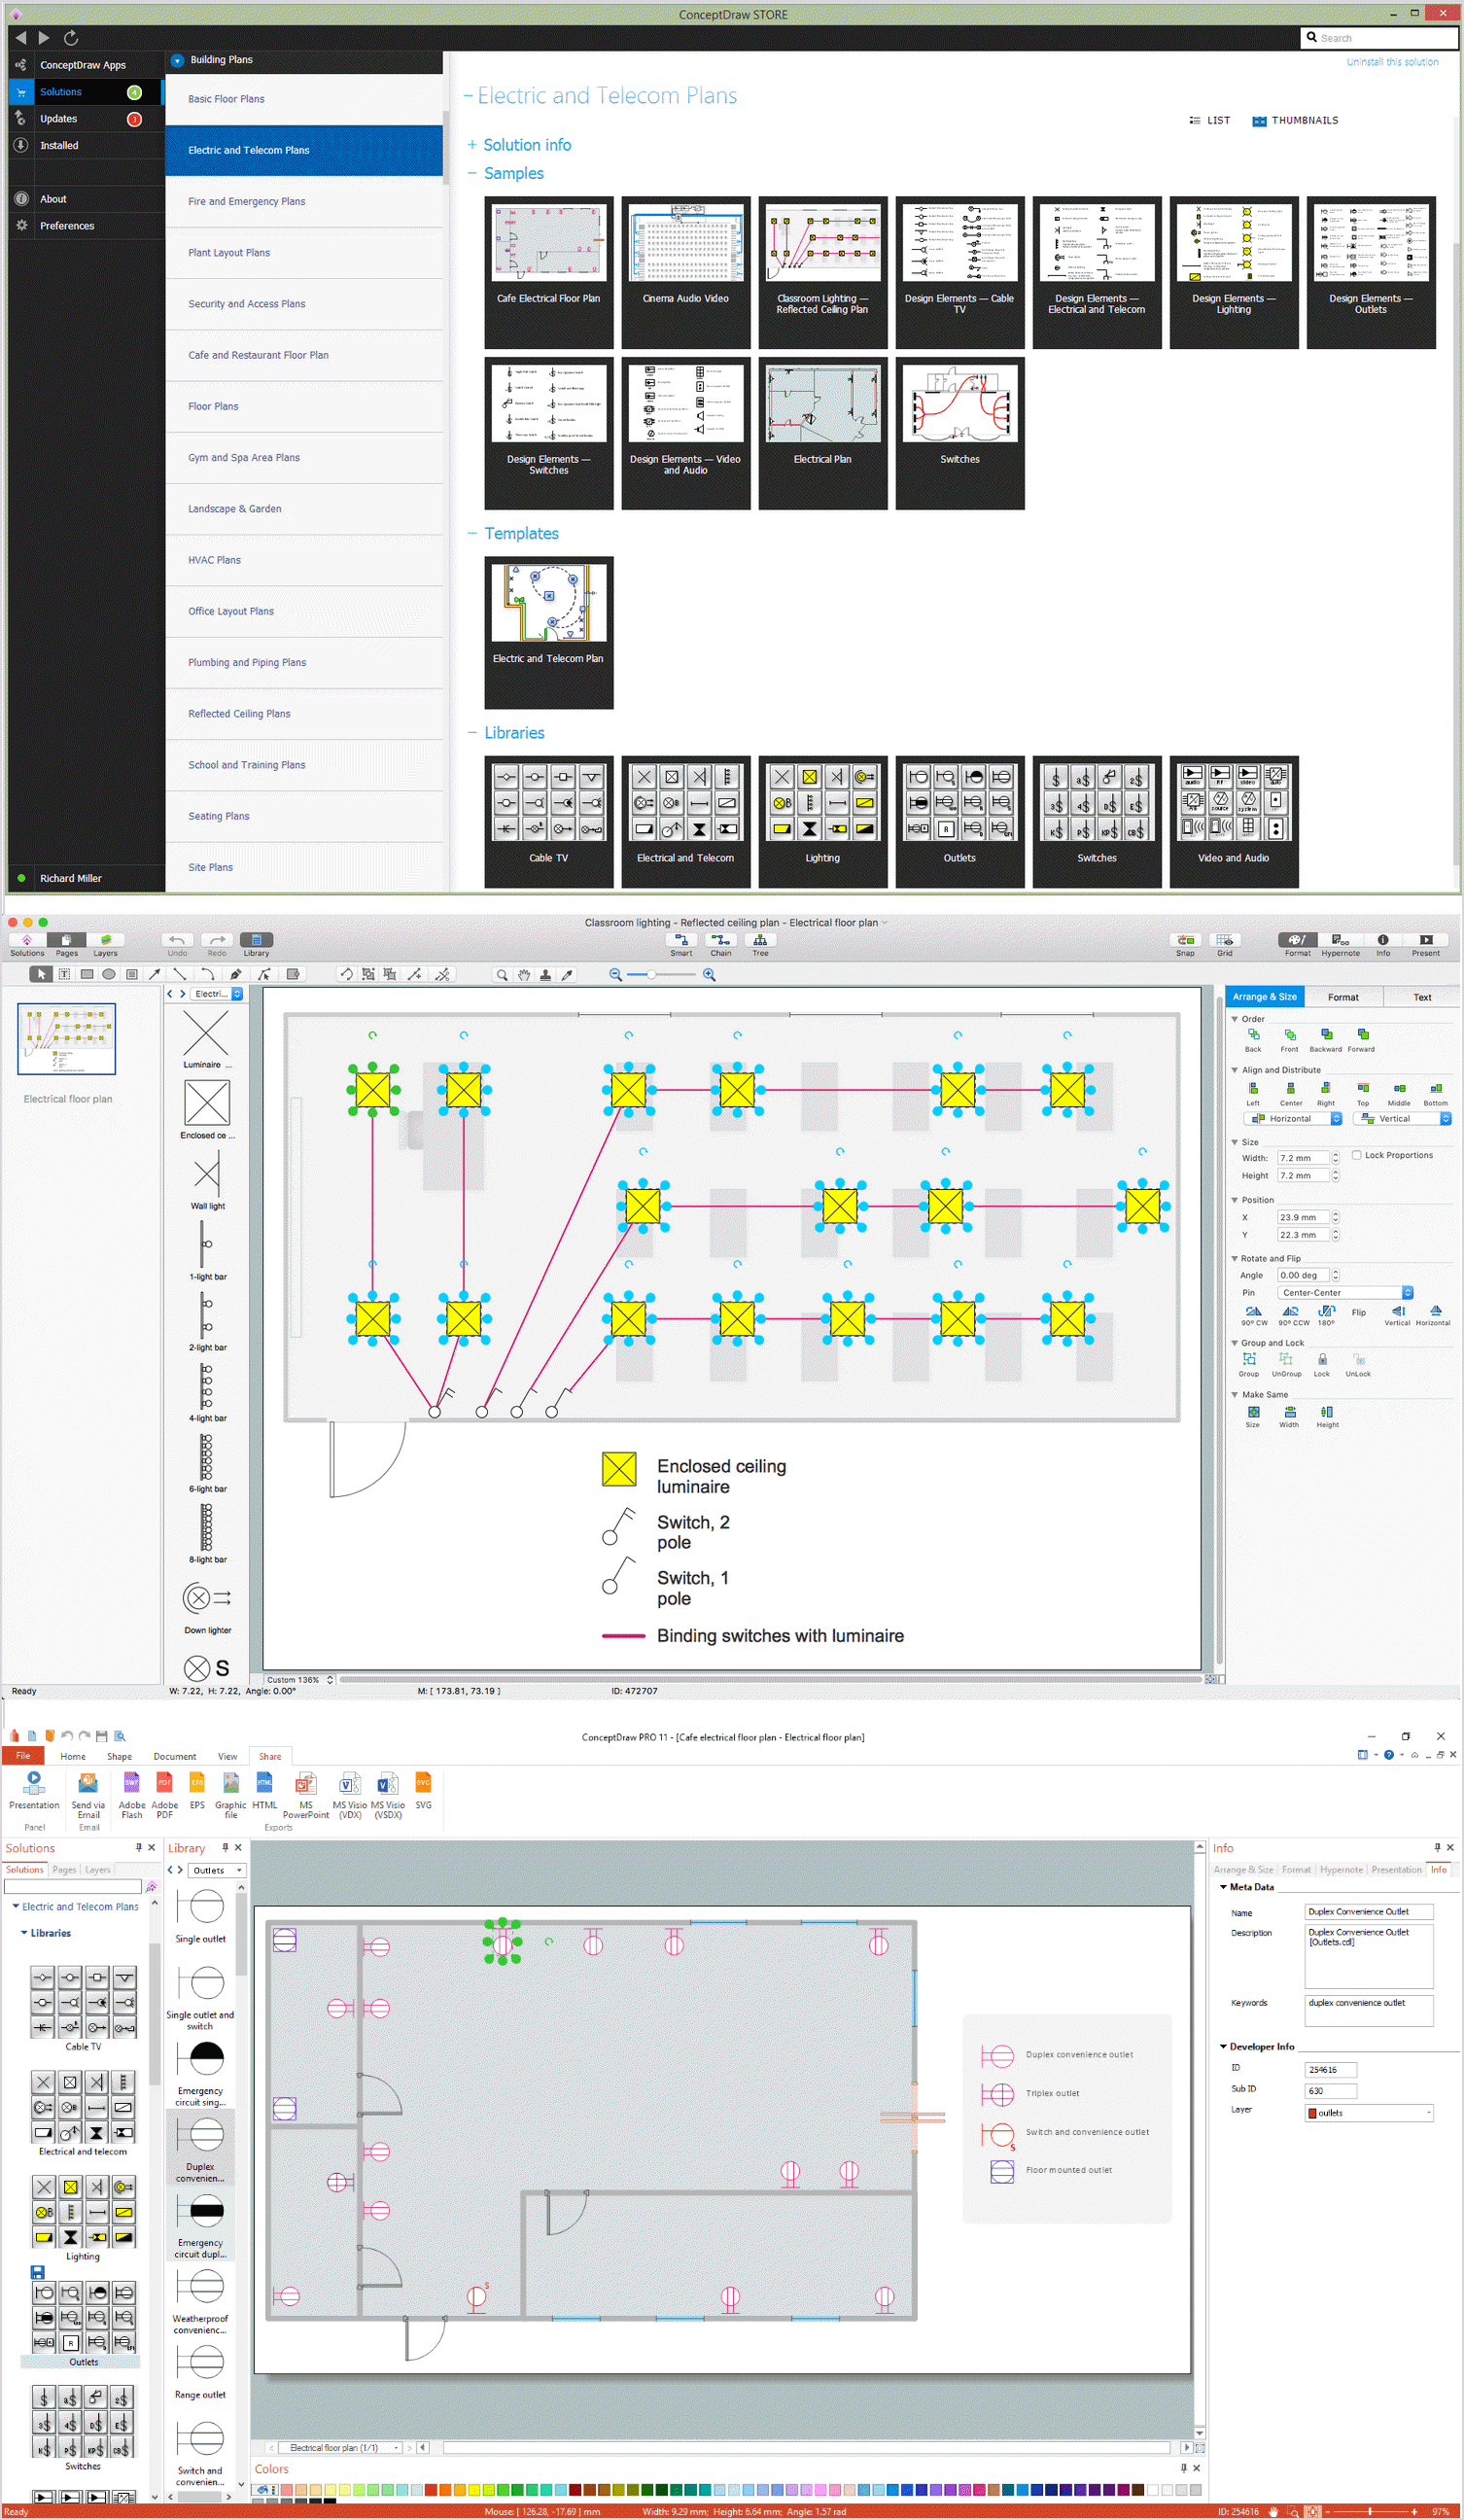
Picture: How To use Electrical and Telecom Plan Software
Related Solution:
How to create a Residential Electric Plan quick and easy? The simplest way is to use the tools of ConceptDraw DIAGRAM software extended with Electric and Telecom Plans Solution.
Picture: Residential Electric Plan
Related Solution:
This sample shows the UML Class Diagram that was created in ConceptDraw DIAGRAM on the Mac and then was opened for editing in MS Visio.
Using the 13 libraries of the Rapid UML Solution for ConceptDraw DIAGRAM you can create your own visual vector UML diagrams quick and easy.
Picture: UML Diagram Visio
Related Solution:
Learn what a workflow diagram is, how it works, when to use it, and how to create one. See examples, handoffs, approval flows, and workflow diagram best practices.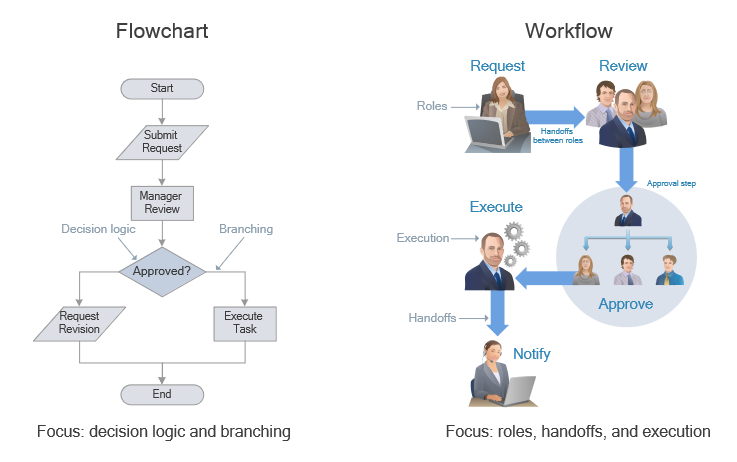
Picture: Workflow Diagram: Definition, Examples, and How to Create
Related Solution:
Internal auditing is an independent, objective assurance and consulting activity designed to add value and improve an organization's operations.
ConceptDraw DIAGRAM diagramming and vector drawing software extended with Audit Flowcharts solution from the Finance and Accounting area perfectly suits for the Internal Audit Process. You can make sure this right now!
Picture: Internal Audit Process
Related Solution:
Sequence Diagrams shows how objects communicate with each other in terms of a sequence of messages. Also indicates the lifespans of objects relative to those messages.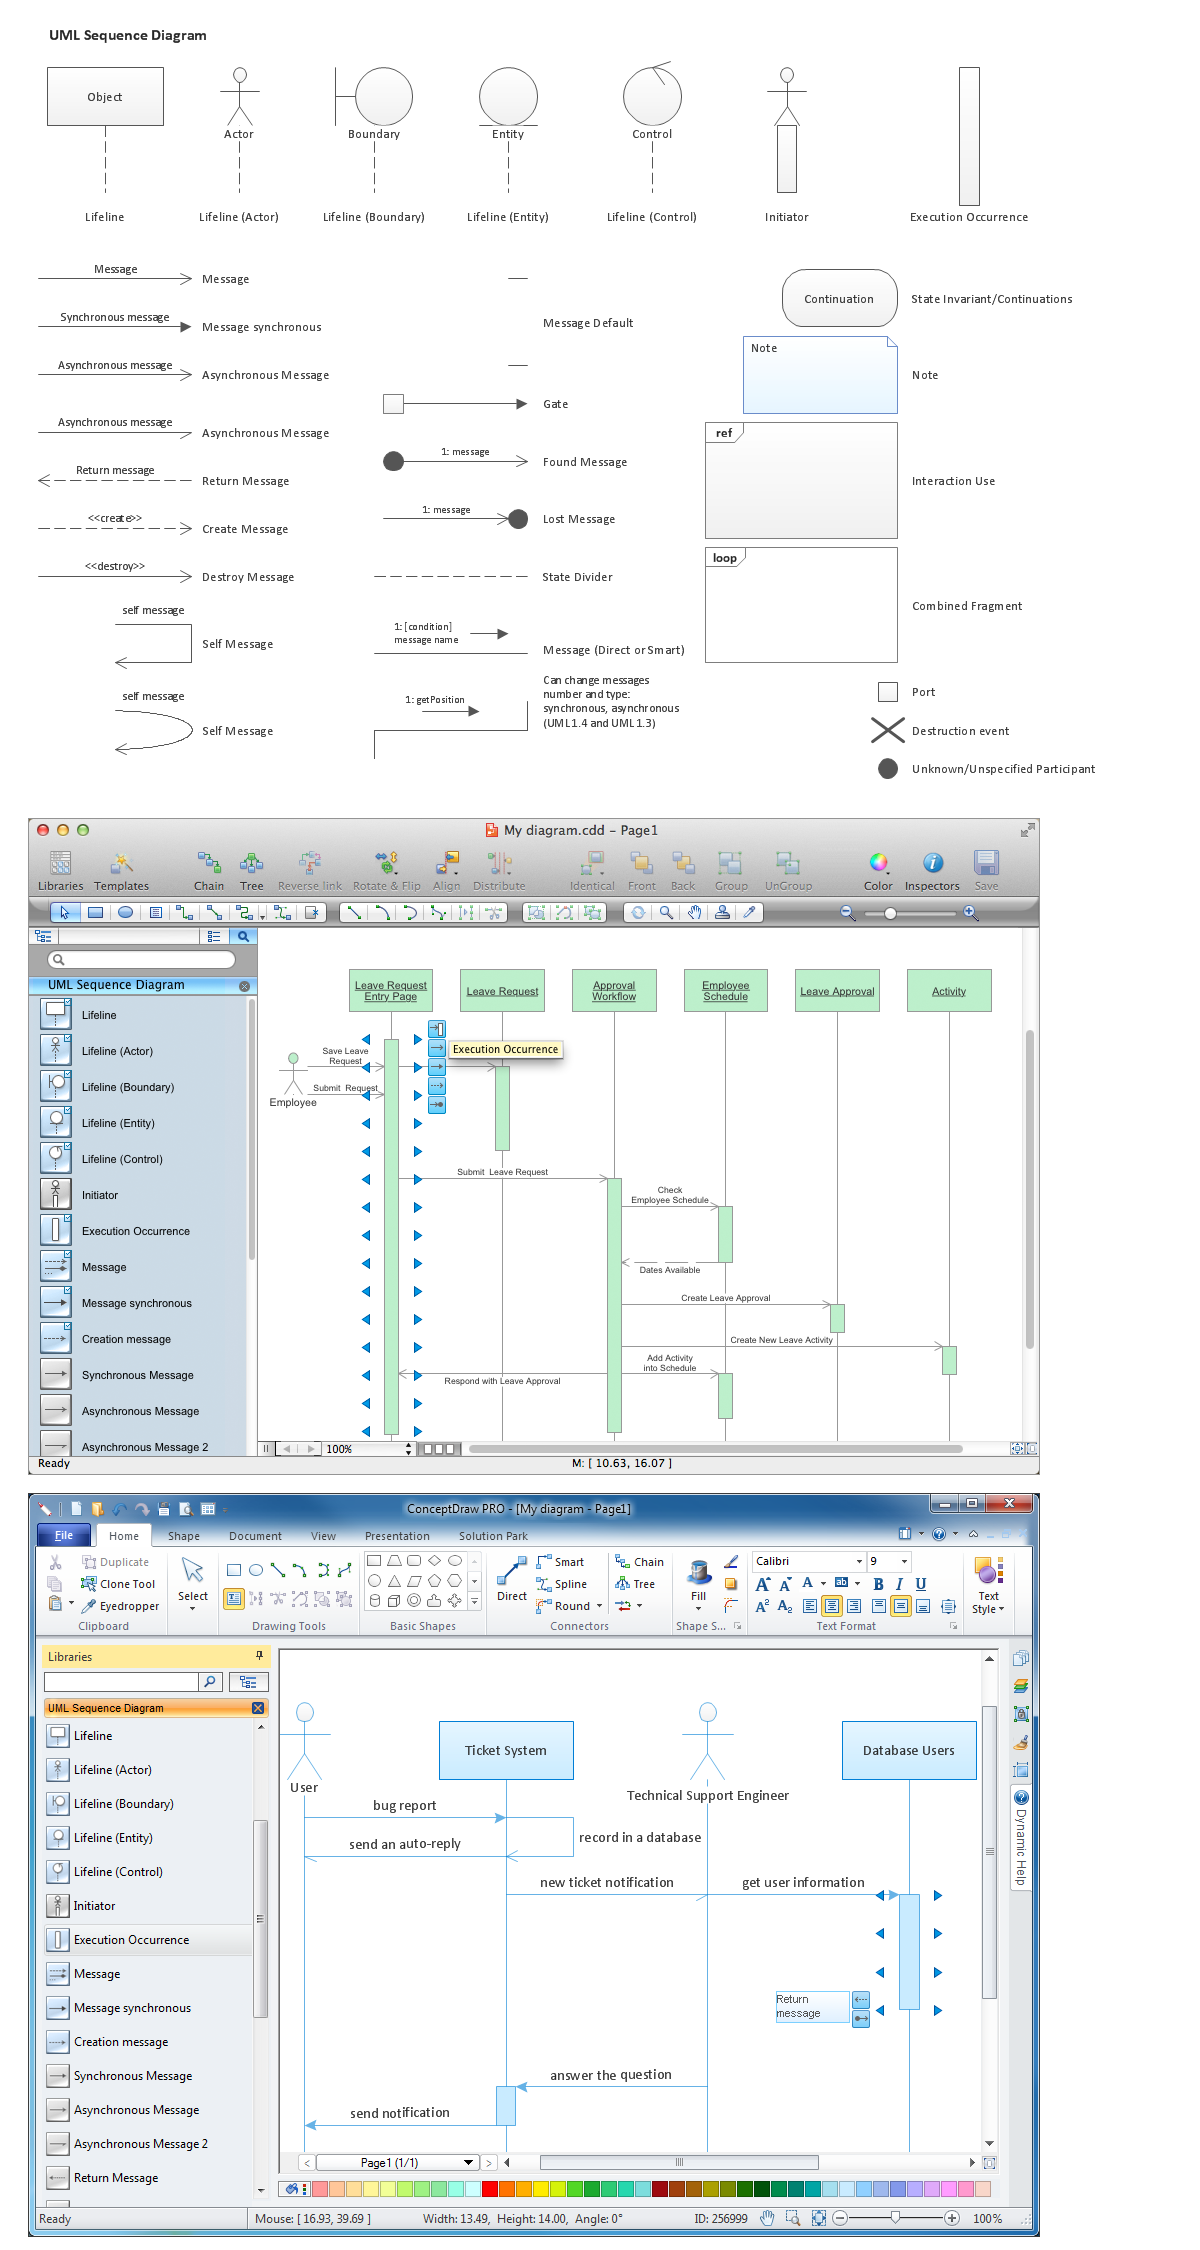
Picture: Diagramming Software for designing UML Sequence Diagrams
Every corporate network is unique, though there are guidelines and best practices in developing networks. As it is quite difficult to implement a pure topology within a company, using a hybrid network topology is considered a better solution. As a rule, such network assembles advantages and features of source topologies.
This diagram is an example of the Hybrid network. This type of network topology means a conjunction of other network topologies. Such as star-bus, ring-mesh topologies, etc. It should be obviously diverse networks. The final computer network inherits both advantages and disadvantages of its ingredients. Using the ConceptDraw Computer and Networks solution including vector graphic libraries and templates one can develop professional custom network diagrams of any topology and complexity.
Picture: Hybrid Network Topology
Related Solution:
Opens your mind map as a SWOT Matrix in ConceptDraw DIAGRAM, allowing you to use the presentation capabilities of ConceptDraw DIAGRAM to report and discuss the results of the analysis, as well as export to graphics file(s) or MS PowerPoint.
Picture: SWOT Matrix Blue Theme
Related Solution:
Functional modeling allows to make complex business processes simple. One of the basic methods is IDEF0 and one of the most effective also. To create a business model, use flowchart symbols.
The IDEF0 library, supplied with ConceptDraw IDEF0 Diagrams solution contains 18 IDEF0 basic notation symbols. All symbols are the vector graphic images what means, that one can customize their size preserving the stable quality. Another library of IDEF0 symbols can be find out in the the Business Process Diagrams solution, included to the Business Processes section of ConceptDraw Solution Park. These libraries composed from just vector objects and are totally compatible. You can apply the IDEF0 symbols from both libraries at your flowcharts, if needed.
Picture: IDEF0 Flowchart Symbols
Related Solution:

