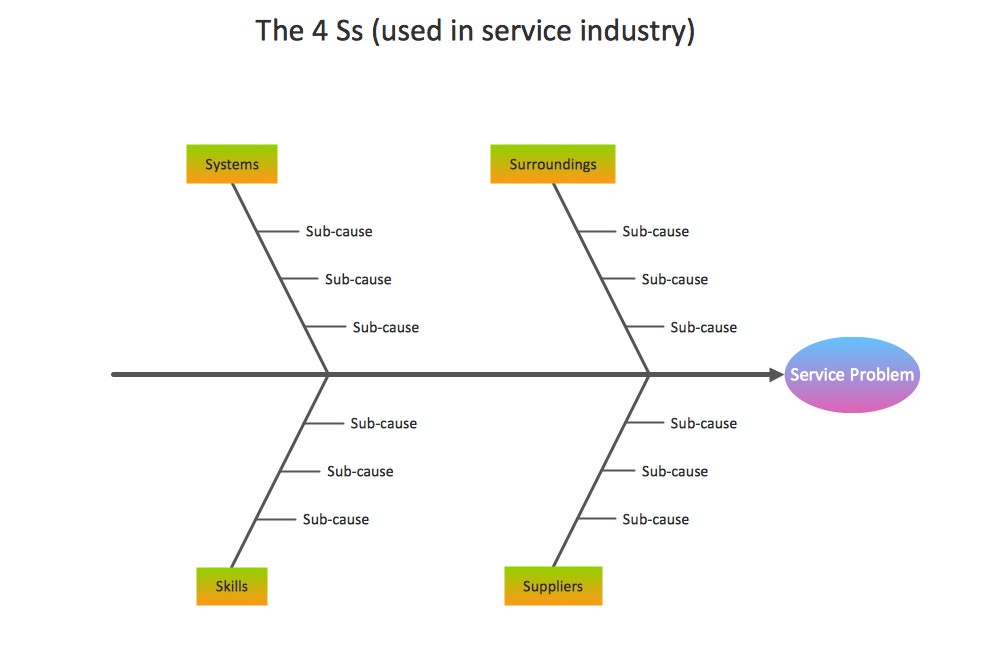
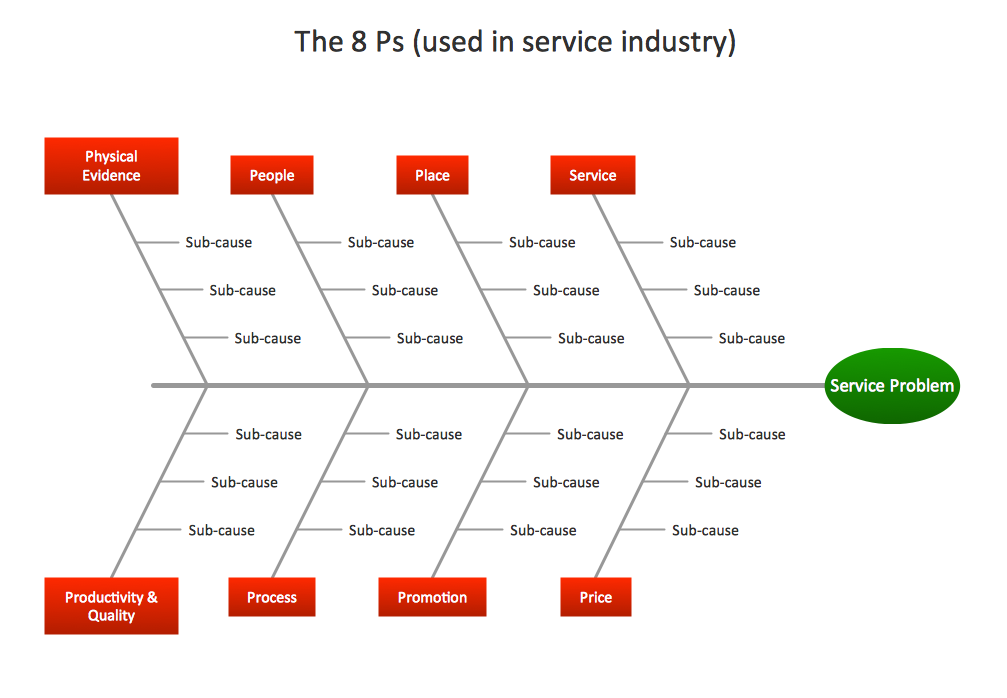
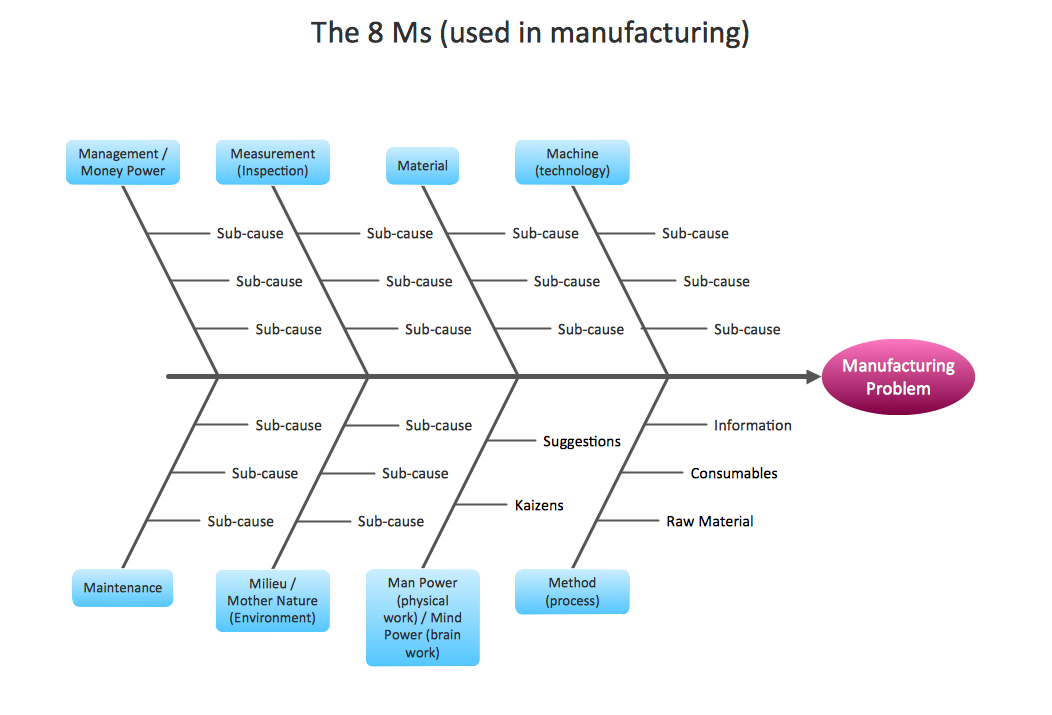
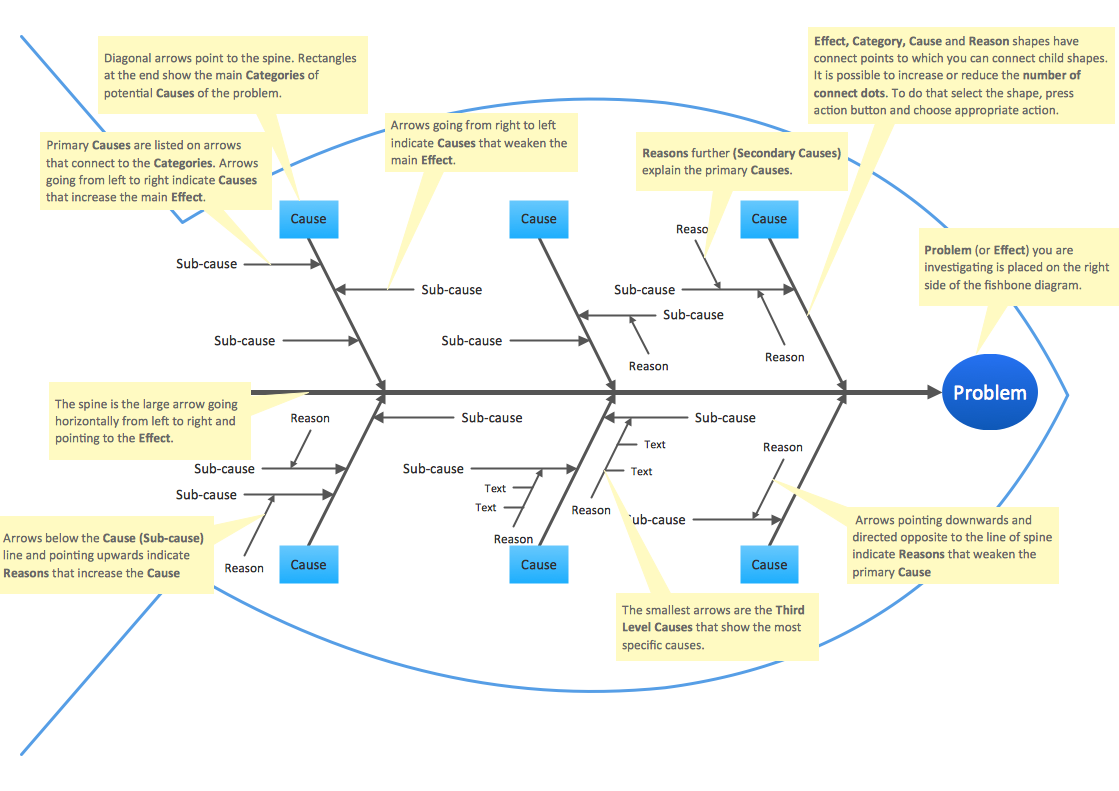
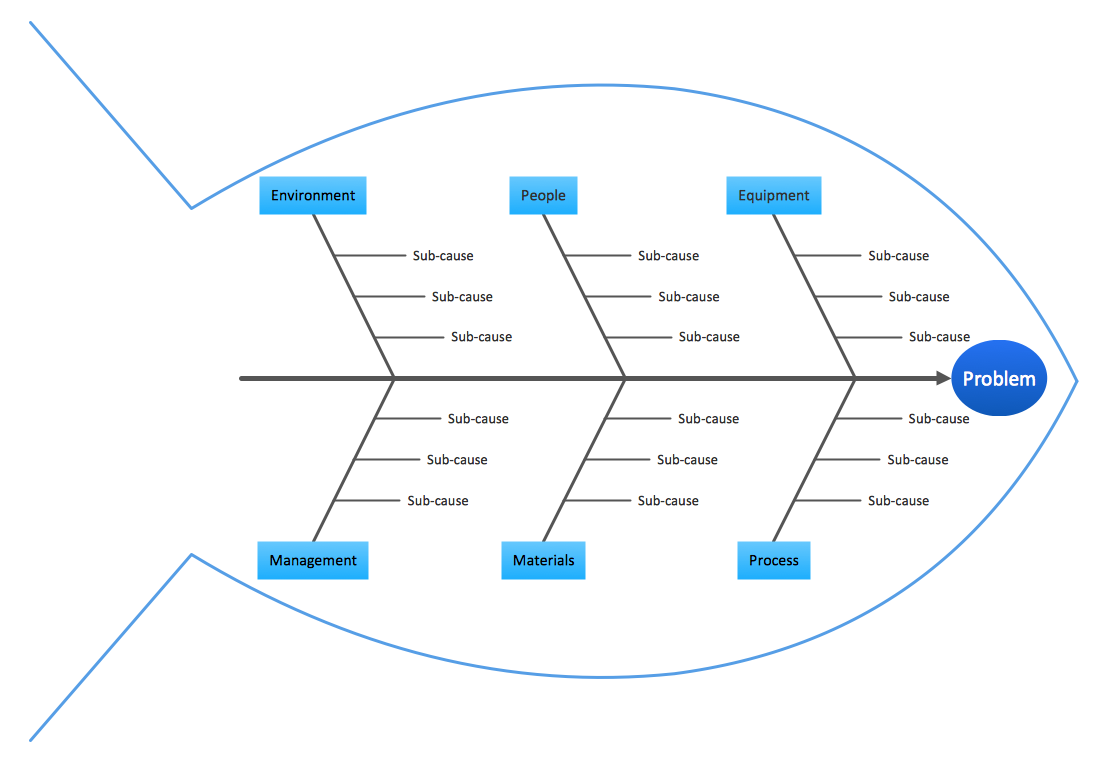
Example 1. Fishbone Diagram Procedure
Fishbone Diagrams Solution helps design Cause and Effect diagram fast and easy thanks to the included Fishbone Diagrams library full of predesigned vector objects and collection of quick-start templates offered at your disposal at ConceptDraw STORE.
There are also included templates for ConceptDraw MindMap software, designing your Fishbone diagram using them you can then easy output it to ConceptDraw DIAGRAM
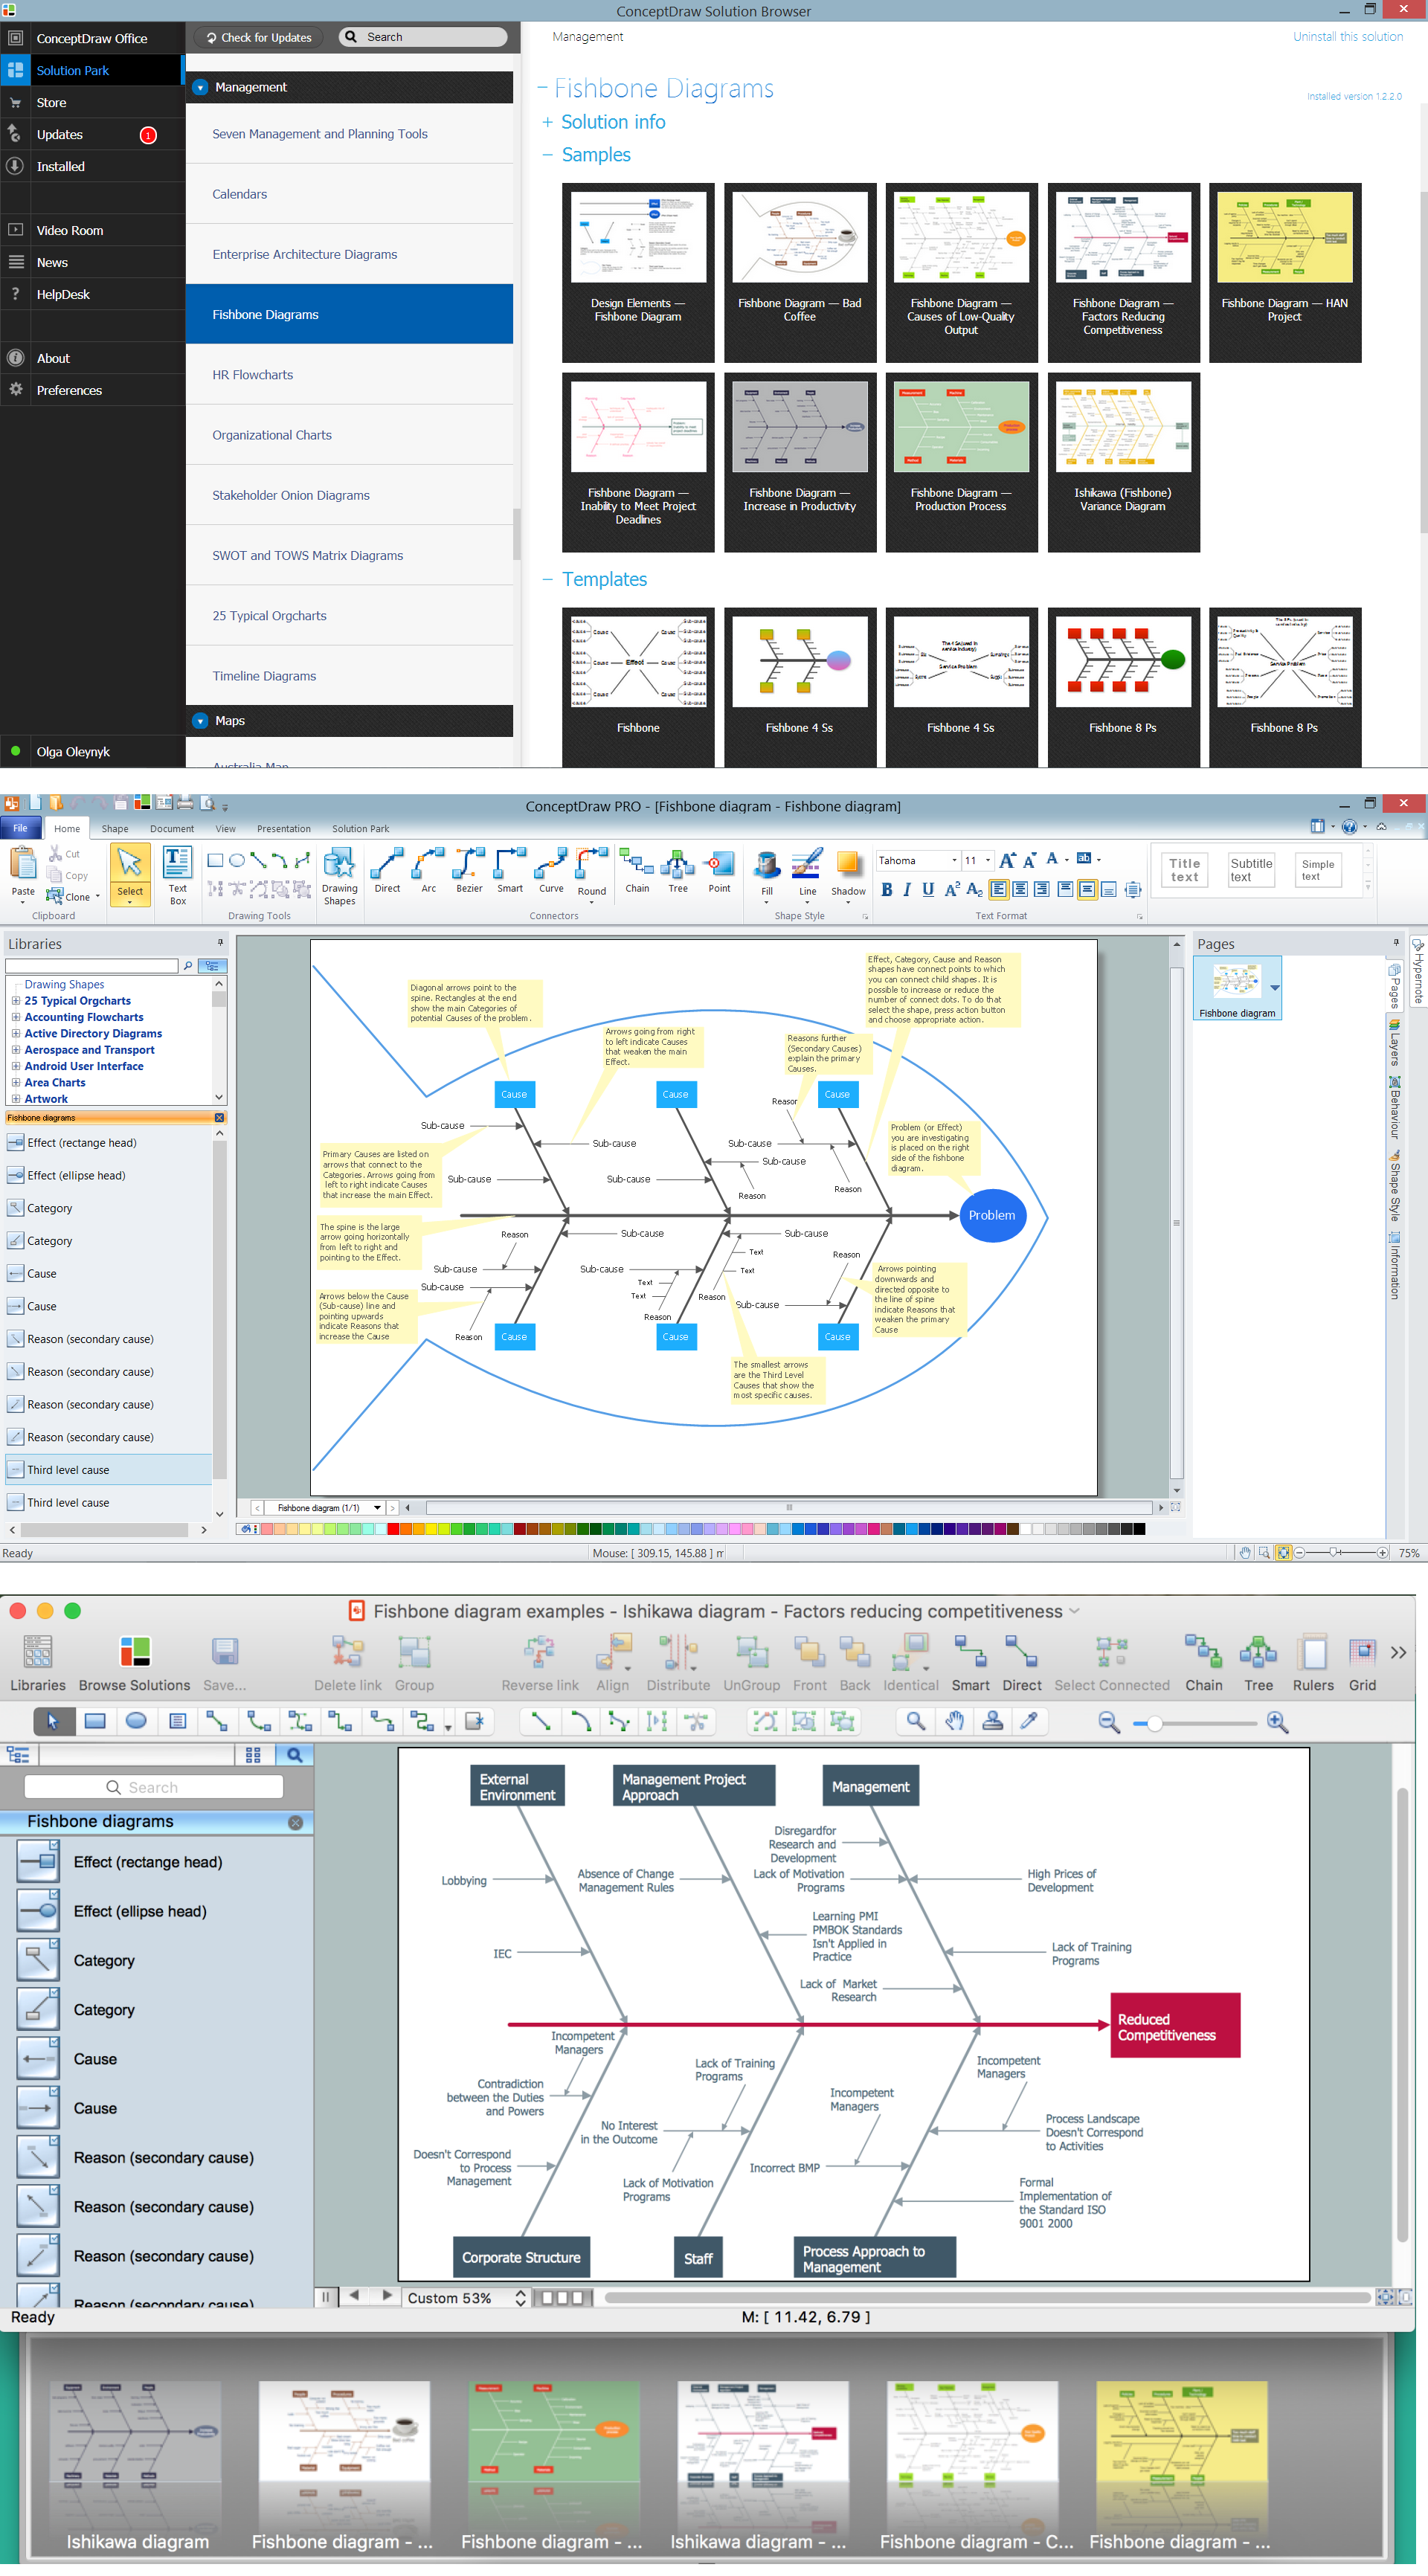
Pay also attention for the collection of Fishbone Diagram samples, all they are professional-looking and attractive, and confirm the words about the ease of performing fishbone diagram procedure of creation in ConceptDraw program.

Example 2. Fishbone Diagram - Templates and Samples (Win, Mac)
The samples and templates you see on this page were created in ConceptDraw DIAGRAM using the tools of Fishbone Diagrams Solution. An experienced user spent 5-10 minutes creating each of them.
Use the Fishbone Diagrams Solution for ConceptDraw DIAGRAM Solution Park and fishbone diagram procedure to draw quick and easy your own Fishbone Diagrams and Ishikawa diagrams for cause and effect analysis.
All source documents are vector graphic documents. They are available for reviewing, modifying, or converting to a variety of formats (PDF file, MS PowerPoint, MS Visio, and many other graphic formats) from the ConceptDraw STORE. The Fishbone Diagrams Solution is available for all ConceptDraw DIAGRAM or later users.
TEN RELATED HOW TO's:
There are many ways to describe a database structure. One of the most usual is to draw an entity relationship diagram (ERD) using a Crow’s Foot notation to represent database elements. If you don’t want to draw it on paper, you should use an appropriate software.
An entity-relationship (ER) diagram is used to show the structure of a business database. ERD represents data as objects (entities) that are connected with standard relationships symbols which Illustrate an association between entities. ERD, there is a wide range of ERD notations used by data bases architects for reflecting the relationships between the data entities. According to the crow’s foot notation relationships are drawn as single labeled lines designating a certain kinds of relationship. Crow foot notation is a most frequently used ERD standard, because of improved readability of diagrams, with a more accurate use of space on the page._Win_Mac.png)
Picture: Entity Relationship Diagram - ERD - Software for Design Crows Foot ER Diagrams
Related Solution:
This mind map demonstrates how the well-known Total Quality Management (TQM) methodology can be presented in a mind map. Using mind mapping for quality management is a creative approach that allows one to structure all key quality points on the one page.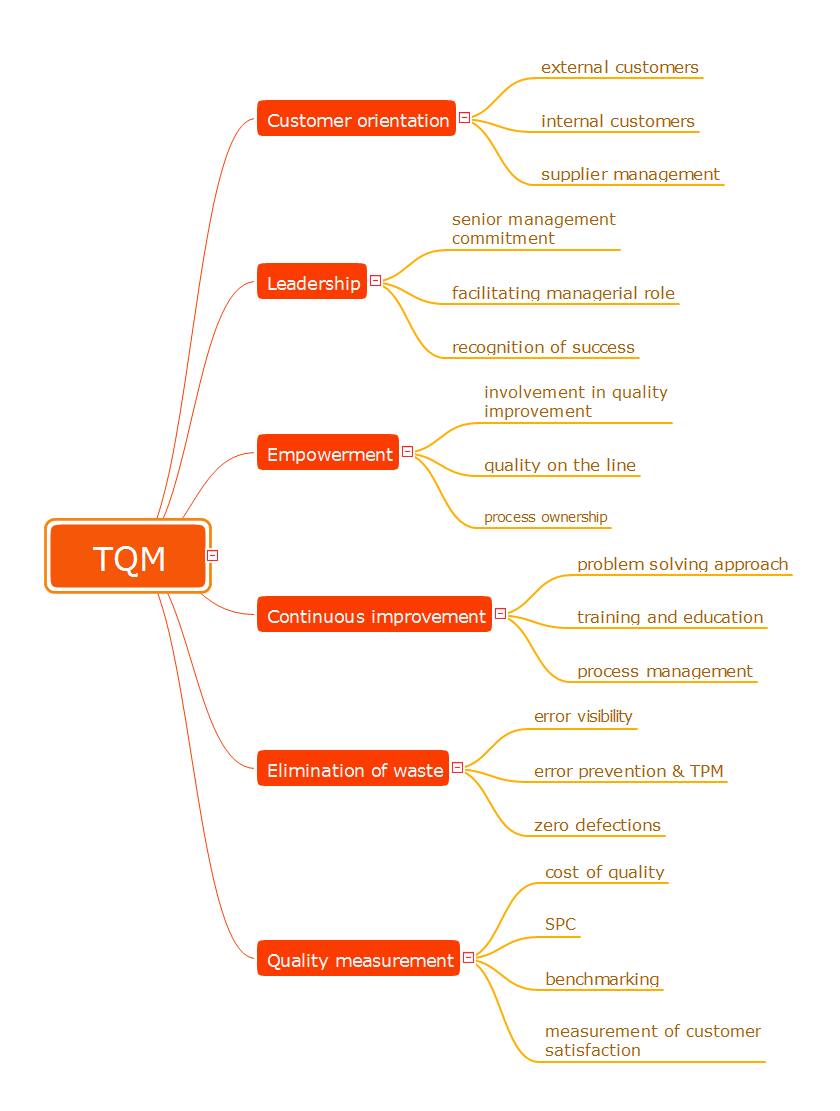
Picture: Total Quality Management
Related Solution:
Auditing Process, Audit Planning Process - The audit is complex process of independent examination of data, statements, operations, financial performances of an enterprise for a stated purpose. The auditing process consists of defined quantity of audit steps. Planning is fundamental stage of auditing process. The carefully thought-out audit planning process ensures the success of the business project.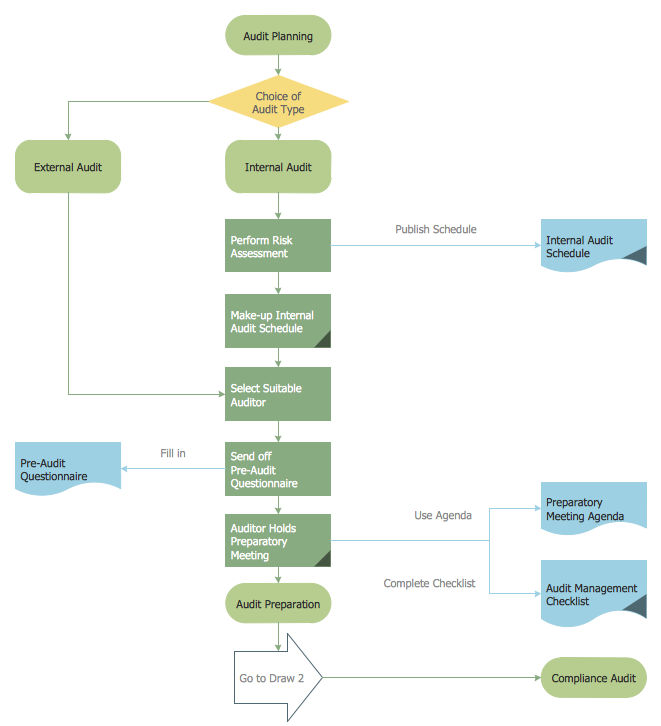
Picture: Auditing Process. Audit Planning Process
Related Solution:
Event-Driven Process Chain Diagrams for improvement throughout an organisation.
ConceptDraw DIAGRAM - software that reduces the time needed to create a business process model.
Picture: EPC for Configuring an Enterprise Resource Planning
Related Solution:
Circular Diagram is a type of diagram widely used in marketing and economics for visualization information in a clear and visual form. ConceptDraw DIAGRAM diagramming and vector drawing software offers the useful tools of the Target and Circular Diagrams solution from the Marketing area of ConceptDraw Solution Park for effective drawing a Circular Diagram of any complexity and design.
Picture: Circular Diagram
Related Solution:
The Total Quality Management Diagram solution helps you and your organization visualize business and industrial processes. Create Total Quality Management diagrams for business process with ConceptDraw software.
Picture: TQM Diagram — Professional Total Quality Management
Related Solution:
The calendars around us everywhere in the modern world. There are a lot of calendar types, each of them has its own assignment: Business calendar, Personal calendar, Economic calendar, Financial calendar, Daily calendar, Monthly calendar, and many other useful calendar types. ConceptDraw DIAGRAM offers you the possibility to make your own unique calendars on the base of the Blank Calendar Template which is included to the Calendars Solution from the Management Area.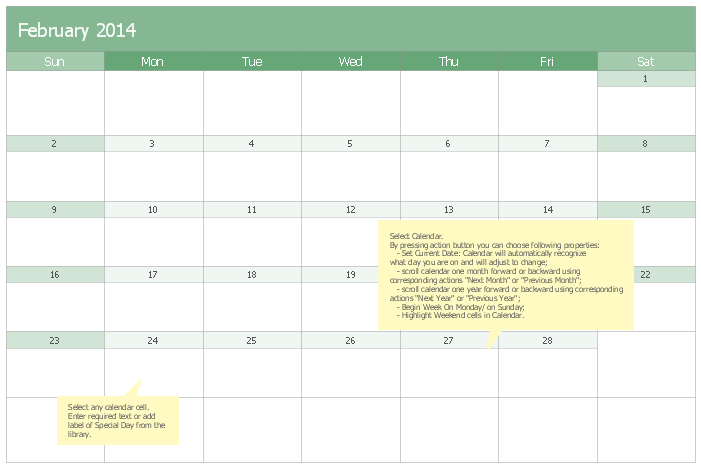
Picture: Blank Calendar Template
Related Solution:
ConceptDraw DIAGRAM diagramming and vector drawing software extended with tools of Flowcharts Solution from the Diagrams Area of ConceptDraw Solution Park ideally suits for fast and easy Online Flow Chart designing. We propose to verify this right now.
Picture: Online Flow Chart
Related Solution:
Tips on how to make an accounting flowchart. Describing methods and symbols that are used to represent the accounting system.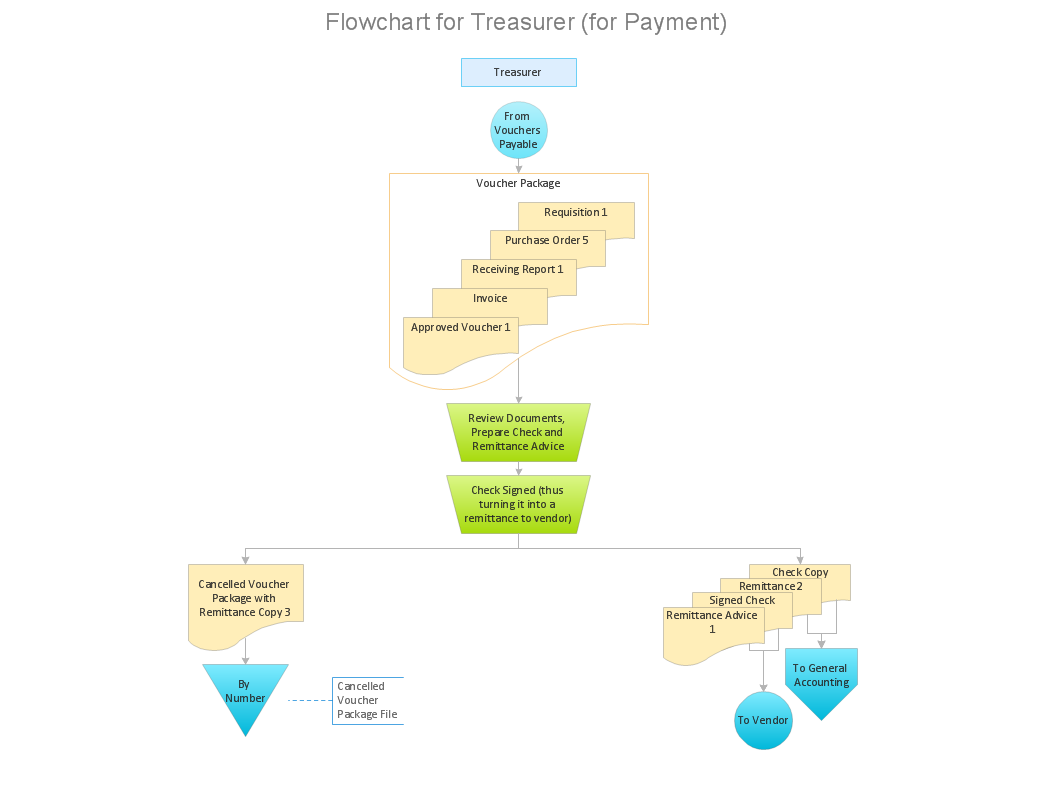
Picture: How to Make an Accounting Process Flowchart
Related Solution:
There are plenty of diagramming tools, the question is to choose the most suitable for your needs. For example, you can choose ConceptDraw DIAGRAM as organizational chart software and get fascinating results in a few minutes. An orgchart is useful for any corporation.
This is an example of a hierarchical organization scheme of the company. It has tree-like structure. Each middle manager is subordinated to a few employees, and he is accountable to one of the top managers. Every type of organizational composition of businesses may be presented in the view of an organizational chart that is supported by ConceptDraw Organisational Charts solution. There are number of ways of building a structure of business organization, establishing how it should function.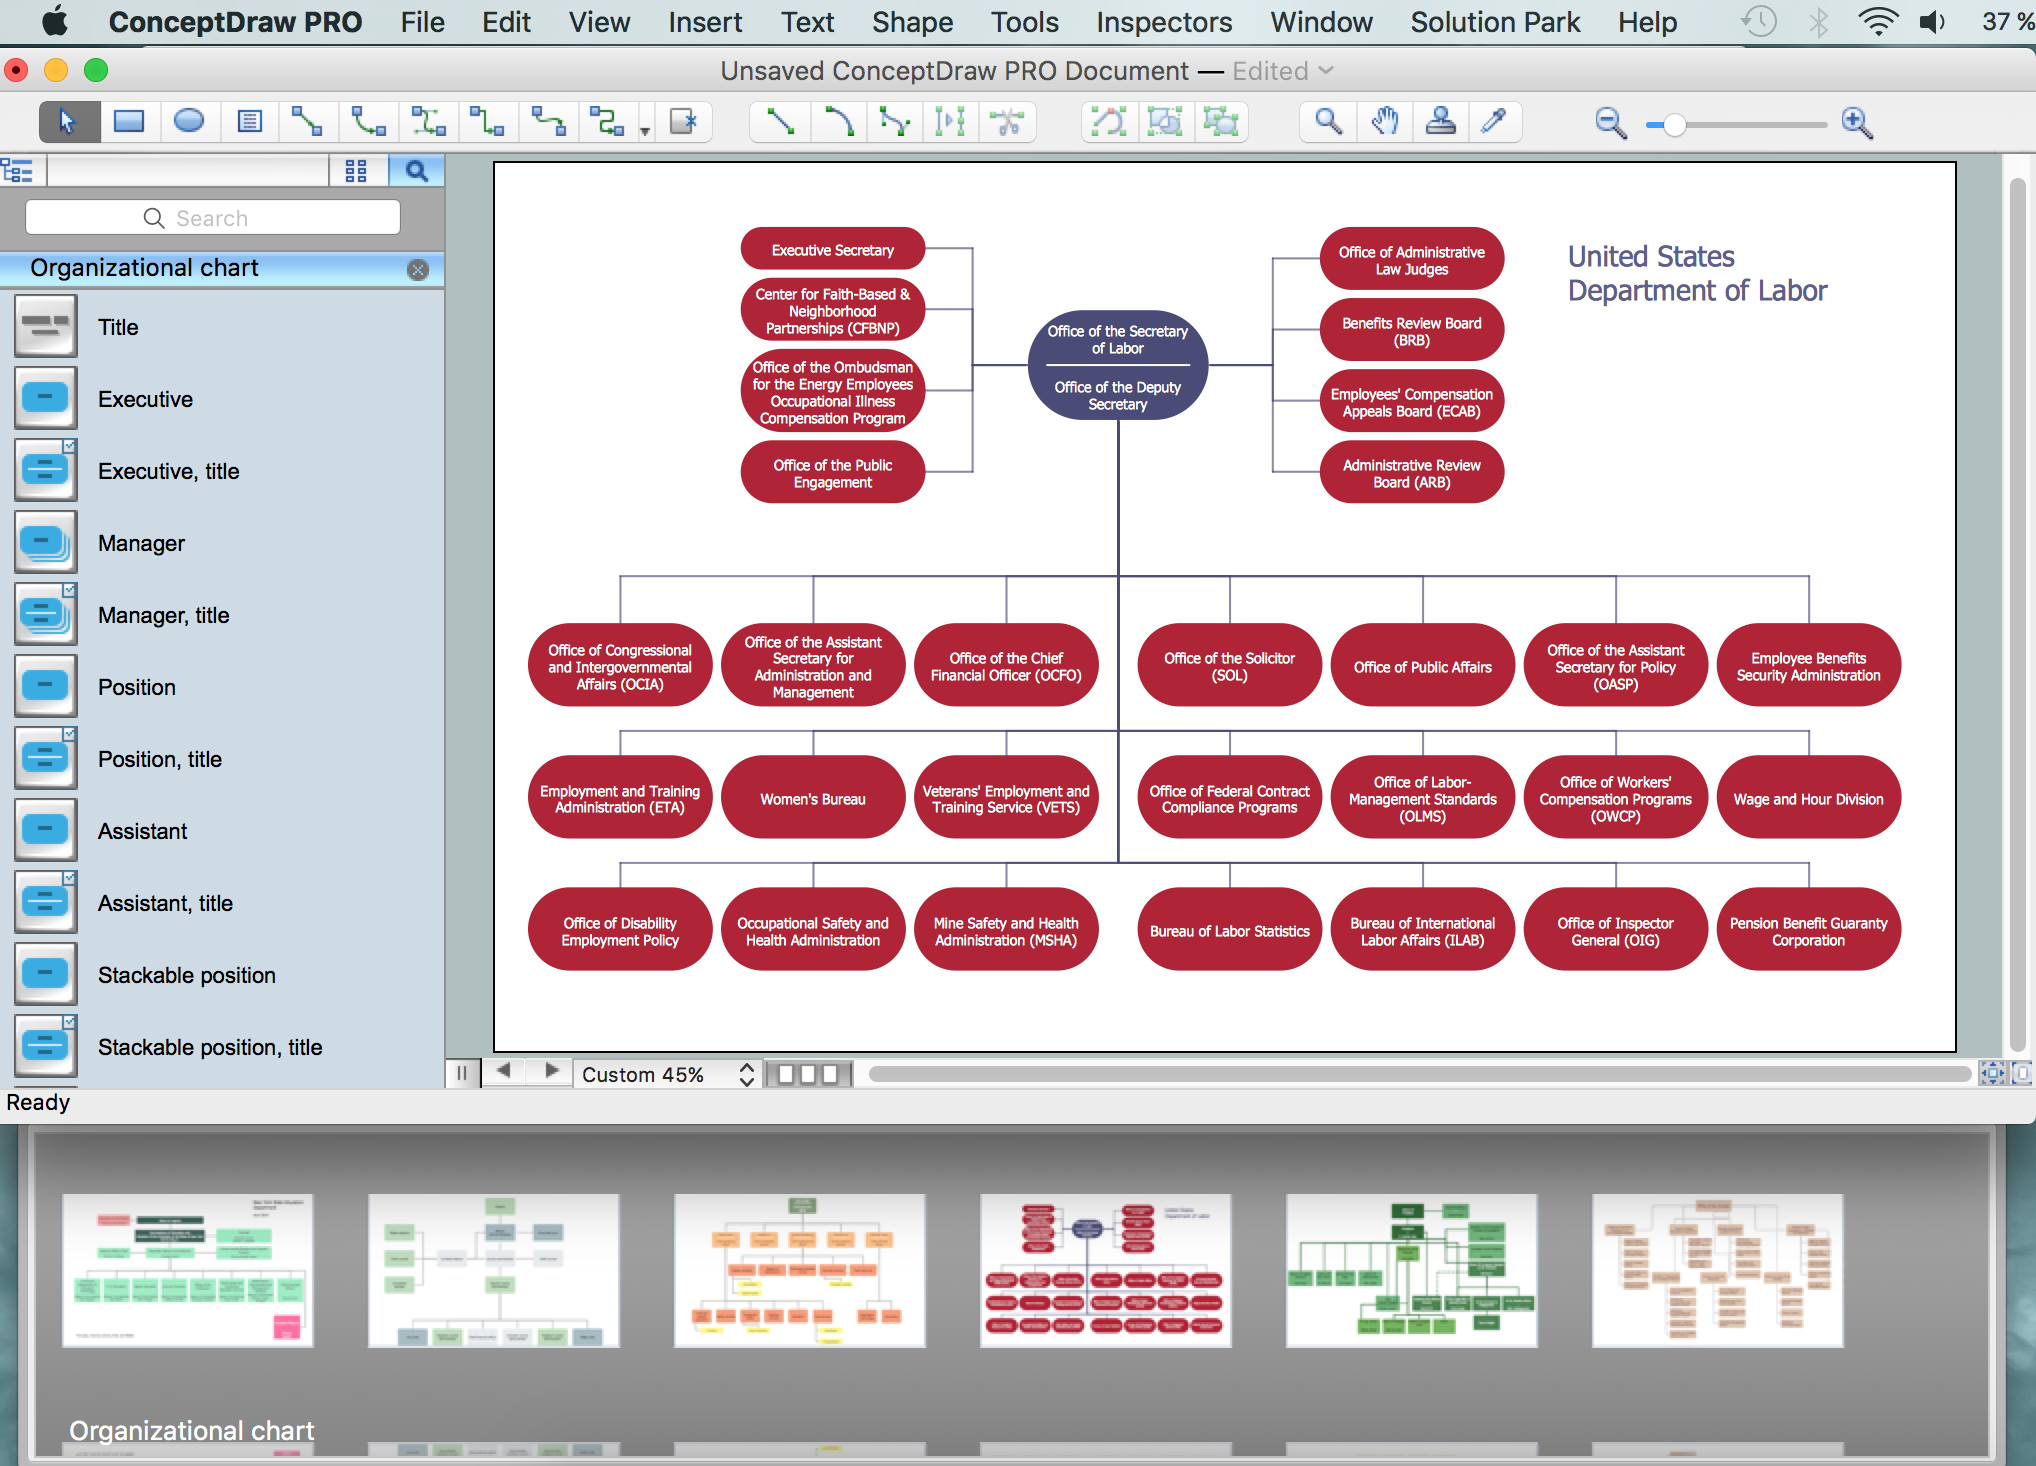
Picture: ConceptDraw DIAGRAM - Organizational chart software
Related Solution: