Fishbone Software Tools for Design Element
Cause and Effect diagram (Ishikawa diagram or Fishbone diagram) software helps you to show in one diagram the factors of Equipment, People, Process, Environment, Management and Materials, which all in general affect the overall problem and gives the base for the further analysis. ConceptDraw DIAGRAM is perfect software for designers and software developers who need to create Fishbone diagrams. You will get a simple problem-analysis tool - Fishbone software tools for design element to easy construct specific diagrams and identify many possible causes for an effect to attack complex problem solving.
_Win_Mac.png)
Example 1. Fishbone Software Tools for Design Element
Design of Fisbone Diagram begins from the defining an effect or problem and representing it as a fish head. Then you need define the groups of factors that led to the occurrence of a given problem and to draw them as bones on horizontal line - a fish spine. These causes are often defined during brainstorming sessions (we recommend to use the ConceptDraw MindMap for brainstorming). In turn, for each group of factors if needed can be also indicated 2-3 causes leading to the problem. Thus are constructed usually 3-4 levels.
Follow all these steps fast and easy thanks to the predesigned elements of Fishbone Diagrams library from Fishbone Diagrams Solution for ConceptDraw DIAGRAM software.

Example 2. Fishbone Diagram - Causes of Low Quality Output
The Fishbone Diagram samples you see on this page were created in ConceptDraw DIAGRAM using the powerful tools of Fishbone Diagrams Solution. An experienced user spent 10 minutes creating each of these samples.
Use the Fishbone Diagrams Solution for ConceptDraw DIAGRAM Solution Park for quick, easy and effective cause and effect analysis and problem solving.
All source documents are vector graphic documents. They are available for reviewing, modifying, or converting to a variety of formats (PDF file, MS PowerPoint, MS Visio, and many other graphic formats) from the ConceptDraw STORE. The Fishbone Diagrams Solution is available for all ConceptDraw DIAGRAM or later users.
NINE RELATED HOW TO's:
The Total Quality Management Diagram solution helps you and your organization visualize business and industrial processes. Create Total Quality Management diagrams for business process with ConceptDraw software.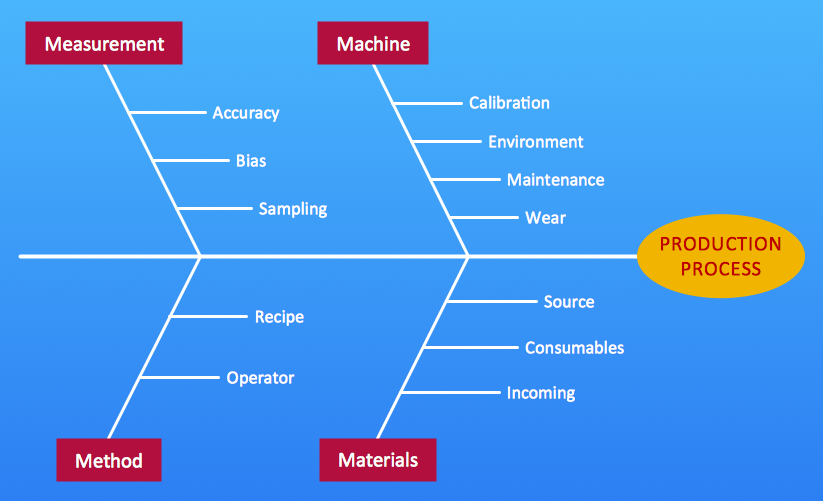
Picture: Total Quality Management Value
Related Solution:
The Venn diagram example below shows sustainable development at the confluence of three constituent parts.
Create your Venn diagrams for problem solving in environmental social science using the ConceptDraw DIAGRAM software.
Picture:
Venn Diagram Examples for Problem Solving
Environmental Social Science
Human Sustainability Confluence
Related Solution:
This sample was created in ConceptDraw DIAGRAM diagramming and vector drawing software using the UML Sequence Diagram library of the Rapid UML Solution from the Software Development area of ConceptDraw Solution Park.
This sample shows the interactions of the customer with the system and is used at the registration on the sites.
Picture: UML Sequence Diagram Example. SVG Vectored UML Diagrams Tools
Related Solution:
Few other areas benefited as much from the development of advanced digital drawing software as interior design. Previously only done by professionals, nowadays it is made available to virtually anyone with the help of software such as ConceptDraw DIAGRAM. You can design whatever you want - a living room, an office, a garage, a school layout - design elements provided by ConceptDraw DIAGRAM fit all of these purposes. All you need to get started is your creativity and the right software tools.
This library of vector graphic objects includes images of different school furniture and equipment related to school or training classes interior. These graphical elements are embedded into the ConceptDraw School and Training Plans solution. You can use them when designing interior layout of classroom or training office.Organization of the learning environment is an important element of a students learning. By using ConceptDraw DIAGRAM you can easily visualize and present your ideas related to any classes layout.
Picture: Interior Design. School Layout — Design Elements
Related Solution:
When you need to focus on the problem, professional diagramming tool helps you create a Fishbone diagram also known as Ishikawa diagram. Understanding of the problem via Fishbone diagram will improve the processes between departments and teams.
ConceptDraw DIAGRAM extended with Fishbone Diagrams solution gives a powerful tool for improving problem solving and focus with Fishbone diagrams.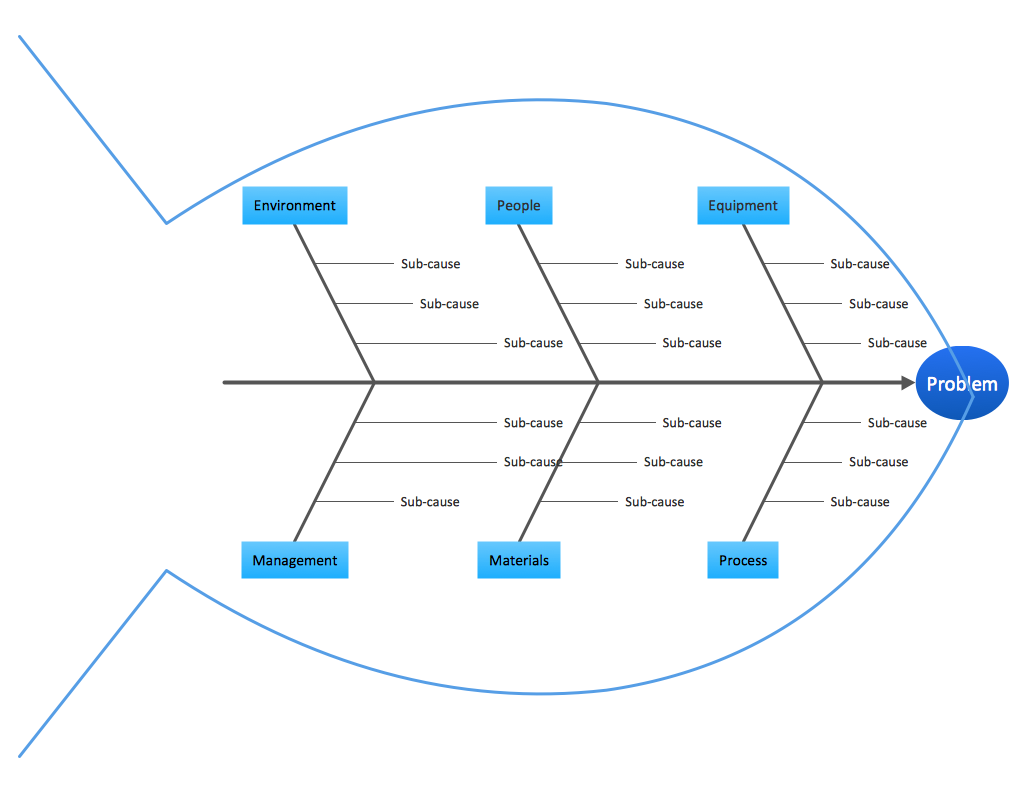
Picture: Improving Problem Solving and Focus with Fishbone Diagrams
Related Solution:
Fishbone diagram is a powerful tool used for solving business problems and obstacles. ConceptDraw DIAGRAM software extended with Fishbone Diagrams solution from the Management area of ConceptDraw Solution Park is a helpful tool for cause and effect analysis. It gives the ability to easy identify many possible causes and factors which cause the effects and to draw Fishbone Diagrams for problem solving.
Picture: Cause and Effect Analysis - Fishbone Diagrams for Problem Solving
Related Solution:
ConceptDraw DIAGRAM diagramming and vector drawing software extended with Seven Basic Tools of Quality solution from the Quality area of ConceptDraw Solution Park provides effective tools for quality control and helps design any types of quality-related diagrams.
Picture: Seven Basic Tools of Quality — Quality Control
Related Solution:
ConceptDraw DIAGRAM diagramming and vector drawing software enhanced with Total Quality Management (TQM) Diagrams solution from the Quality area of ConceptDraw Solution Park is rich for the useful and effective TQM tools.
Picture: TQM Tools
Related Solution:
ConceptDraw DIAGRAM software extended with Fishbone Diagrams solution from the Management area of ConceptDraw Solution Park is perfect for Cause and Effect Diagram creating. It gives the ability to draw fishbone diagram that identifies many possible causes for an effect or a problem. Causes and Effects are usually grouped into major categories to identify these sources of variation. Causes and Effects in the diagram show relationships among various factor. Fishbone diagram shows factors of Equipment, Process, People, Materials, Environment and Management, all affecting the overall problem.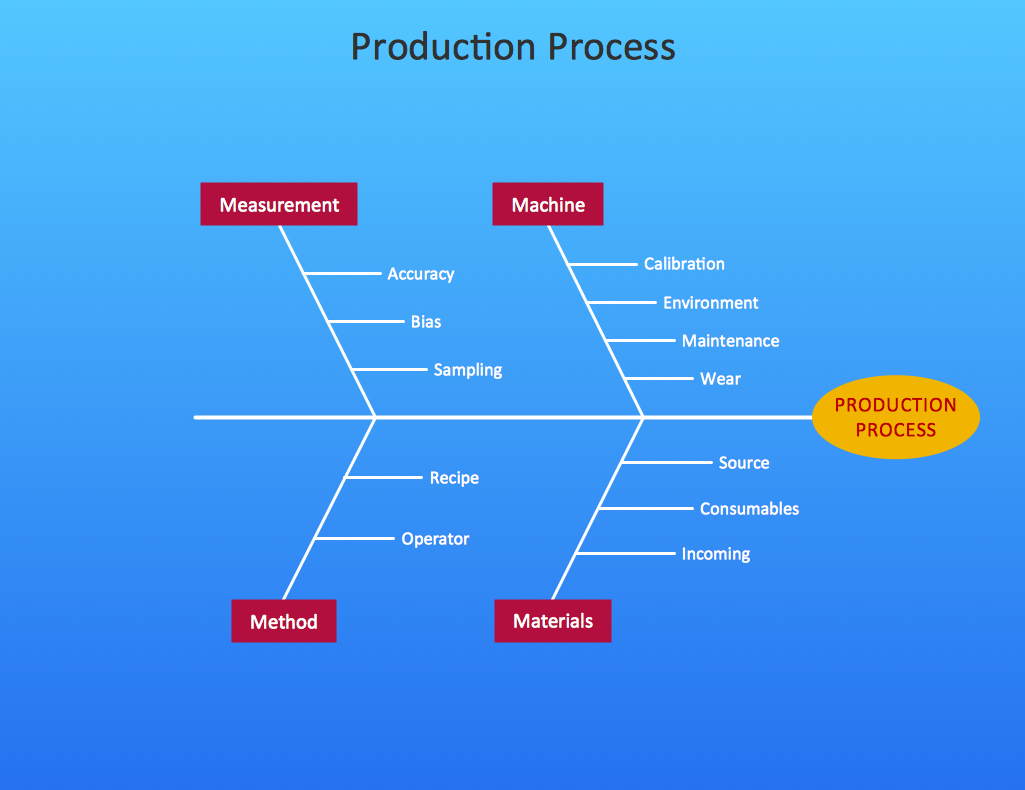
Picture: Cause and Effect Diagram
Related Solution:
