Pyramid Diagram
Pyramid Diagrams helps you to visualize the relationship building blocks as a triangle divided into horizontal slices, and may be oriented up or down. Labelled slices represent a hierarchy. Pyramids are used in marketing presentations to show and analyze hierarchy levels.
Five level pyramid model
A five level pyramid model of different types of Information Systems based on the information processing requirement of different levels in the organization.
- The first level represents transaction processing systems to process basic data .
- The second level represents office support systems to process information in office.
- The third level represents management information systems to process information by managers.
- The fourth level represents decision support systems to process explicit knowledge.
- The fifth level represents executive information systems to process tacit knowledge.
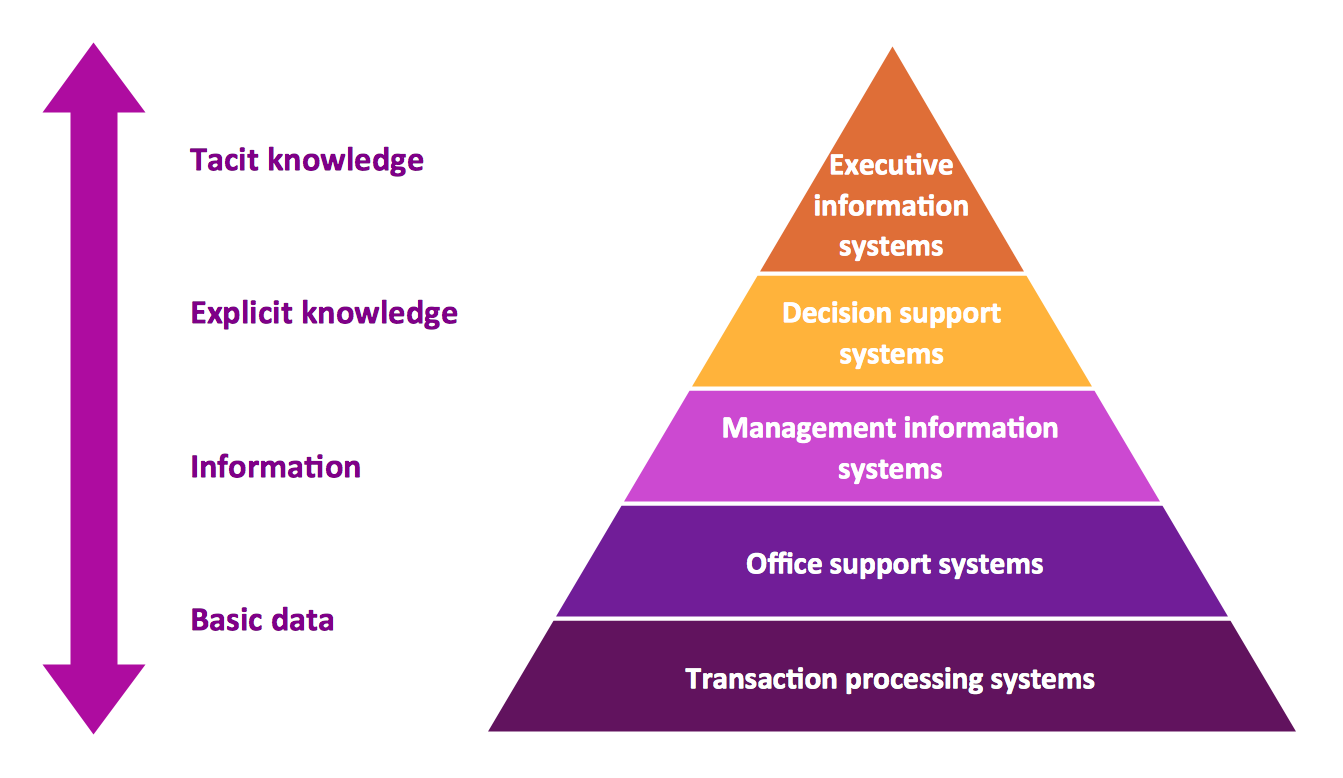
Example 1. Pyramid Diagram. 5 level pyramid model of information systems types
This diagram was redesigned using ConceptDraw DIAGRAM diagramming and vector drawing software from Wikimedia Commons file. [commons.wikimedia.org]
This file is licensed under the Creative Commons Attribution 3.0 Unported license. [creativecommons.org]
This triangle chart example is included in the Pyramid Diagrams solution from Marketing area of ConceptDraw Solution Park.

Example 2. Pyramid Diagrams solution in ConceptDraw STORE
All source documents are vector graphic documents. They are available for reviewing, modifying, or converting to a variety of formats PDF file, MS PowerPoint, MS Visio, and many other graphic formats.
See more Pyramid Diagram:
TEN RELATED HOW TO's:
This sample was created in ConceptDraw DIAGRAM diagramming and vector drawing software using the UML Class Diagram library of the Rapid UML Solution from the Software Development area of ConceptDraw Solution Park.
This sample describes the use of the classes, the generalization associations between them, the multiplicity of associations and constraints. Provided UML diagram is one of the examples set that are part of Rapid UML solution.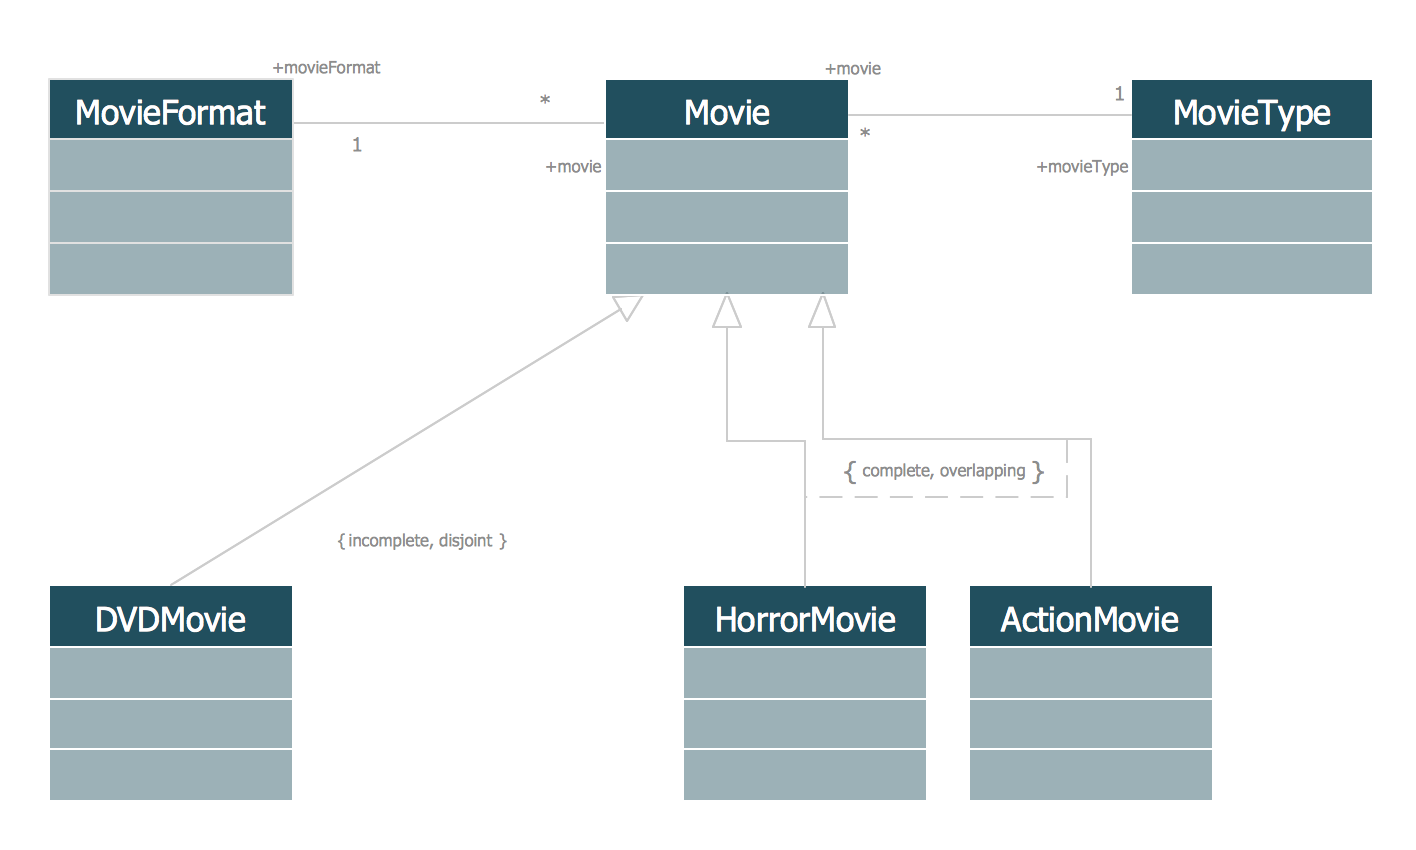
Picture: UML Class Diagram Generalization ExampleUML Diagrams
Related Solution:
Represent a set of planned outcomes that define 100% of the project scope. Create Work Breakdown Structure (WBS) diagram.
Picture: WBS Diagram
Related Solution:
Create bar charts for visualizing problem solving in manufacturing and economics using the ConceptDraw DIAGRAM diagramming and vector drawing software extended with the Bar Graphs Solution from the Graphs and Charts area of ConceptDraw Solition Park.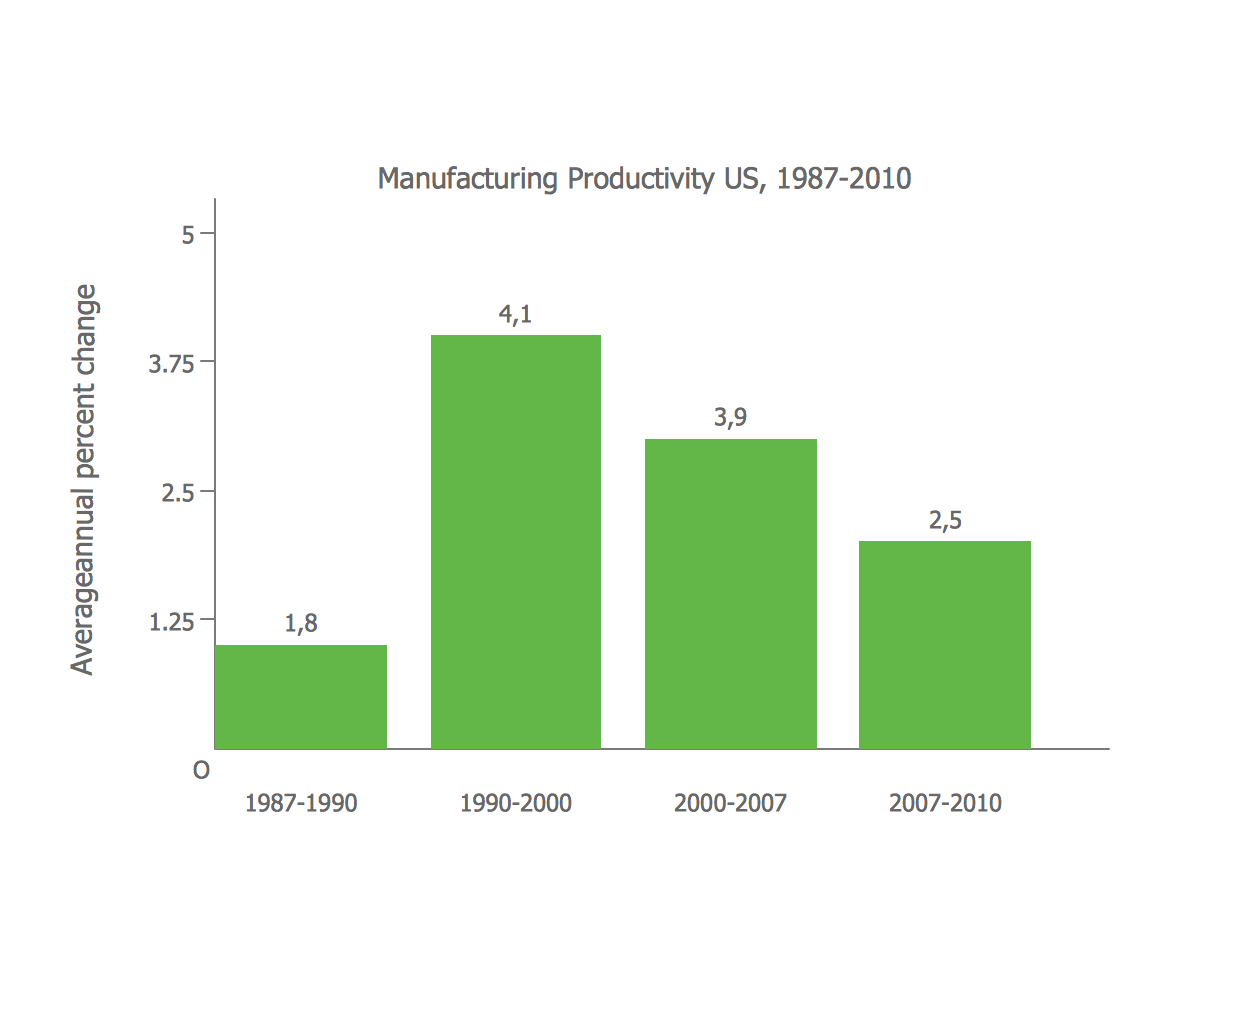
Picture: Bar Diagrams for Problem Solving. Create manufacturing and economics bar charts with Bar Graphs Solution
Related Solution:
This sample shows the Flowchart that displays the layout and work flow of the cloud marketing platform. This diagram has a style of the marketing brochure. This style displays the central product that is related to the other issues.
Using the ready-to-use predesigned objects, samples and templates from the Flowcharts Solution for ConceptDraw DIAGRAM you can create your own professional looking Flowchart Diagrams quick and easy.
Picture: Flowchart Marketing Process. Flowchart Examples
Related Solution:
ConceptDraw DIAGRAM is a professional software for creating great looking flowcharts. The samples included in this set of software allows users to draw any type of flowchart.
Picture: Flowchart Process Example
Related Solution:
Video tutorials on ConceptDraw products. Try it today!
Picture: How to Draw a Bubble Chart
Related Solution:
Infographics can be created with the help of ConceptDraw DIAGRAM diagramming and drawing software same way any other scheme or flowchart can be made: by using the appropriate solution taken from the ConceptDraw STORE application which consists of the needed tools such as the stencil libraries with the design elements that all can be used by the ConceptDraw DIAGRAM users.
Picture: Information Graphics
Related Solution:
Garrett IA diagrams are used at development of Internet-resources, in particulars at projecting of interactions of web-resource elements. The diagram of information architecture of the web resource which is constructed correctly with necessary details presents to developers the resource in comprehensible and visual way.
Picture: Garrett IA Diagrams with ConceptDraw DIAGRAM
The most easier way of creating the visually engaging and informative Sales Process Flowchart is to create the new ConceptDraw document and to use the predesigned vector symbols offered in 6 libraries of the Sales Flowchart Solution. There are more than six types of sales process flow diagrams, ConceptDraw DIAGRAM software is flowchart maker which include six collections of extended flowchart symbols for effective diagramming. There are main collections of color coded flowchart symbols: Sales Department, Sales Steps, Sales Workflow, Sales Symbols and special set of Sales Arrows and Sales Flowchart.
Picture: Sales Process Flowchart Symbols
Related Solution:
The vector stencils library Yourdon and Coad Notation from the solution OOAD contains specific symbols of the Yourdon and Coad notation such as data store symbol, data process symbol, loop symbol for ConceptDraw DIAGRAM software.
Picture: Yourdon and Coad Diagram
