Flow Chart
What is a Flow Сhart
A Flow Chart is a type of diagram which visualizes a process, algorithm of a program or workflow. The steps / operations are represented as boxes of various types and are connected by arrows which show the flow of the process.
The Flow Chart is a very popular type of diagram, it is widely used for analyzing, designing, managing and visualizing the business and technical processes, various software algorithms.
But how to design a Flow Chart fast and easy? We recommend to use a powerful ConceptDraw DIAGRAM software extended with Flowcharts Solution.

Example 1. Flow Chart — Food Security Assessment
Create a Flow Chart
The Flowcharts Solution offers 2 libraries with all commonly used shapes for drawing any Flow Chart you need. Below you can see them all, click on the preview to enlarge it.
All these objects are vector objects, you can resize them without loss of quality, change their color to make your flow chart diagram more interesting, bright and attractive.
To design your own Flow Chart in minutes, follow the next steps:
- drag the required shapes from the libraries,
- type the text inside the shapes,
- arrange the shapes and connect them with arrows.

Example 2. Flowcharts Solution in ConceptDraw STORE
You can also use the ready sample flow chart or template offered by Flowcharts solution in ConceptDraw STORE as the base or as the source of inspiration for your own Flow Chart.
Benefits of Flow Chart
The Flow Chart has a wide set of benefits:
- gives a clear documentation of a process;
- allows to define and offers common understanding of processes;
- helps to build a process visual representation for analysis, discussion, and communication;
- allows to identify the scope of the process;
- allows to trace and analyze the process steps;
- helps to standardize and find areas for monitoring, improvement and increased efficiency in a process;
- allows to find and detach the steps of the process that are not essential;
- helps in understanding the logic of complex problems;
- offers a guidance for managers overseeing operations;
- facilitates communication between programmers and business people;
- helps programmers to write the programs of any complexity and on the any high level language;
- helps in debugging process and provides efficient program maintenance;
- helps to understand and explain to other people the logic of the complex problems and their solution;
- assists to improve teamwork effectiveness.

Example 3. Flow Сhart — Synthetic Object Construction
The samples you see on this page were created in ConceptDraw DIAGRAM software using the flow chart symbols and shapes from the Flowcharts solution libraries. Each Flow Chart sample you see here is professionally looking and successfully demonstrates solution's capabilities and professional results you can achieve using it. An experienced user spent 10 minutes creating each of these samples.
Use the Flowcharts Solution for ConceptDraw DIAGRAM software to create your own Flow Chart or Org Flow Chart of any complexity quick, easy and effective.
All source documents are vector graphic documents. They are available for reviewing, modifying, or converting to a variety of formats (PDF file, MS PowerPoint, MS Visio, and many other graphic formats) from the ConceptDraw STORE. The Flowcharts Solution is available for all ConceptDraw DIAGRAM or later users.
TEN RELATED HOW TO's:
Working with information can be quite tedious, furthermore, some data can be quite difficult to perceive without any graphic representation. So, to facilitate your work, you can use business diagrams, such as simple flowcharts or Gantt charts for project management and orgcharts for clarifying your company structure. You can use a proper software, like ConceptDraw Pro, draw them on paper, or use whiteboards, but it is more convenient to use a digital tool.
This diagram shows a cross-functional flowchart that was made fore telecom service provider. A workflow of a common telecommunication service provider has a rather branched structure. Thus, it is useful to have a flow chart to visualize the sequences and interrelations of the work flow steps. Business process flowchart contains 17 processes and 4 decision points,that are distributed through 2 lines depicting the participants involved. Also there are connectors that show the data flow within processes. This flowchart displays a detailed model of the telecom service trading process, as well as all participants in the process and how they interact with each other.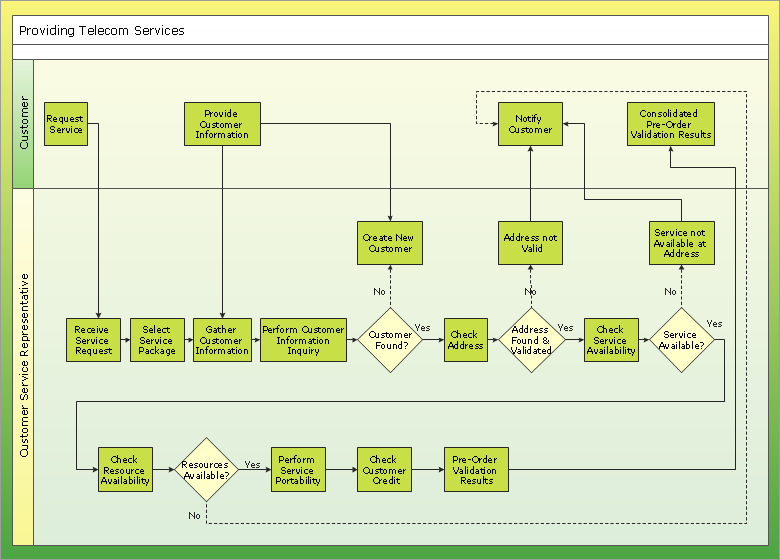
Picture: Business diagrams & Org Charts with ConceptDraw DIAGRAM
The ConceptDraw Flowchart component includes a set of samples and templates. This geathered as flowchart maker toolbox which focused on drawing flowcharts of any industry standards.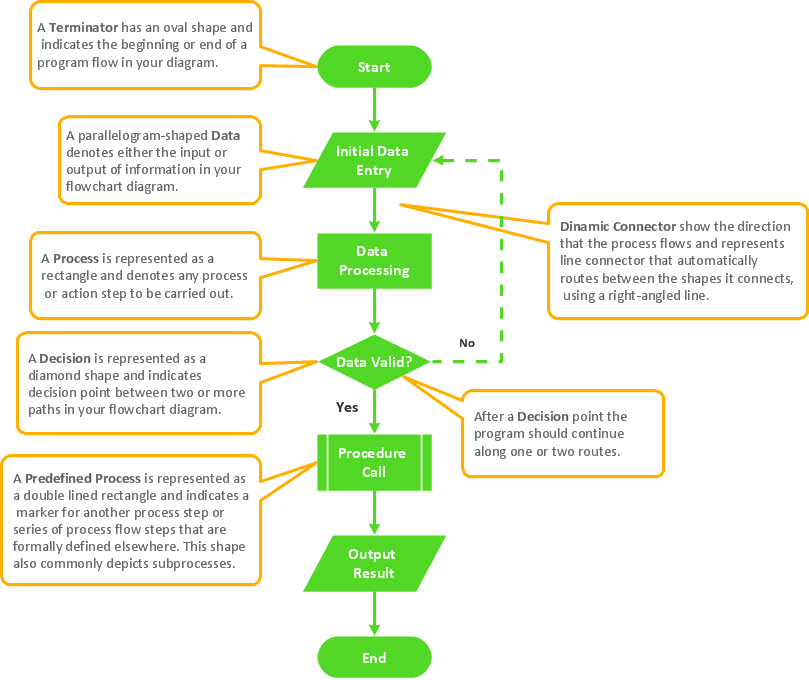
Picture: Flowchart Components
Related Solution:
If you ever tried programming, you could face a lot of problems as a beginner. To help yourself, create a flowchart to follow an algorithm logic. Flowchart represents a program as a sequence of steps depicted in special symbols for each type of action.
This image of the interactive diagram made in ConceptDraw DIAGRAM applying the Live Objects technology. The diagram shows the effect of Selection Sort algorithm. The left part of the chart is the input area. The diagram in the central part of the drawing is a flow chart showing of the selection sort algorithm. The flowchart includes basic flowchart symbols, that represent various stages of algorithm. The flowchart symbols are connected with arrows ended lines, that depict the direction of the process flow. On the right side — the result is displayed.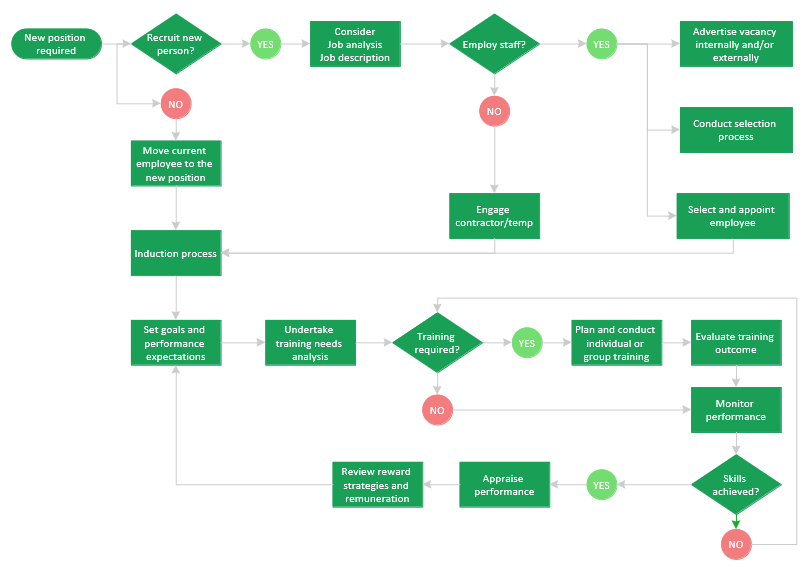
Picture: What Is a Flowchart? Definition, Symbols, Examples and How to Create One
Related Solution:
The vector stencils library Yourdon and Coad Notation from the solution OOAD contains specific symbols of the Yourdon and Coad notation such as data store symbol, data process symbol, loop symbol for ConceptDraw DIAGRAM software.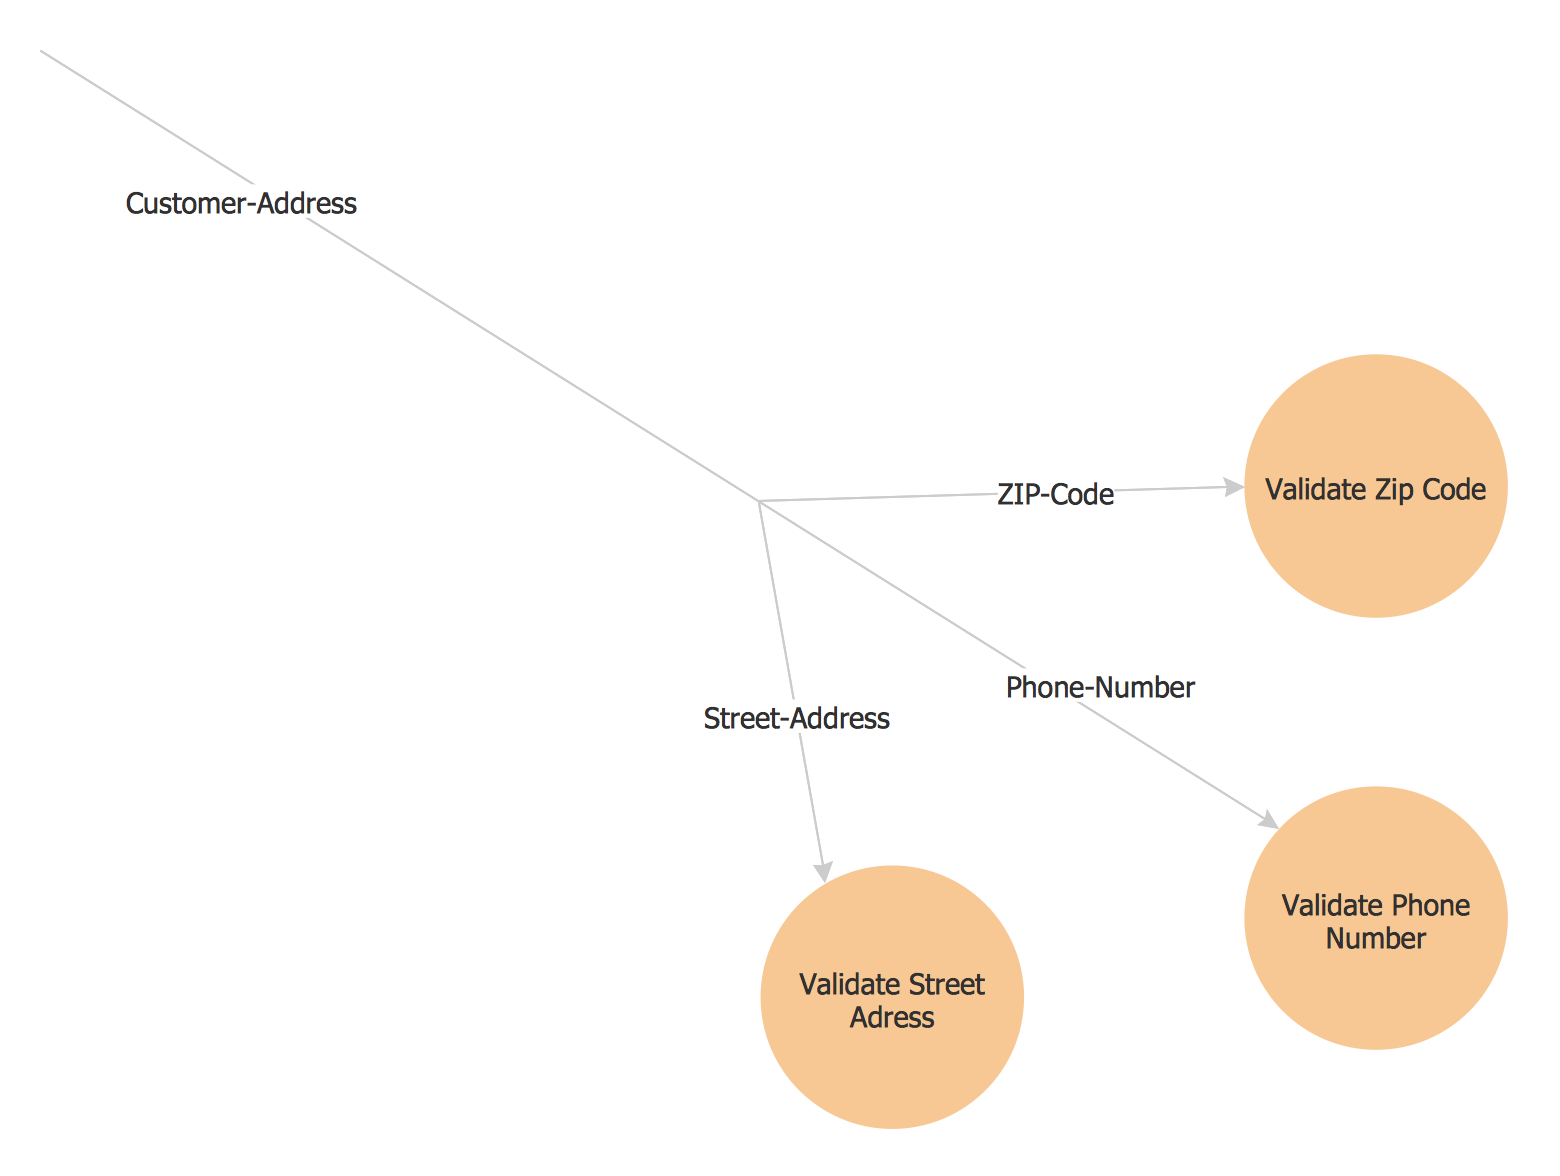
Picture: Yourdon and Coad Diagram
Use ConceptDraw DIAGRAM business diagramming and business graphics software for general diagramming purposes, it inludes tousands colored professional flowchart symbols, examples and samples which saves time when you prepare documents, professional presentations or make an explanation of process flow diagram.
Picture: Flow Chart Design — How to Design a Good Flowchart
Related Solution:
Food courts are one of the most rapidly developing areas of the restaurant business. ConceptDraw DIAGRAM diagramming and vector drawing software offers a Food Court solution from the Food and Beverage area with wide capabilities for planning, design, developing and advertising of a Food Court.
Picture: Food Court
Related Solution:
It's very simple, convenient and quick to design professional looking Flowcharts of any complexity using the ConceptDraw DIAGRAM diagramming and vector drawing software extended with Flowcharts Solution from the Diagrams Area of ConceptDraw Solution Park which provides a wide set of predesigned objects, templates, samples and Flowchart examples.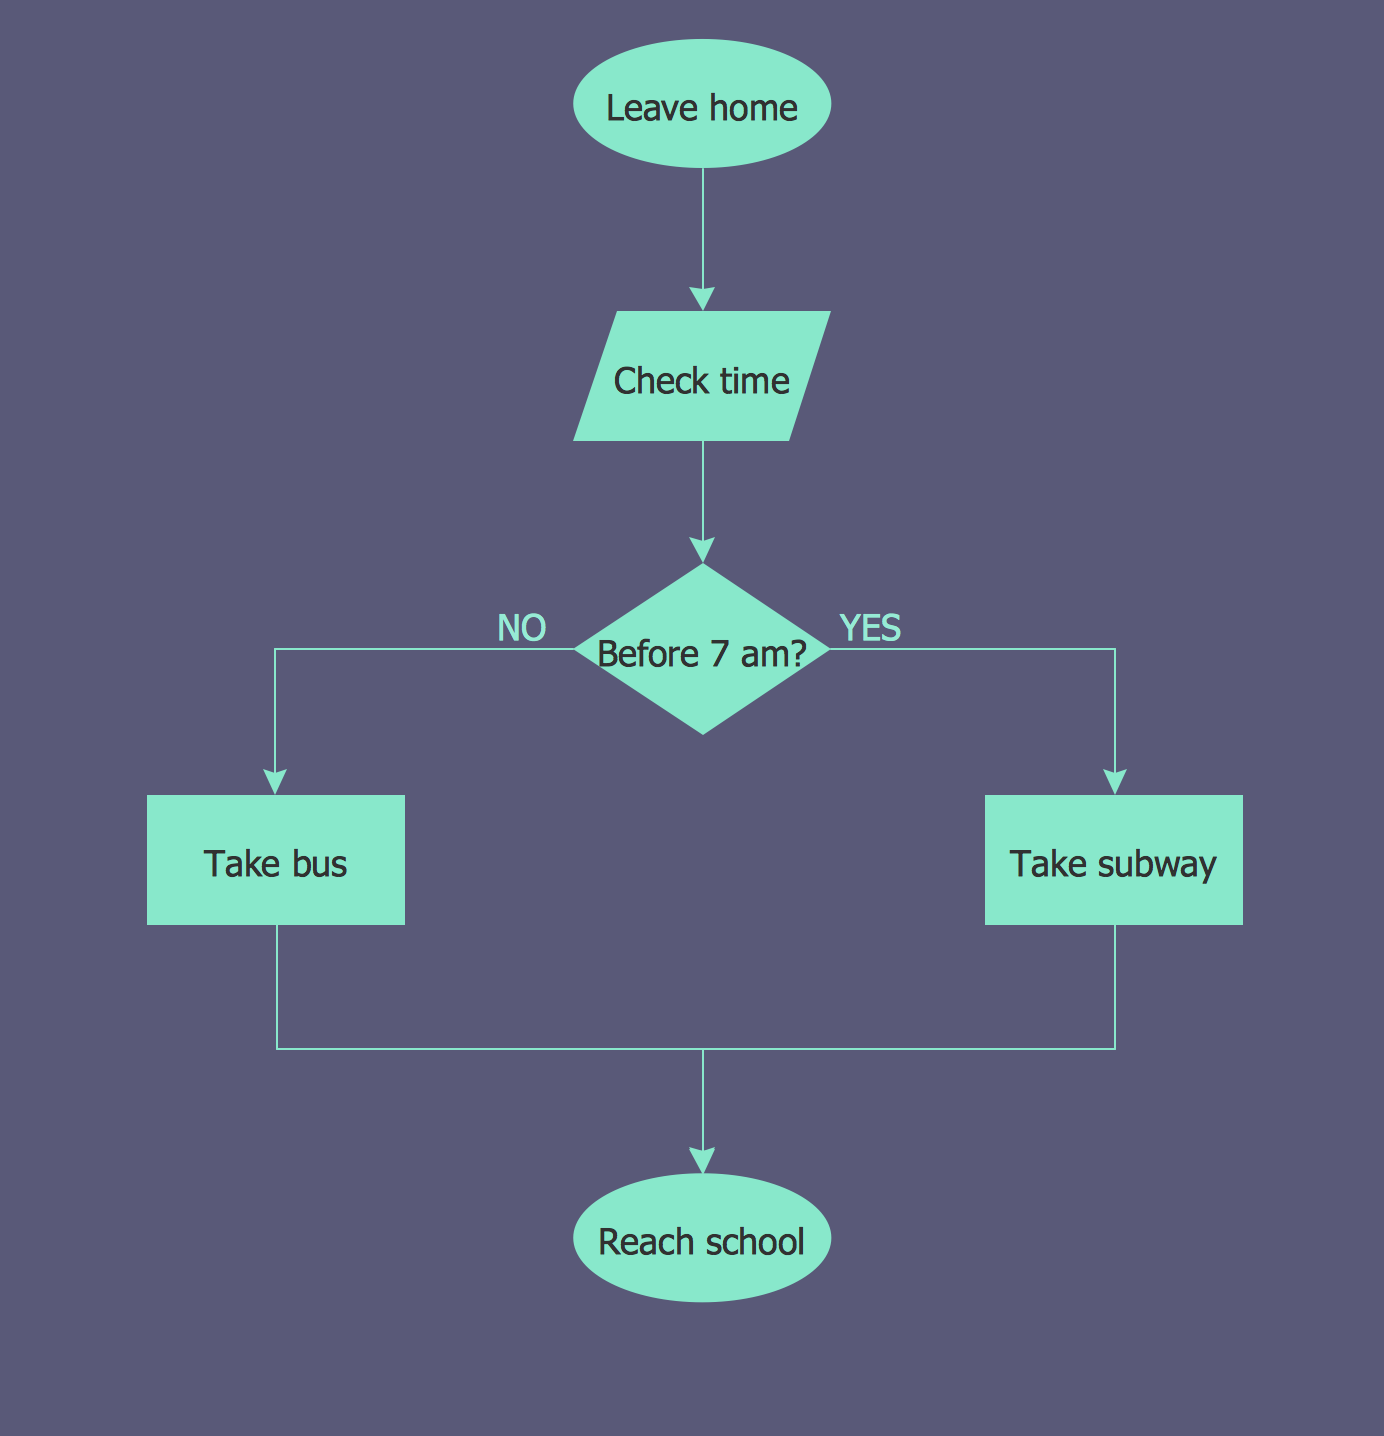
Picture: Flowchart Examples
Related Solution:
ConceptDraw DIAGRAM is a flowchart design software. There are large collections of professional flowchart symbols for process flow diagrams, standard flowchart symbols and colored basic flowchart symbols. Built-in examples and video lessons allow users to get started immediately and do drawing of virtually any type of flowchart or process flow diagrams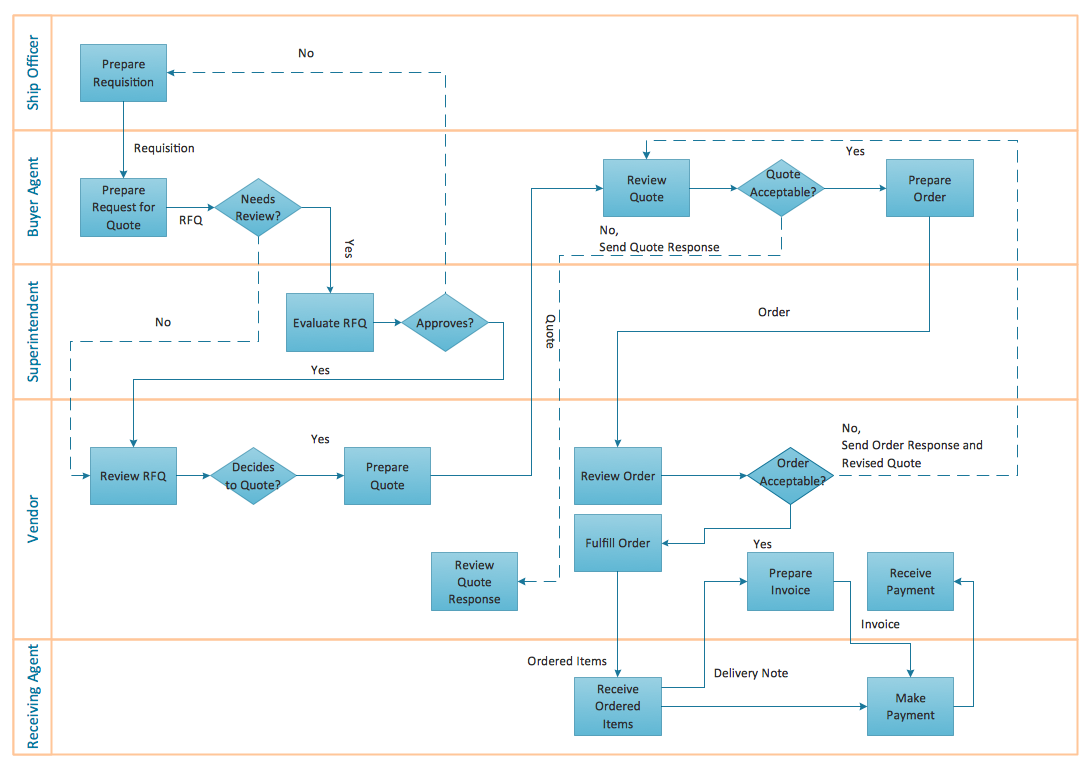
Picture: Flow Chart Creator
Related Solution:
ConceptDraw DIAGRAM is a software for producing flow charts. The software delivers built-in object libraries with vector stencils that allows you to use RapidDraw technology. By clicking on direction arrows one can add a new object to flowchart. Users can start drawing their own flowchart diagrams in fast and simple way.
Picture: Diagram Flow Chart
Related Solution:
Presenting you with a drawing program which could really surprise you with their great functionality.
Don't know how to start to draw Connector's improvement?
Curious how should diagramming software work?
Drawing programs involve a lot of things like designs in an illustrative way, creating an cherts, Tools to create high end graphics, create dashboards, using your data and many other technical aspects do it in a much professional and in a quick way.
Picture: How to Help Customers be More Productive

")
")
