Flowchart Symbols AccountingActivity-based costing (ABC) flowchart
Activity-based costing is a well-known methodology, with the help of which anyone can identify the activities in their organization. It also helps assign the cost of each of the existing activities with the existing resources. This model assigns all indirect costs, which are not directly related to production, into the direct ones, the opposite ones, being compared to the conventional costing.
Chartered Institute of Management Accountants defines ABC as one of the existing approaches to the costing as well as monitoring the activities, involving tracing the consumption of the resources and the costing final outputs. During this process, the resources are assigned to the activities, and the last ones - to cost objects, based on the consumption estimates.
Having ABC, any company can estimate the cost elements of their entire products, services and other activities. This costing may help inform a company's decision in order to eliminate and identify the products as well as services, which are simply unprofitable. It is also possible to lower the prices of those products or services, which were previously overpriced, if needed, in order to finally sell them. It is also always possible to eliminate as well as to identify all of the ineffective service or/and production processes and to allocate the processing concepts, which can lead to the very same product, but at a better yield (known as a “process reengineering aim”).
The methodology named “ABC” performs an activity of assigning an organization's resources according to their costs through the activities to this organization’s services and products, provided to its customers. This methodology can also be used as a tool for the understanding the product as well as the customer cost. It also becomes clear to understand the profitability of any organization, based on its production or its performing processes, that is why ABC has been used in order to support all of the needed strategic decisions (for example, outsourcing, identification, pricing, measurement of process improvement initiatives, etc).
Although, at some point ABC method became too expensive and difficult to implement for small gains, so the alternative methods were used. Though, the application of an activity, which is based on the recording that it may be applied as an addition to any activity based accounting, can transform the concurrent process accounting into a more authentic approach. Nowadays, the percentages of indirect costs have risen, so this technique became too inaccurate for a reason of the indirect costs became being not caused equally by all products. Nevertheless, instead of using the broad arbitrary percentages in order to allocate costs, “ABC” seeks for a possibility to identify the cause and effect relationships to objectively assign costs, so once it is done, the cost of each of the activities is attributed to each product or service to the extent, so we can say that the product uses the activity. Now, ABC often identifies all of the areas of high overhead costs per unit and so it directs the attention in order to find the ways of reducing the costs of costly products.
Activity-based costing was first clearly defined in 1987 and it is been used since up to now. The focus, firstly, was only on the manufacturing industry, as that is the field of business activity where the increasing technology as well as the productivity improvements have reduced the relative proportion of the direct costs of both materials and labour, but at the same time they have increased the relative proportion of indirect costs. Apart from the manufacturing industries, the financial institutions became using “ABC” method, having the diverse customers and products, which causes the so-called “cross-product” and “cross-customer” subsidies. Thus, the activity based costing, of simply ABC, was originally developed for manufacturing, became a more useful tool for other spheres of the business activity.
This activity-based costing was explained in 1999 in the book Management Challenges of the 21st Century, being stated by the author, that the traditional cost accounting focuses on what it costs in order to do something, as well as records the cost of “not doing”, such as the cost of waiting for a needed element to be able to continue the process of production. Such ABC method helps record the costs, which the traditional cost accountings cannot do.
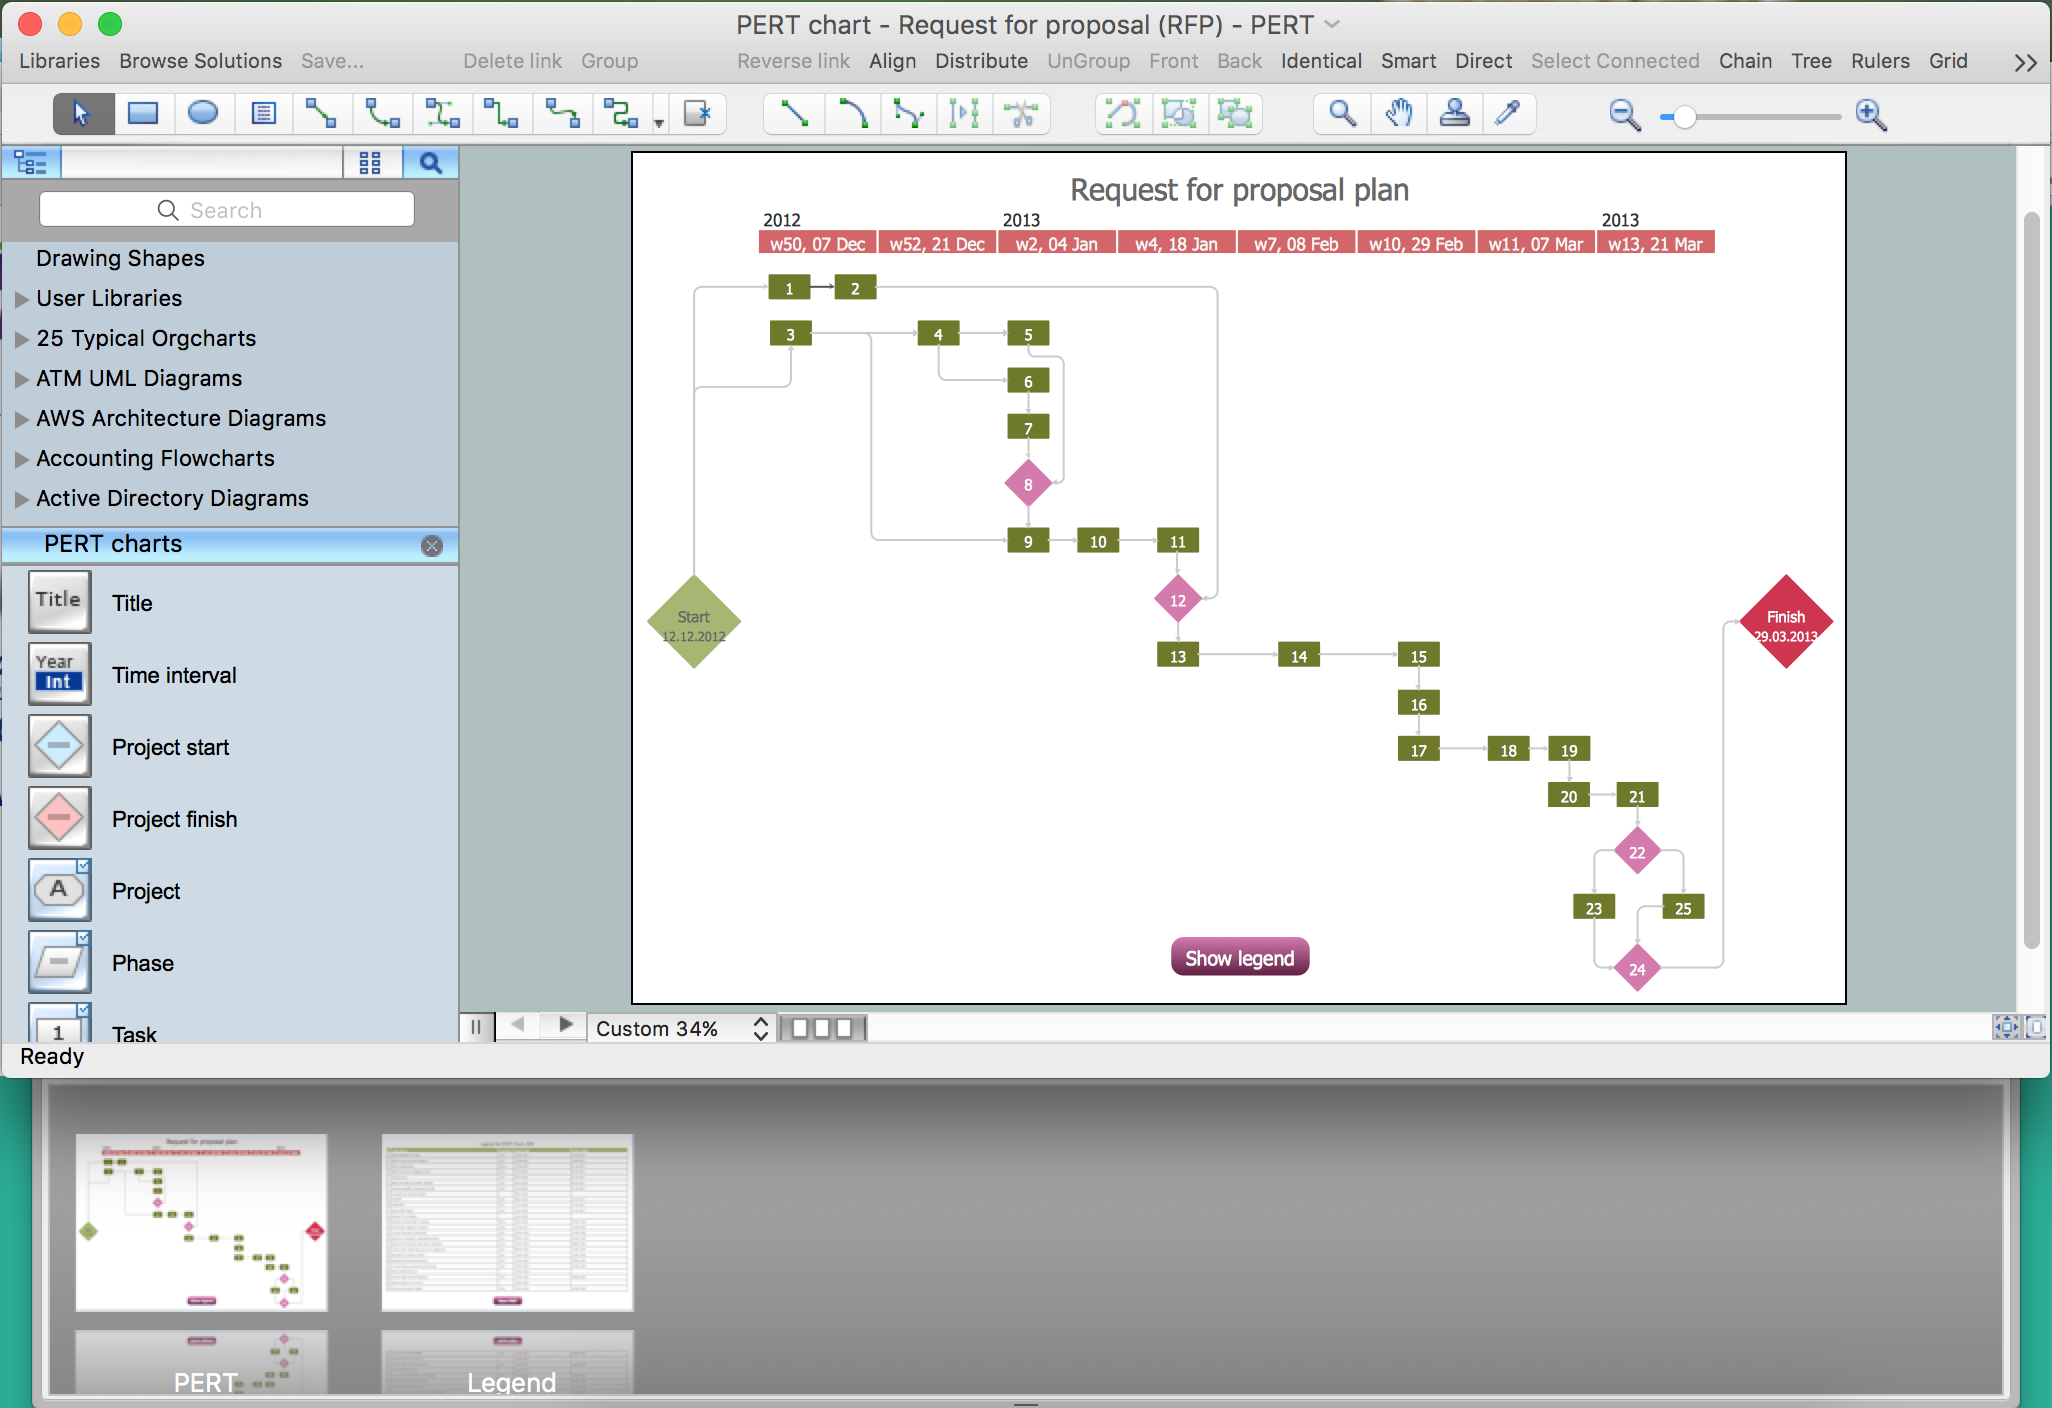
For using ABC it is enough to create an ABC, or activity-based costing flowchart, and having ConceptDraw DIAGRAM makes things much simpler in order to get the needed result in a short period of time. Having the accounting flowchart symbols from the pre-developed solutions, which can be found both on this site or in ConceptDraw STORE, is the way to finish with the drawing of ABC flowchart in only a couple of hours, or even minutes, depending on how familiar you are both with ConceptDraw DIAGRAM as the solutions, created by the CS Odessa IT specialists for you to be able to achieve the professional result. ConceptDraw DIAGRAM is nowadays one of the best diagramming vector drawing tool. Being a flowchart making software extended with the specially developed “Accounting Flowcharts solution” from the “Finance and Accounting area” of ConceptDraw STORE, this application allows you as well as any other ConceptDraw DIAGRAM user, to draw a smart looking flowchart, using the pre-made examples and templates of ABC charts.
Pic. 1. Accounting Flowcharts solution in ConceptDraw STORE
Thus, the “Accounting Flowcharts solution” extends ConceptDraw DIAGRAM with a library, which contains 12 major flowchart symbols, which are all the vector shapes that can be used for representing any document process flow diagrams, as well as data flow diagrams and document flow tasks in order to explain any needed accounting work process. This flowchart software is widely used in terms of making the accounting process flow diagrams as well as any needed presentations for explaining the accounting process in a simple visual way and it is today available for you as well.
Pic. 2. Accounting Flowchart Symbols
Using the Accounting Flowchart template and symbols.
Pic. 3. Accounting Flowcharts Template
Add flowchart symbols to the diagram by dragging them from the Accounting flowcharts library to the document page.
Connect the flowchart elements by the arrow connectors using the Smart Connectors tool.
Use Line, Fill, Shadow and Text tools to format and design the accounting flowchart.
Pic. 4. Accounting Flowchart Design
A solution useful for accountant who need to produce flowcharts showing payment, purchase order, or procurement processes.

Pic. 5. Activity-based costing flowchart.
This accounting diagram use regular ABC flowchart symbols of Accounting Flowcharts solution from Finance and Accounting Area of ConceptDraw Solution Park.
R = resource-catagories
RCD = Resource Cost Drivers
A = activities
ACD = Activity Cost Drivers
O = Cost Object
DM = Direct Material
DL = Direct Labour.
This example was redesigned from the commons.wikimedia.org


