Food Images
You need design pictorial food images to decorate menu of your restaurant or to create beautiful advertising materials? We recommend to use a ConceptDraw DIAGRAM diagramming and vector drawing software extended with Food Court solution from the Food and Beverage area of ConceptDraw Solution Park for easy designing colorful food images.

Example 1. Food Images - Outdoor Party Food Court Area
Food Court Solution contains large collection of predesigned examples and samples, and
7 libraries:
- Beverages
- Cafe People
- Dessert
- Fast Food
- Fruits
- Meat
- Vegetables
These libraries contain 201 professionally developed vector objects of various vegetables and fruits, meat and fast foods, drinks and desserts, etc.

Example 2. Food Images - Smoothies
Objects and clipart from the libraries of Food Court solution will help you represent any idea, easy design food images which you want and imagine, and of any complexity. Don't afraid to use bright colors and colorful backgrounds, they make your food pictures successful.

Example 3. Food Images - Easy Breakfast
The food images you see on this page were created in ConceptDraw DIAGRAM software using the Food Court Solution. They successfully demonstrate solution's capabilities and professional results you can achieve. An experienced user spent 10-15 minutes creating each of these samples.
Use the tools of Food Court Solution for ConceptDraw Solution Park to design your own attractive F&B images fast, easy and effective.
All source documents are vector graphic documents. They are available for reviewing, modifying, or converting to a variety of formats (PDF file, MS PowerPoint, MS Visio, and many other graphic formats) from the ConceptDraw STORE. The Food Court Solution is available for all ConceptDraw DIAGRAM users.
TEN RELATED HOW TO's:
ConceptDraw solution Computer and Networks provides Interactive Voice Response samples, templates and library of 35 vector stencils for drawing the IVR network diagrams.
Use ConceptDraw DIAGRAM diagramming and vector drawing software enhanced with solution Computer and Networks to visualize the logical and physical structure of IVR systems for inbound and outbound call centers and voice mail systems.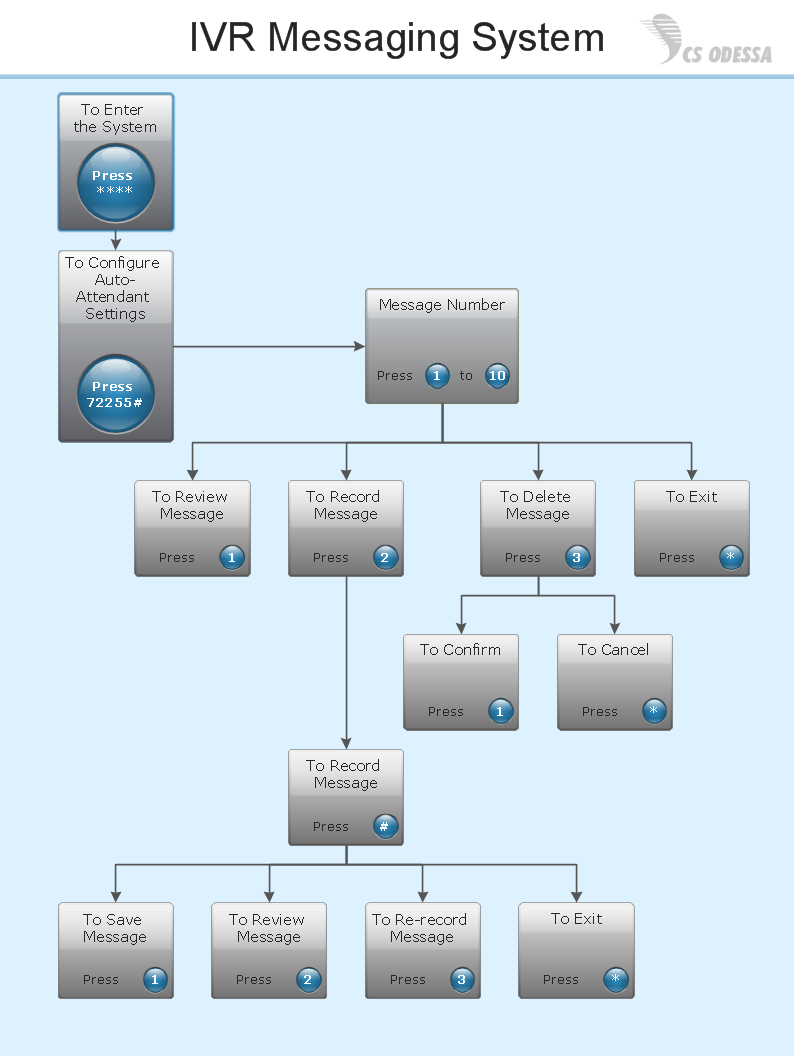
Picture: Interactive Voice Response Network Diagram
ConceptDraw DIAGRAM diagramming and vector drawing software extended with Mac OS User Interface Solution from the Software Development area is a powerful Mac OS GUI Software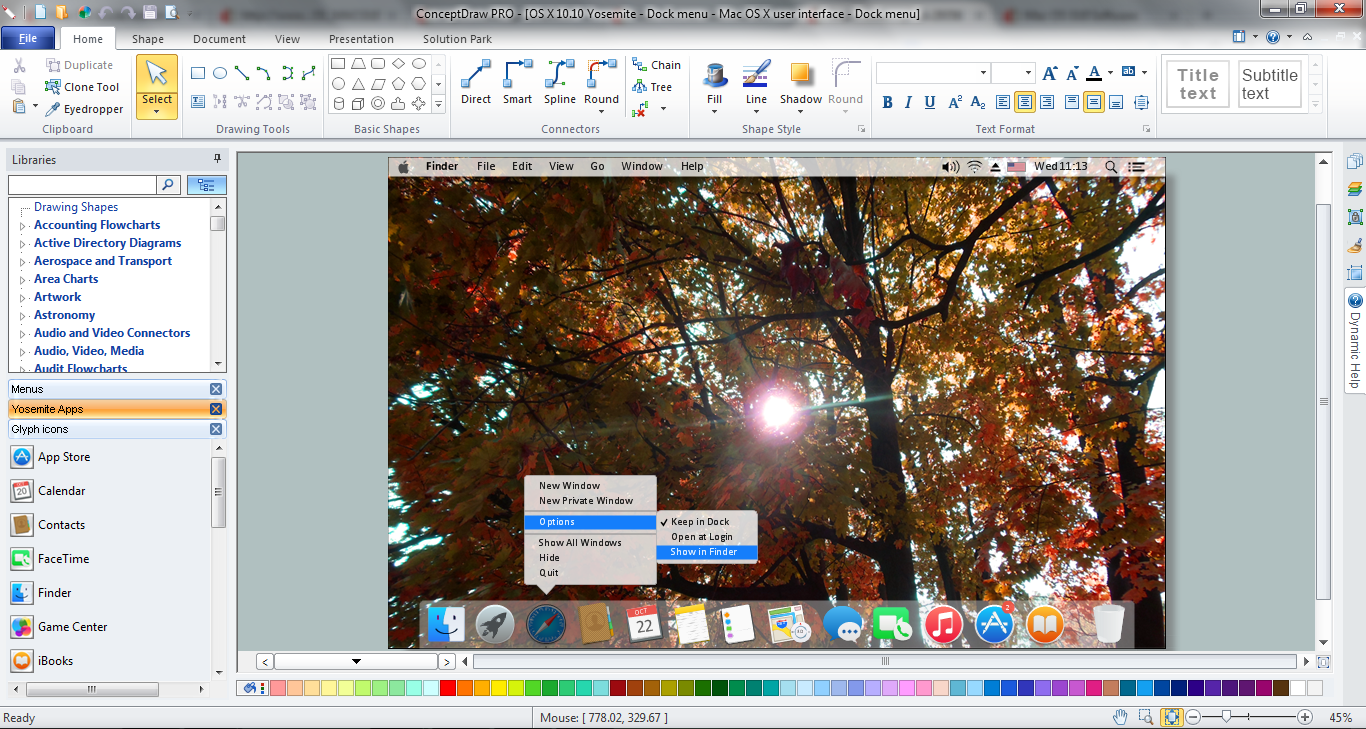
Picture: Mac OS GUI Software
Related Solution:
While creating flowcharts and process flow diagrams, you should use special objects to define different statements, so anyone aware of flowcharts can get your scheme right. There is a short and an extended list of basic flowchart symbols and their meaning. Basic flowchart symbols include terminator objects, rectangles for describing steps of a process, diamonds representing appearing conditions and questions and parallelograms to show incoming data.
This diagram gives a general review of the standard symbols that are used when creating flowcharts and process flow diagrams. The practice of using a set of standard flowchart symbols was admitted in order to make flowcharts and other process flow diagrams created by any person properly understandable by other people. The flowchart symbols depict different kinds of actions and phases in a process. The sequence of the actions, and the relationships between them are shown by special lines and arrows. There are a large number of flowchart symbols. Which of them can be used in the particular diagram depends on its type. For instance, some symbols used in data flow diagrams usually are not used in the process flowcharts. Business process system use exactly these flowchart symbols.
Picture: Flowchart Symbols: Meaning and Examples
Related Solution:
Everything about Bookkeeping: Accounting flowchart process. Which symbols to use, how to make a chart.
Picture: Introduction to bookkeeping: Accounting flowchart process
Related Solution:
A model of a system is defined as a set of hierarchical diagrams representing the asynchronous process of data transformation from the moment it is input to the system to the moment it is output to the user. To demonstrate how a process transforms the initial data, you should design a data flow diagram using a DFD Library included in ConceptDraw DIAGRAM Solution Park. Start your diagramming experience now!
You can use this library of symbols related to data flow diagrams (DFD) to design data-oriented or process-oriented models along with data process diagrams. This vector objects library It is a part of ConceptDraw solution designed for data flow diagramming, along with corresponding samples and templates. A data flow diagram is a 2D flowchart that depicts the sequence of particular activities and operations operations and activities which is accompanied by the dynamic flow of some data.
Picture: Design Data Flow. DFD Library
Related Solution:
When trying to figure out the nature of the problems occurring within a project, there are many ways to develop such understanding. One of the most common ways to document processes for further improvement is to draw a process flowchart, which depicts the activities of the process arranged in sequential order — this is business process management. ConceptDraw DIAGRAM is business process mapping software with impressive range of productivity features for business process management and classic project management. This business process management software is helpful for many purposes from different payment processes, or manufacturing processes to chemical processes. Business process mapping flowcharts helps clarify the actual workflow of different people engaged in the same process. This samples were made with ConceptDraw DIAGRAM — business process mapping software for flowcharting and used as classic visio alternative because its briefly named "visio for mac" and for windows, this sort of software named the business process management tools.
This flowchart diagram shows a process flow of project management. The diagram that is presented here depicts the project life cycle that is basic for the most of project management methods. Breaking a project into phases allows to track it in the proper manner. Through separation on phases, the total workflow of a project is divided into some foreseeable components, thus making it easier to follow the project status. A project life cycle commonly includes: initiation, definition, design, development and implementation phases. Distinguished method to show parallel and interdependent processes, as well as project life cycle relationships. A flowchart diagram is often used as visual guide to project. For instance, it used by marketing project management software for visualizing stages of marketing activities or as project management workflow tools. Created with ConceptDraw DIAGRAM — business process mapping software which is flowcharting visio alternative or shortly its visio for mac, this sort of software platform often named the business process management tools.
Picture: Process Flowchart: A Step-by-Step Comprehensive Guide
Related Solution:
ConceptDraw DIAGRAM extended with IDEF0 Diagrams solution from the Software Development area of ConceptDraw Solution Park is a powerful diagramming and vector drawing IDEF0 software. All IDEF0 diagrams created in ConceptDraw DIAGRAM are vector graphic documents and can be reviewed, modified and converted to MS Visio XML format. To obtain the IDEF0 Visio documents from ConceptDraw DIAGRAM documents use the wide export possibilities of ConceptDraw DIAGRAM.
Picture: IDEF0 Visio
Related Solution:
Engineering students usually have huge amount of homework. Learning how to develop a technical drawing is one of the necessary skills. Luckily, at the present time, there’s no need to draw it on paper, because there a lot of software tools for it.
This drawing represents the Bearing symbols library, that is the part of the ConceptDraw Mechanical Engineering solution. Bearings are the important components of any movable mechanism. The function of bearing is to align, guide, and support the moving parts in any mechanical construction. Usually they are located between moving and stationary parts, it works as a connection point between them. Using Mechanical Engineering solution and ConceptDraw DIAGRAM one can effortlessly draw engineering diagrams of any complexity.
Picture: Technical Drawing Software
Related Solution:
Developing a software project supposes architecture first. To make it proper, you can use data flow diagram model in your current project.
The data flow diagram represents the Model of small traditional production enterprise that is made using Yourdon and Coad notation. It shows how the data is transfered through a process. According to the notation of Yourdon and Coad a process is represented by circles and data stores are drawn using parallel lines. This DFD was created using the ConceptDraw Data Flow Diagrams solution. Using this solution one can visualize data flow accordingly to the rules of two basic notations used for data flow modeling.
Picture: Data Flow Diagram Model
Related Solution:
Choose which of business design elements you love best.
Design your own style with Business and Finance Solutions from ConceptDraw DIAGRAM.
We created a full set of elements, business samples, templates and libraries with vector clip art for drawing the Business Illustrations.
Mark your report or presentation, pay an attention of audience on your drawings with vector business design elements.
Picture: Business - Design Elements
Related Solution:

