Made with
ConceptDraw
DIAGRAM 17

Four Dimensions Bubble Plot

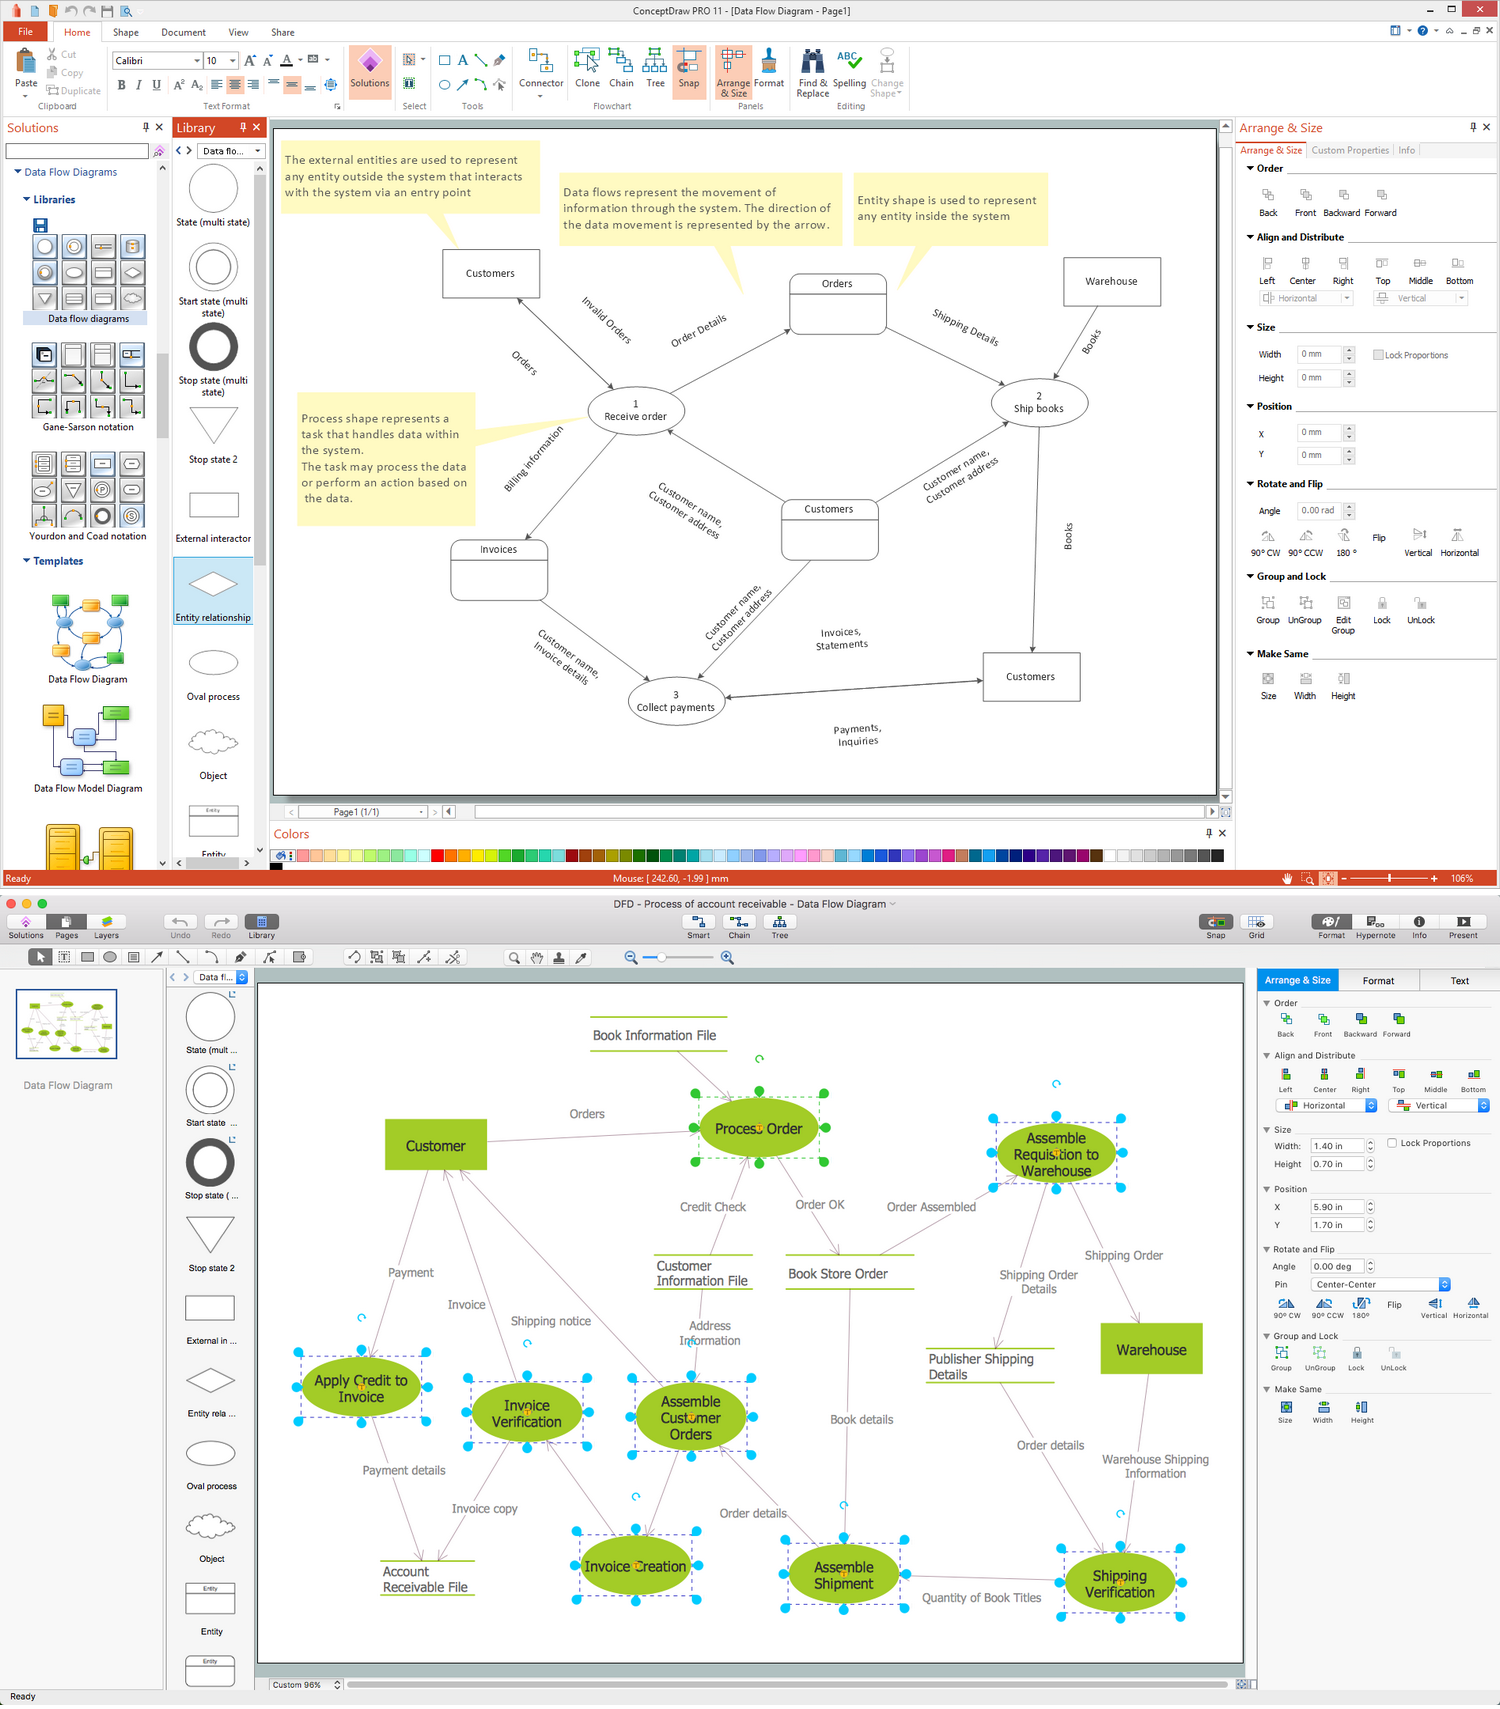
This sample was created in ConceptDraw DIAGRAM diagramming and vector drawing software using the Bubble Diagrams Solution from the "Diagrams" area of ConceptDraw Solution Park.

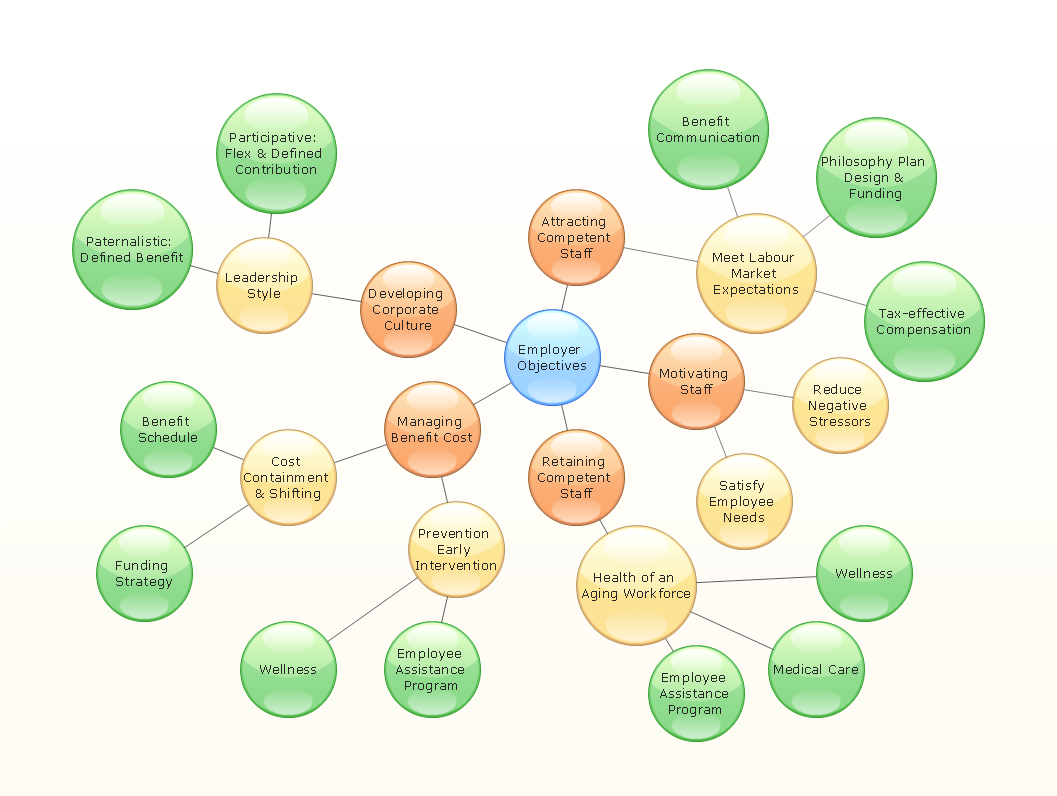
This sample clearly shows the Four Dimensions Bubble Diagram of the distribution of chlorine contaminant in the water source. This Bubble Diagram is very useful in the chemistry, hydrology, and ecology.

Four Dimensions Bubble Plot *

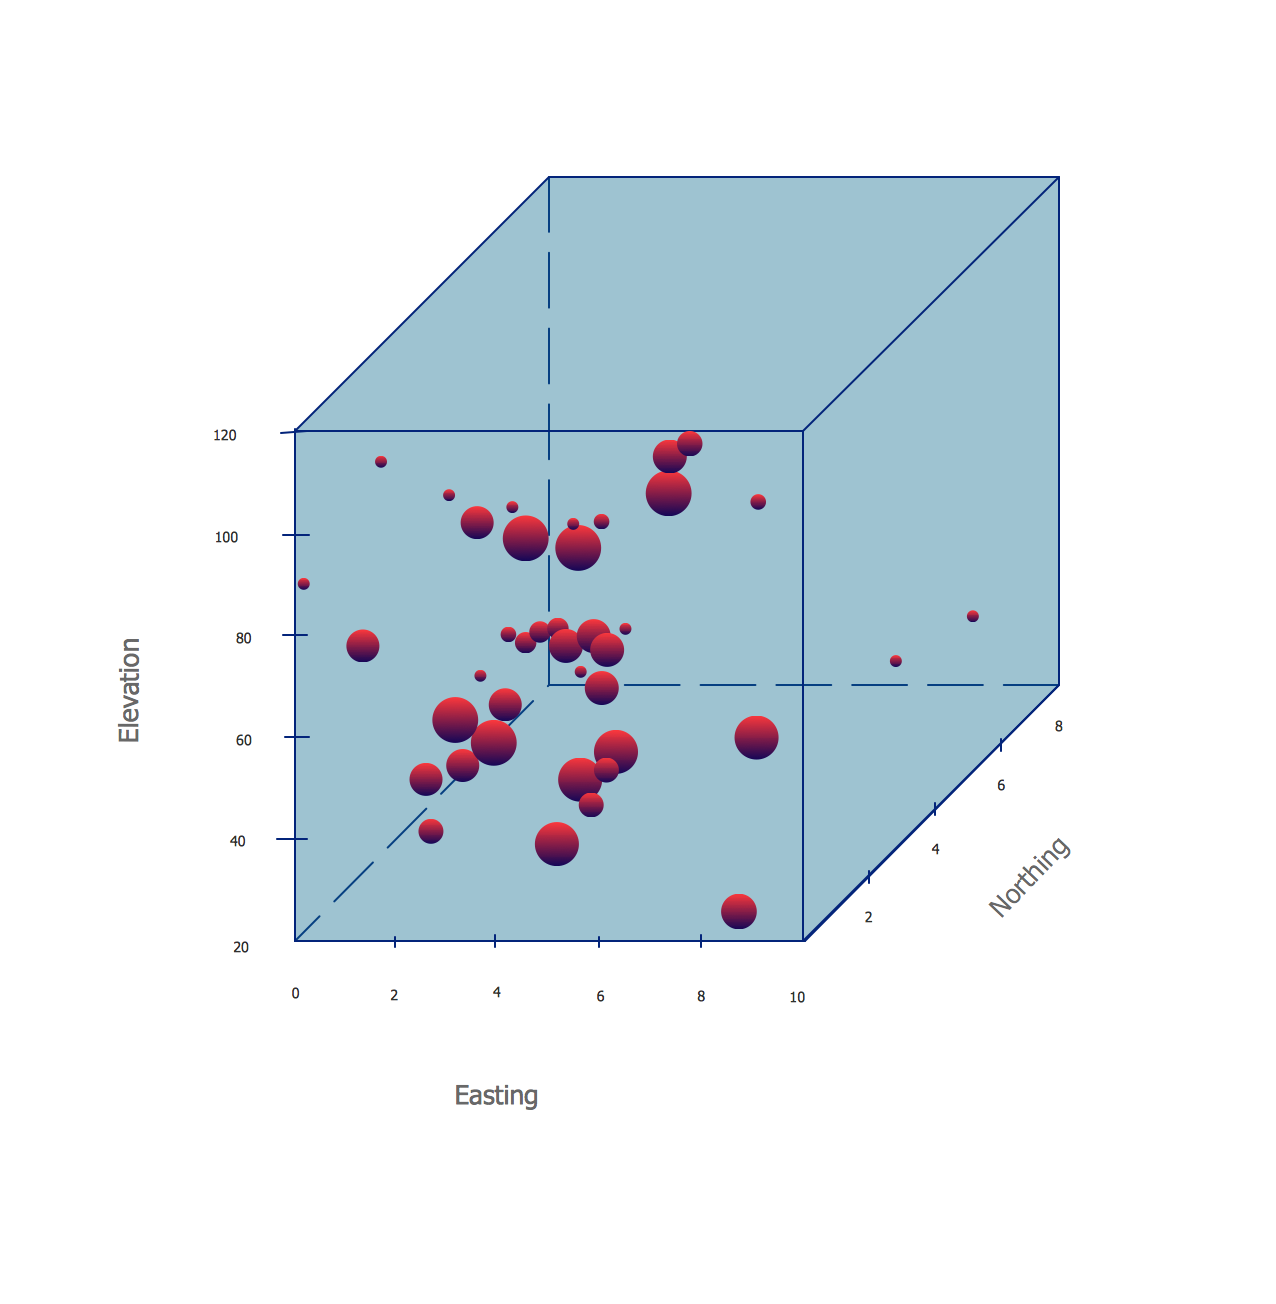
Example 1. Four Dimensions Bubble Plot

Using the Bubble Diagrams Solution for ConceptDraw DIAGRAM you can create your own professional looking Bubble Diagrams quick and easy.

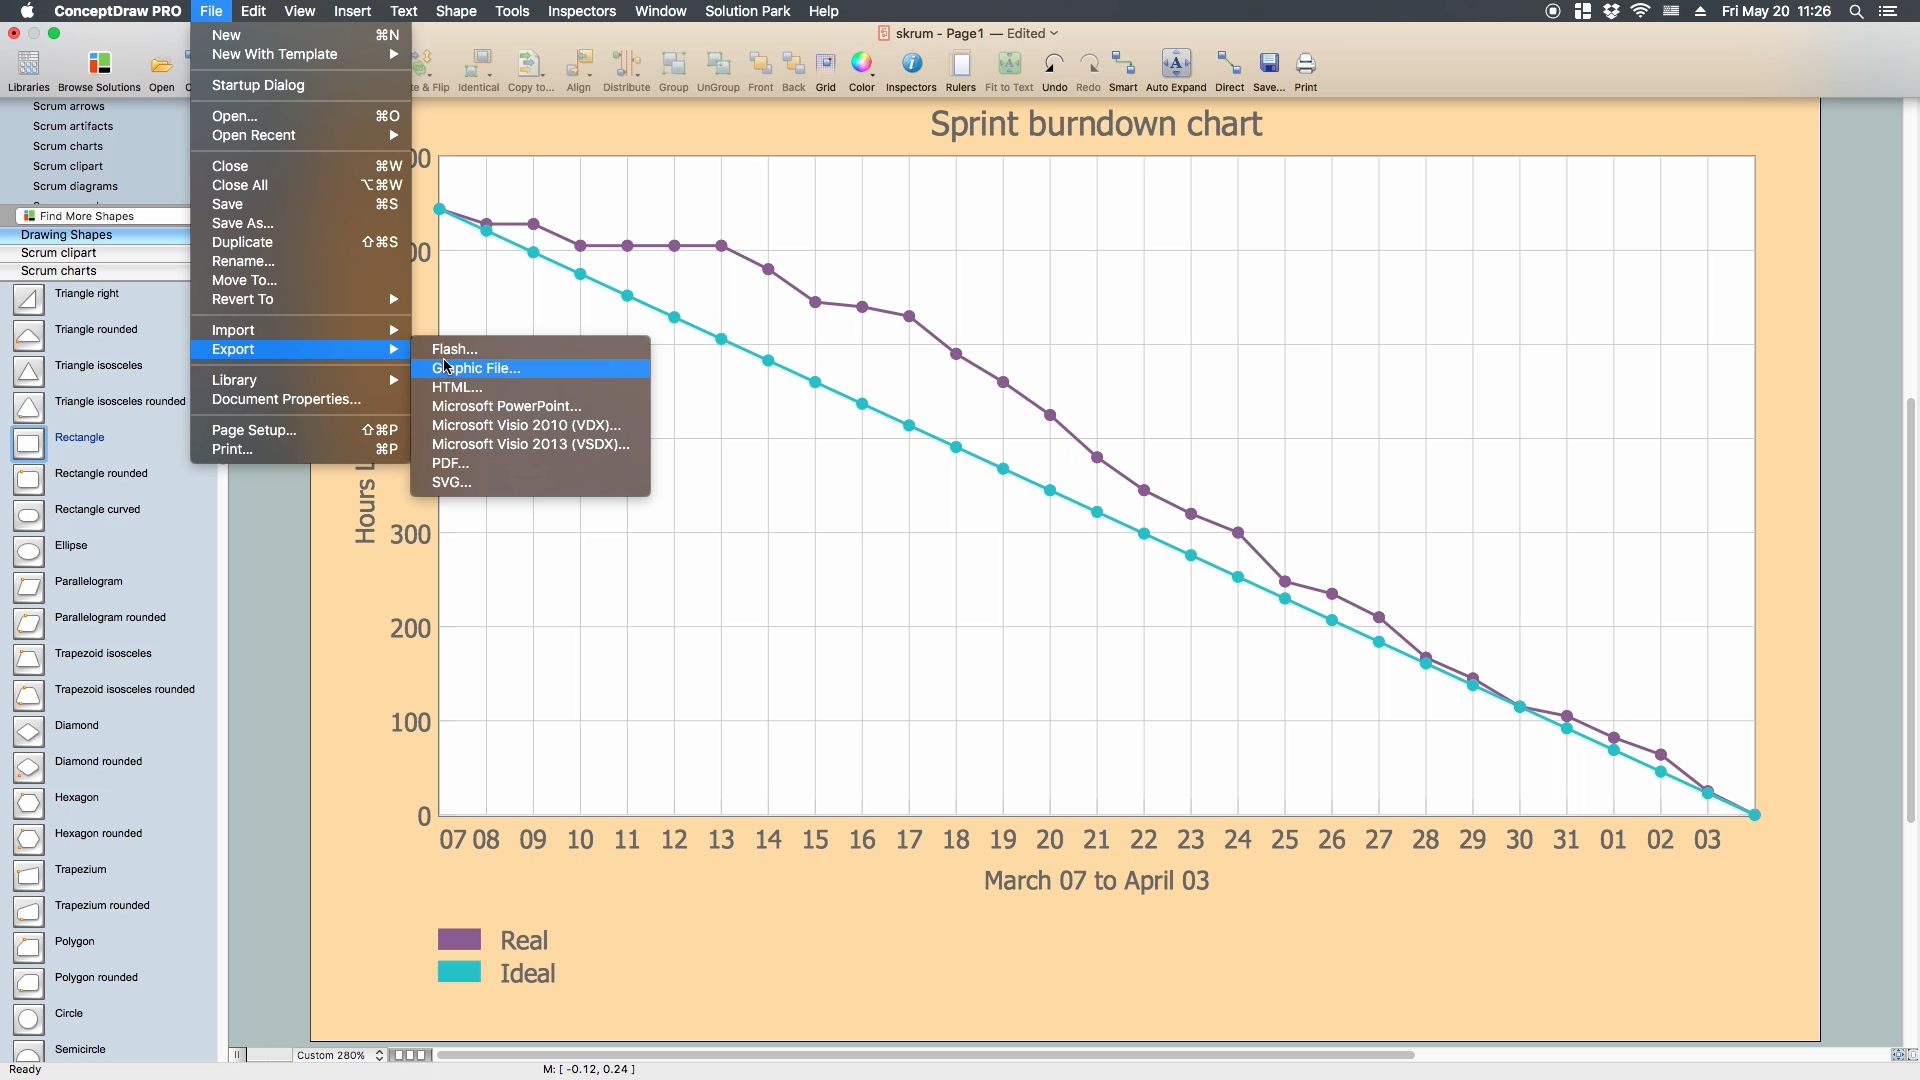
The Bubble Diagrams produced with ConceptDraw DIAGRAM are vector graphic documents and are available for reviewing, modifying, and converting to a variety of formats (image, HTML, PDF file, MS PowerPoint Presentation, Adobe Flash or MS Visio).

Free Download Bubble Plot Software and View All Examples


See also Samples:


TEN RELATED HOW TO's:
Interior design is an art of planning and coordinating the space in a building or on a floor to produce a charming and convenient environment for the client. You can ask professionals for help, or you can create floor plans easily with ConceptDraw DIAGRAM , using diverse libraries or altering numerous templates. You don’t need no formal training anymore to be a designer, isn’t it great? Using a ConceptDraw DIAGRAM floor plan software makes depicting of home or office layout ideas a simple task. It does not require special skills to make detailed and scaled floor plans. Adding furniture to design interior is also a breeze. You can draw and furnish your floor plans with a floor plan software. Moreover, using software for floor planning you gain an opportunity to share your plans and high-resolution images of your designs with clients or stakeholders.Create Floor Plans Easily with ConceptDraw DIAGRAM  *
Picture: Create Floor Plans Easily with ConceptDraw DIAGRAM
Related Solution:
To keep data in tables is useful, but tables are not convenient for presentations or communication. All graphs are intended to make the presentation of data clearly and simply. But are tables always that bad?Tables’ Beauty *
Picture: Tables’ Beauty
Related Solution:
This sample shows the Scatter Plot without missing categories. It’s very important to no miss the data, because this can have the grave negative consequences. The data on the Scatter Chart are represented as points with two values of variables in the Cartesian coordinates. This sample can be used in the engineering, business, statistics, analytics, at the creating the financial and other types of reports.Blank Scatter Plot *
Picture: Blank Scatter Plot
Related Solution:
Competitor analysis is a first and obligatory step in elaboration the proper corporate marketing strategy and creating sustainable competitive advantage. Use powerful opportunities of numerous solutions from ConceptDraw Solution Park for designing illustrative diagrams, charts, matrices which are necessary for effective competitor analysis.Competitor Analysis
Picture: Competitor Analysis
Related Solution:
An example flowchart of marketing analysis shows main steps you have to challenge writing a marketing analysis.Flowchart Example: Flow Chart of Marketing Analysis *
Picture: Flowchart Example: Flow Chart of Marketing Analysis
Related Solution:
This sample was created in ConceptDraw DIAGRAM diagramming and vector drawing software using the Flowcharts solution from the Diagrams area of ConceptDraw Solution Park. A Flowchart is a graphically representation of the process, algorithm or the step-by-step solution of the problem. The Flowcharts have one or more starting and ending points. The geometric figures on the Flowcharts represent the steps of the process and are connected with arrows that show the sequence of the actions.Horizontal Flowchart *
Picture: Horizontal Flowchart
Related Solution:
ConceptDraw DIAGRAM diagramming and vector drawing software extended with Site Plans Solution from the Building Plans Area of ConceptDraw Solution Park is a powerful Site Plan Software.Site Plan Software *
Picture: Site Plan Software
Related Solution:
Electrical plan is a document that is developed during the first stage of the building design. This scheme is composed of conventional images or symbols of components that operate by means of electric energy. To simplify the creation of these schemes you can use house electrical plan software, which will not require a long additional training to understand how to use it. You only need to install the necessary software ant it’s libraries and you’ll have one less problem during the building projection. Any building contains a number of electrical systems, including switches, fixtures, outlets and other lightening equipment. All these should be depicted in a building electrical plans and included to general building documentation. This home electrical plan displays electrical and telecommunication devices placed to a home floor plan. On the plan, each electrical device is referenced with the proper symbol. Electrical symbols are used for universal recognition of the building plan by different persons who will be working on the construction. Not all possible electric symbols used on a certain plan, so the symbols used in the current home plan are included to a legend. The electrical home plan may be added as a separate document to a complete set of building plans.House Electrical Plan Software
Picture: How To use House Electrical Plan Software
Related Solution:
There are many tools to manage a process or to illustrate an algorithm or a workflow. Flowcharting is one of those tools. However, it may be difficult to show complex processes that require multiple attributes or several people in a simple flowchart, so a cross-functional flowchart would be a solution for that situation. To create such flowchart, group processes and steps to labeled rows or columns, and divide those groups with horizontal or vertical parallel lines. It is worth mentioning that there are different types of cross-functional flowcharts, like opportunity or deployment flowchart. This diagram shows a cross-functional flowchart that was made for a trading process. It contains 14 processes, distributed through 5 lines depicting the participants who interact with the process. Also there are connectors that show the data flow of information between processes. The cross-functional flowchart displays a detailed model of the trading process, as well as all participants in the process and how they interact with each other. The lines in the flowchart indicates the position, department and role of the trading process participants.Cross-Functional Flowchart
Picture: Cross-Functional Flowchart
Related Solution:
To support you in your tasks you can use the power of ConceptDraw DIAGRAM providing intelligent vector graphics that are useful for marketing diagramming and ConceptDraw MINDMAP for key marketing mind maps.Business Productivity - Marketing *
Picture: Business Productivity - Marketing
Related Solution:
ConceptDraw
DIAGRAM 17