Sentence Diagrammer
Sentence a grammatical unit of several words, and provides a narrative, question, comment, etc. It begins with a capital letter and ends with proper punctuation. Sentence diagramming allows you to visually present the sentence part function, which helps you build right sentences.
- Sentence diagram intend for illustrating of sentence parts.
- The diagram has best value for visual organizers and satisfy all needs for analysis.
- A grammar study will help students see more clearly of how concrete sentence is organized.
- Sentence diagrams are clear to everyone graphic material for sharing projects.

Learning the new language, for example, Spanish, it is often difficult to understand about the order of the words. Sometime you might forget the way the verb and proverb should be put and the way to make the Interrogative sentences. Negative sentence can be also a hard job to build in Spanish for English-speaking people, because the symbols themselves and their variety is very unusual for Americans and British people.
Attending the Spanish classes, you may find it very useful to structure the grammar rules with help of a sentence diagram. Creating such diagram can be very useful in terms of remembering the right order for the words and the process of creating can be also fun and entertaining as you can leave different options from which you can choose while making your long sentence.
The options can be a choice of different adjectives, which you can add while trying to describe something or, vice versa, they can be a choice of the nouns that can suit one particular adjective. For example, describing some car you can mention its colour, shape, make, how old it is, how fast it can go, etc.
And having some adjective, such as “useful”, you can choose the nouns which can make a sentence with this adjective, for example, “a useful software”. This type of diagram is very well known and widely used in pedagogy as it represents some grammatical structure of some sentence, with help of each it is simpler to explain the order of the words for the teacher.
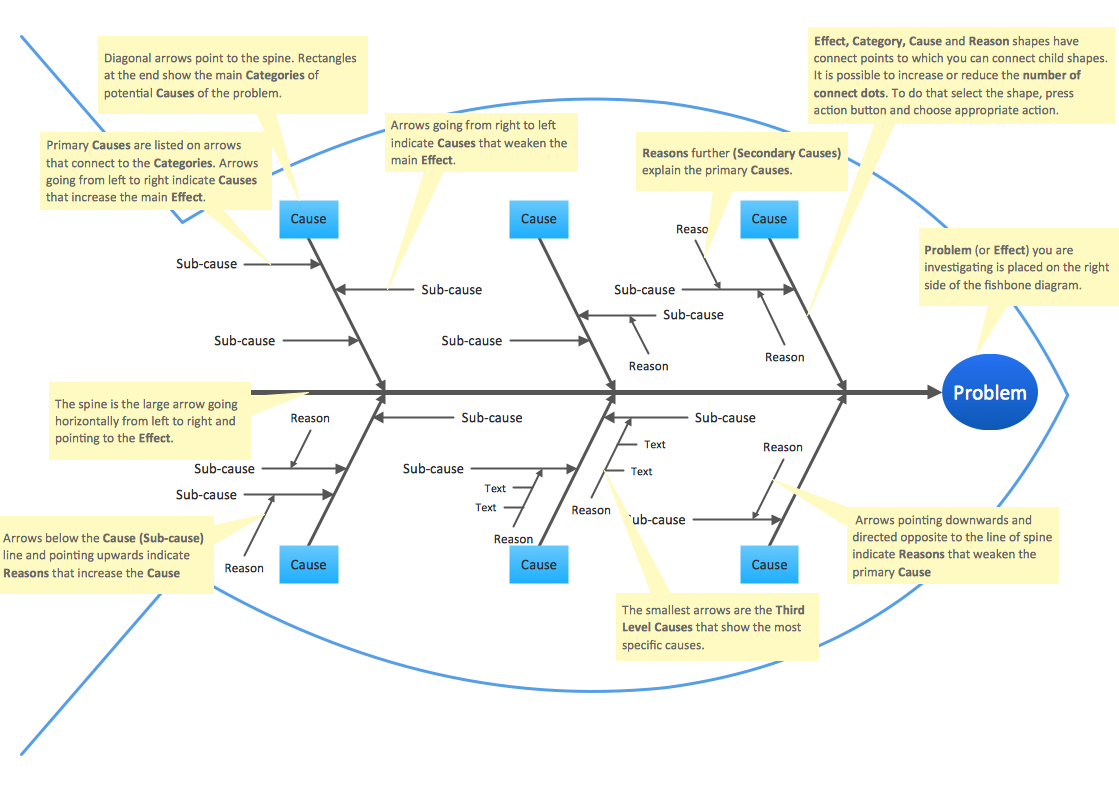
This teacher can diagram the sentences so they look as a fish skeleton with additional words being illustrated along the lines, which go up and down.
This kind of diagram can be also named as a “parse tree”, because of the way it looks like. This very name for it, which is a “parse tree diagram” is very well known in linguistics as it shows the relationship between words and the structure of the sentence. This type of diagrams is very useful in terms of illustrating which order is acceptable for using in a particular language and which one is forbidden.
Thus, you can define the correct and the incorrect order and having the grammar rule structured this way can help you to remember the right order very quickly. To create such diagram can be a hard job if you try to use only the pen and the piece of paper.
It is always simpler to save all of the needed information in a way of a digital image and such image can be created in the appropriate software. Such software can be any, where the drawings of such kind can be made, but the most common for such purposes application is ConceptDraw DIAGRAM one.
This application allows to create any kind of diagram, including the free sentence diagram. ConceptDraw DIAGRAM software is the one, developed by the IT specialists of CS Odessa all together with numerous solutions, which consist of different stencil libraries and samples of already created diagrams, so those, who use ConceptDraw DIAGRAM for the first time, can use the pre-made examples as their drafts for creating something unique and personalized.
For making a free sentence diagram, you can find it very useful to have a Language Learning solution, which can be found in the Science and Education area of ConceptDraw STORE application which is a part of ConceptDraw DIAGRAM software and another product of CS Odessa.
This solution provides the powerful free sentence diagram tools, such as Sentence Diagrams library with set of vector stencils for drawing various Sentence Diagrams, as well as for visualizing grammatical structures, that can assist you in your language learning and help with constructing grammatically correct sentences in any chosen language for you to learn.
The library has such design symbols, which illustrate the Base line, the Subject-verb relationship, Direct object, Modifier, Predicate adjective/nominative, Vertical line, which direction can be specified (it can go up left, down right, up, down or both directed), Up-vertical line, which direction can be also specified the way you want it to go (it can go up left, down right, up, down or both directed), Additional line, Indirect object, Left-compound group, Left-triple group, Right-compound group, Right-triple group and Tripod. Everywhere all along this free sentence diagram you can insert your own text and it can be Subject, Verb, Adjective, Proverb and many other components of the speech.
Sentence a grammatical unit of several words, and provides a narrative, question, comment, etc. It begins with a capital letter and ends with proper punctuation. Sentence diagrams will allow you to visually represent the sentence part function, which will help you to build the right sentences.
It is usually being created for the purpose of illustrating the sentence parts and it has the best value for visual organizers. It can satisfy all of the existing needs for analysing a particular sentence itself and it can be very useful for the students to help them to see more clearly of how a concrete sentence has to be organized.
So if you are a linguistic teacher, whether you word teaching English, Spanish or any other language, the to illustrate the grammar rules in a way of free sentence diagram can be the right way to represent them and to help your students to remember the order much simpler and quicker.
Sentence diagrams are meant to be created for it to be clear for everyone in what way the words have to be used and in which order and it can also be a good and useful thing for writers in order to remind them of a choice of the verbs and adjectives that can be used in combination with the most often used subjects.
To be able to create such diagram you can simply download the ConceptDraw DIAGRAM software and so its Language Learning Solution, which offers the Sentence Diagrams library with set of vector stencils for drawing various Sentence Diagrams, for visualizing grammatical structures that will assist you in language learning and construction of grammatically correct sentences.
It also contains a quantity of templates and samples that were created in ConceptDraw DIAGRAM using the objects from the Sentence Diagrams Library to help you to design your own Sentence Diagrams in only a couple of minutes. They are available from the ConceptDraw STORE.
ConceptDraw DIAGRAM diagramming and vector drawing software extended with Language Learning solution from the Science and Education area provides the powerful free sentence diagrammer tools.

Sample 1.Sentence Diagrammer
Language Learning Solution offers the Sentence Diagrams library with set of vector stencils for drawing various Sentence Diagrams, for visualizing grammatical structures that will assist you in language learning and construction of grammatically correct sentences.
Sample 2. Sentence Symbols — Sentence Diagrams Library Design Elements
Language Learning solution also contains a quantity of templates and samples that were created in ConceptDraw DIAGRAM using the objects from the Sentence Diagrams Library to help you design your own Sentence Diagrams in minutes. They are available from the ConceptDraw STORE.
Sample 3. Language Learning Solution — Compound Predicate with One Direct Object
The following features make ConceptDraw DIAGRAM software the best sentence diagrammer:
- You don't need to be an artist to draw professional looking diagrams in a few minutes.
- Large quantity of ready-to-use vector objects makes your drawing diagrams quick and easy.
- Great number of predesigned templates and samples give you the good start for your own diagrams.
- ConceptDraw DIAGRAM provides you the possibility to use the grid, rules and guides. You can easily rotate, group, align, arrange the objects, use different fonts and colors to make your diagram exceptionally looking.
- All ConceptDraw DIAGRAM documents are vector graphic files and are available for reviewing, modifying, and converting to a variety of formats: image, HTML, PDF file, MS PowerPoint Presentation, Adobe Flash, MS Visio.
- Using ConceptDraw STORE you can navigate through ConceptDraw Solution Park, managing downloads and updates. You can access libraries, templates and samples directly from the ConceptDraw STORE.
- If you have any questions, our free of charge support is always ready to come to your aid.


