Functional Flow Block Diagram
“Flow diagram” is the one which represents some flow or dynamic relations within some system. This “flow diagram” can be also called a “flowchart” as they are used for structuring and ordering some complex system as well as revealing the underlying structure of the elements and their interaction.
There are many types of the flow diagrams, such as “alluvial diagram”, “circular flow of income”, “data flow diagram”, “control flow diagram”, “cumulative flow diagram”, “dynamic stock and flow diagram”, “information flow diagram”, “process flow diagram”, “product flow diagram”, “Sankey diagram”, “state” one, “signal-flow graph” as well as “Functional Flow Block Diagram”.
“Functional Flow Block Diagram”, or “FFBD”, is a time-sequenced and “step-by-step” flow diagram, with the help of which it is convenient to describe some system’s functional flow.
The “Functional Flow Block Diagram notation” was developed in the 50s, and it is quite widely used in classical systems engineering. “Functional Flow Block Diagrams” are the ones, used in the classic business process while modelling different methodologies, as well as flow charts, control flow diagrams, so-called “PERT” diagrams, “IDEF”, “Gantt” charts and flow charts. “Functional Flow Block Diagrams” can be also known as “Functional Flows”, “Functional Flow Diagrams” or “Functional Block Diagrams”.
“Functional Flow Block Diagrams” are usually made using a number of different levels. With their aid it is simpler to show the same tasks, which are identified through functional decomposition and so to display these tasks in their logical and sequential relations. These diagrams can be used for developing the requirements and for identifying the profitable trade studies. This kind of diagram helps incorporate the alternate as well as contingency operations and, as a result, to improve the probability of the particular mission success.
Using the flow diagrams, it is simpler to provide an understanding of some operation of the system in general. These diagrams can be used as a basis for development of both contingency and operational procedures. The pinpoints areas can be also mentioned on the flow diagrams and with the help of them it is also possible to represent different means of satisfying some function, but it is important to take into consideration, that each of the functions which are described with the aid of “FFBD” should be separated and so represented in a way of a single box. Function numbering: Each stage should have an according number scheme and provide the data regarding function origin. These numbers establish identification and relationships that will carry through all Functional Analysis and Allocation activities and facilitate traceability from lower to top levels.
There are a few principles, which is always better to follow in terms of creating the functional flow block diagrams. First of all, each of the diagrams should contain a reference to other functional diagrams in a way of using some particular functional reference. Secondly, the lines, created within such diagrams, (those, which show the connections between different functions) should indicate a function flow, but not an intermediate activity. Also these diagrams should be laid out for the flow direction to go from the left side to the right one. There are often arrows used within such diagrams and they are there for indicating the different functional flows. A circle also can be used while making such diagram and it can be used for denoting a summing gate. “Bar G” and “G” are used for denoting such conditions as “go” and “no-go”. On such block diagram a function should be represented in a way of a rectangle which contains the function’s title as well as its unique decimal delimited number. A horizontal line can be used too and it is usually there for separating the number from the title itself.
The basic logic symbols for making any “Functional Flow Block Diagram” can be: “AND” (shows the condition when all of the succeeding or the preceding paths are required; this symbol may contain an input with a few outputs or a few inputs with a single output, but never mixed multiple inputs and outputs), “Exclusive OR” (described a condition, when only one of the multiple succeeding or preceding paths is required, but never all of them; this symbol may contain an input with a few outputs, or a few inputs with an output, but never mixed inputs and outputs) and “Inclusive OR” (describes a condition when a few or all of the multiple succeeding or preceding paths are being required).
Every “Functional Flow Block Diagram” should contain a name of the person or an organization, which created this diagram, a date, showing when this diagram was created, a unique number of the function, which is diagrammed, and also a unique function name of that function, which is being diagrammed.
There are so many other block diagrams as well as “flow” ones, apart from the Functional Flow Block Diagram and you can always make any wanted with the help of ConceptDraw DIAGRAM as this software allows you to make the needed chart, flowchart, scheme, plan, schematics, drawing, diagram, including any of the existing “flow diagrams” and “block diagrams” within only a very short period of time as the Block Diagrams solution from the "Diagrams" area for ConceptDraw Solution Park, which can be found on this site and so downloaded for using, provides the necessary tools, including the examples of Functional Flow Block Diagrams of any complexity which can be used for making your own great looking diagram in ConceptDraw DIAGRAM
Having ConceptDraw DIAGRAM software as well as the needed solutions can simplify your work with making any needed drawing as well as save your time as it is well known that “time is money”, so getting the convenient and very useful application can save both — your time and your money. Try it as well as solutions and see the difference with any other applications you ever used.
You need to draw a Functional Flow Block Diagram? You are an artist? Now it doesn't matter. With Block Diagrams solution from the "Diagrams" area for ConceptDraw Solution Park you don't need more to be an artist to design the Functional Flow Block Diagram of any complexity.
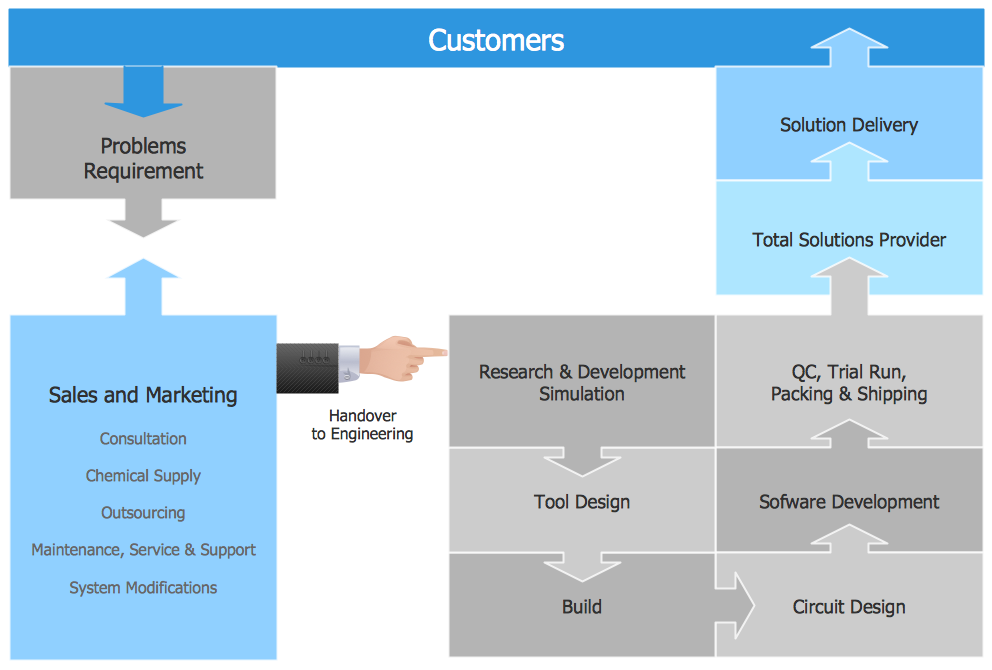
Example 1. Functional Flow Block Diagram - Total Solution Process
Block Diagrams Solution includes 5 libraries with 190 vector objects which will allow to draw any Functional Flow Block Diagram:
- Block Diagrams
- Raised Blocks
- Blocks with Perspective
- Callouts
- Connectors

Example 2. Block Diagrams Library Design Elements
Don't forget to use the colors, to make color accents — they help to make your diagram bright, beautiful, attractive, and certainly successful on various conferences, in publications, etc.

Example 3. Functional Flow Block Diagram — Six Markets Model
The Functional Flow Block Diagrams you see on this page were created in ConceptDraw DIAGRAM using the tools of Block Diagrams Solution. They are included in Block Diagrams Solution and available from ConceptDraw STORE. An experienced user spent 5-10 minutes creating every of them.

Example 4. Block Diagrams Solution
Use the Block Diagrams Solution for ConceptDraw DIAGRAM software to create your own professional looking Functional Flow Block Diagram fast and easy, and then successfully use it in your work activity.
All source documents are vector graphic documents. They are available for reviewing, modifying, or converting to a variety of formats (PDF file, MS PowerPoint, MS Visio, and many other graphic formats) from the ConceptDraw STORE. The Block Diagrams Solution is available for all ConceptDraw DIAGRAM or later users.
TEN RELATED HOW TO's:
A flowchart is a simple but very functional tool when it comes to understanding a workflow or to removing unnecessary stages from a process. When drawing flowcharts, keep in mind that there are four common types of flowcharts, like document flowcharts and data flowcharts that show control over a data or document flow over a system. To show controls on a physical level, use system flowcharts. In addition, to show controls in a program, you can draw a program flowchart.
This flowchart diagram represents the piece of an article editing process, that involves the author and editor. It was created using the Basic Flowchart notation that consists from the basic flowchart symbols. The start and the end of the process are indicated with "Terminator" symbols. The "Process" symbols show the action steps consisting from making edits and searching for a compromise, when the author does not agree with the suggestions of the editor. The "Process" symbol is the general symbol in process flowcharts. The "Decision" symbol indicates a branching in the process flow. There are two branches indicated by a Decision shape in the current flowchart (Yes/No, Disagree/Agree). This basic flowchart can be used as a repeating unit in the workflow diagram describing the working process of some editorial office.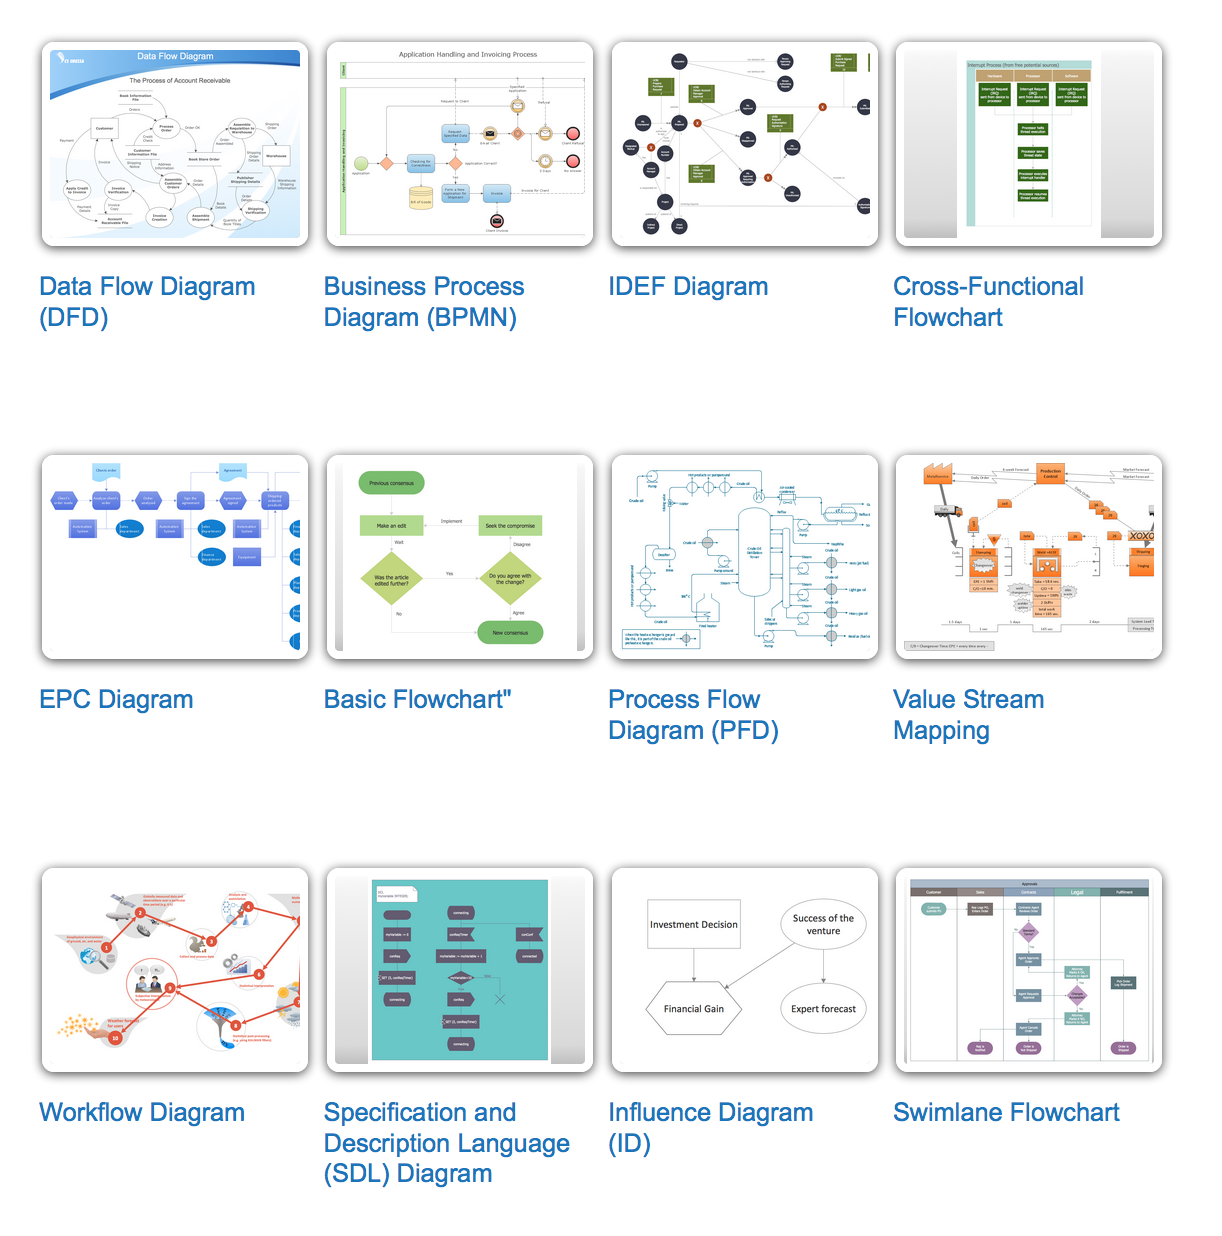
Picture: Types of Flowcharts
Related Solution:
When trying to figure out the nature of the problems occurring within a project, there are many ways to develop such understanding. One of the most common ways to document processes for further improvement is to draw a process flowchart, which depicts the activities of the process arranged in sequential order — this is business process management. ConceptDraw DIAGRAM is business process mapping software with impressive range of productivity features for business process management and classic project management. This business process management software is helpful for many purposes from different payment processes, or manufacturing processes to chemical processes. Business process mapping flowcharts helps clarify the actual workflow of different people engaged in the same process. This samples were made with ConceptDraw DIAGRAM — business process mapping software for flowcharting and used as classic visio alternative because its briefly named "visio for mac" and for windows, this sort of software named the business process management tools.
This flowchart diagram shows a process flow of project management. The diagram that is presented here depicts the project life cycle that is basic for the most of project management methods. Breaking a project into phases allows to track it in the proper manner. Through separation on phases, the total workflow of a project is divided into some foreseeable components, thus making it easier to follow the project status. A project life cycle commonly includes: initiation, definition, design, development and implementation phases. Distinguished method to show parallel and interdependent processes, as well as project life cycle relationships. A flowchart diagram is often used as visual guide to project. For instance, it used by marketing project management software for visualizing stages of marketing activities or as project management workflow tools. Created with ConceptDraw DIAGRAM — business process mapping software which is flowcharting visio alternative or shortly its visio for mac, this sort of software platform often named the business process management tools.
Picture: Process Flowchart: A Step-by-Step Comprehensive Guide
Related Solution:
When searching for a diagramming tool, we look for a powerful and reliable software that would be easy to use. To mention one, ConceptDraw DIAGRAM has all the necessary features to create cross-functional flowcharts (Swim Lanes) quick and effortlessly. You can draw swim lane diagrams in both vertical and horizontal ways.
This cross-functional flowchart displays a payroll process. It explains to each participant his role in the process depending on the category, represented with swimlanes. Using this flowchart, every employee can easily find out what he can expect in terms of salary. Generally a cross-functional diagram enables one to take a look at processes with a wider scope and with more precision than simple flowchart. Business process capturing using cross-functional flowcharts can be useful for stakeholders and managers to define clearly the staff's roles and responsibilities.
Picture: Cross-Functional Flowchart (Swim Lanes)
Related Solution:
The Total Quality Management Diagram solution helps you and your organization visualize business and industrial processes. Create Total Quality Management diagrams for business process with ConceptDraw software.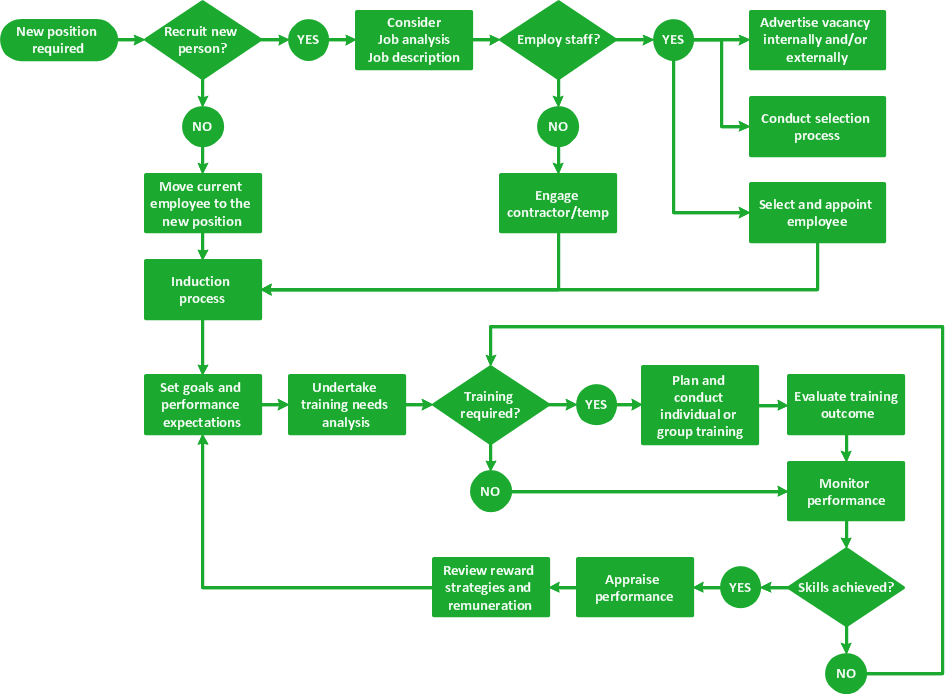
Picture: TQM Software — Build Professional TQM Diagrams
Related Solution:
Use Case Diagram Taxi Service UML. This sample was created in ConceptDraw DIAGRAM diagramming and vector drawing software using the UML Use Case Diagram library of the Rapid UML Solution from the Software Development area of ConceptDraw Solution Park.
This sample shows the work of the taxi service and is used by taxi stations, by airports, in the tourism field and delivery service.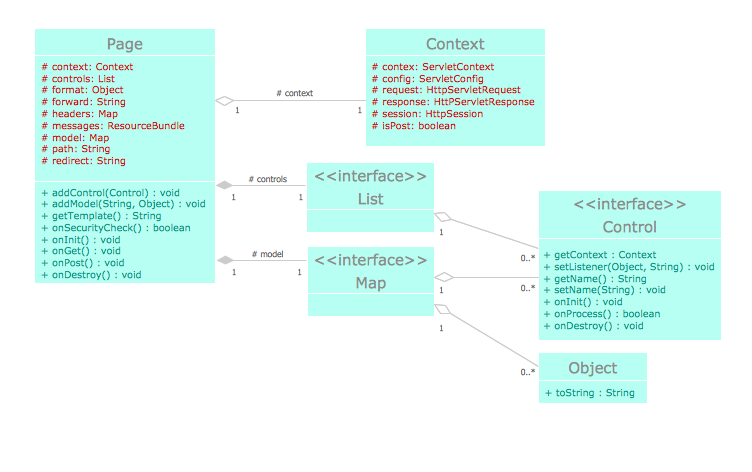
Picture: UML Block Diagram
Related Solution:
Computer networks nowadays are spread all across the world. The large number of parameters, such as geographic scale or communication protocols, can divide networks. One of the most common types of networks is called local area network (LAN). It convenient to represent network examples by means of diagrams.
This local area network (LAN) diagram provides an easy way to see the way the devices in a local network are interacted. The diagram uses a library containing specific symbols to represent network equipment , media and the end-user devices such as computers (PC, mac, laptop) , network printer, hubs, server and finally a modem. There are two types of network topologies: physical and logical. The current diagram represents precisely a physical type of LAN topology because it refers to the physical layout of a local network equipment.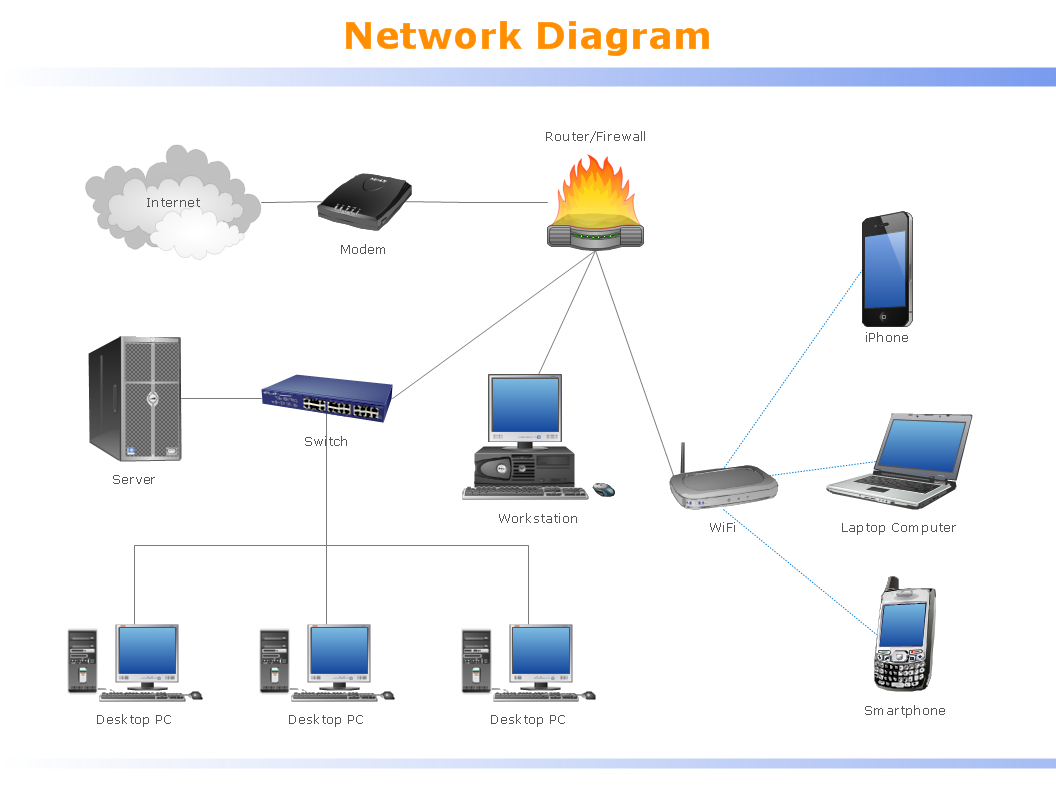
Picture:
What is a Local Area Network?
Examples of LAN Diagrams
Related Solution:
There are many tools to manage a process or to illustrate an algorithm or a workflow. Flowcharting is one of those tools. However, it may be difficult to show complex processes that require multiple attributes or several people in a simple flowchart, so a cross-functional flowchart would be a solution for that situation. To create such flowchart, group processes and steps to labeled rows or columns, and divide those groups with horizontal or vertical parallel lines. It is worth mentioning that there are different types of cross-functional flowcharts, like opportunity or deployment flowchart.
This diagram shows a cross-functional flowchart that was made for a trading process. It contains 14 processes, distributed through 5 lines depicting the participants who interact with the process. Also there are connectors that show the data flow of information between processes. The cross-functional flowchart displays a detailed model of the trading process, as well as all participants in the process and how they interact with each other. The lines in the flowchart indicates the position, department and role of the trading process participants.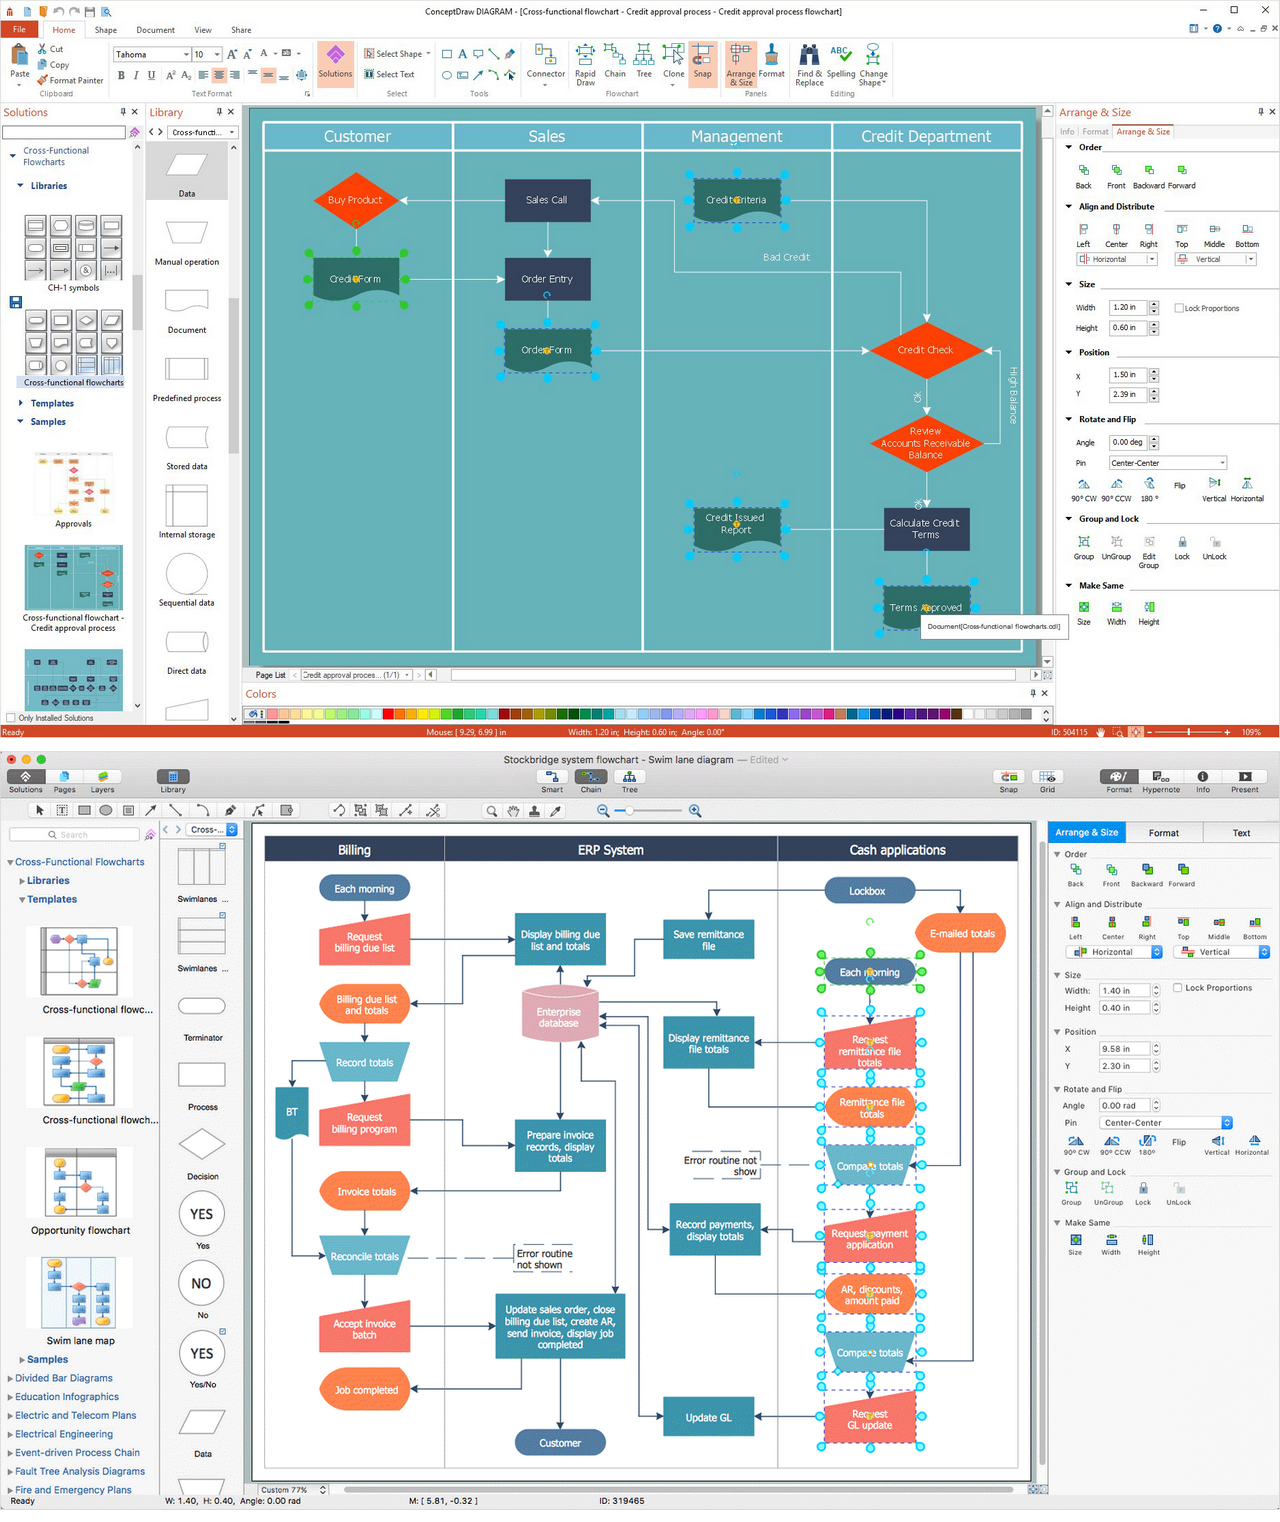
Picture: Cross-Functional Flowchart
Related Solution:
This template shows the Context Diagram. It was created in ConceptDraw DIAGRAM diagramming and vector drawing software using the Block Diagrams Solution from the “Diagrams” area of ConceptDraw Solution Park.
The context diagram graphically identifies the system. external factors, and relations between them. It’s a high level view of the system. The context diagrams are widely used in software engineering and systems engineering for designing the systems that process the information.
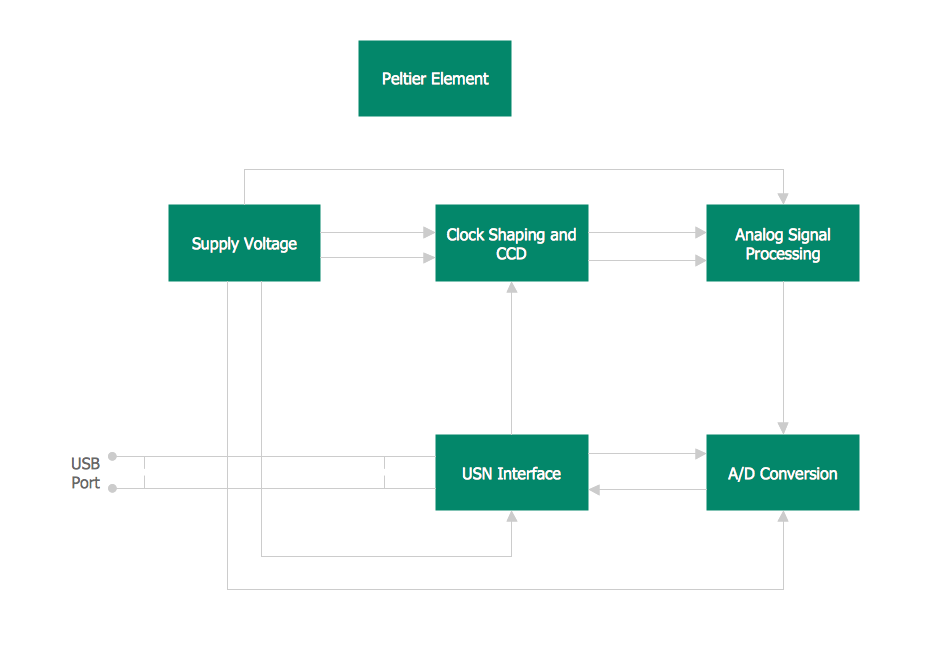
Picture: Context Diagram Template
Related Solution:
Use the libraries from the Block Diagrams solution to draw block diagrams for your business documents, presentations and websites in a few minutes.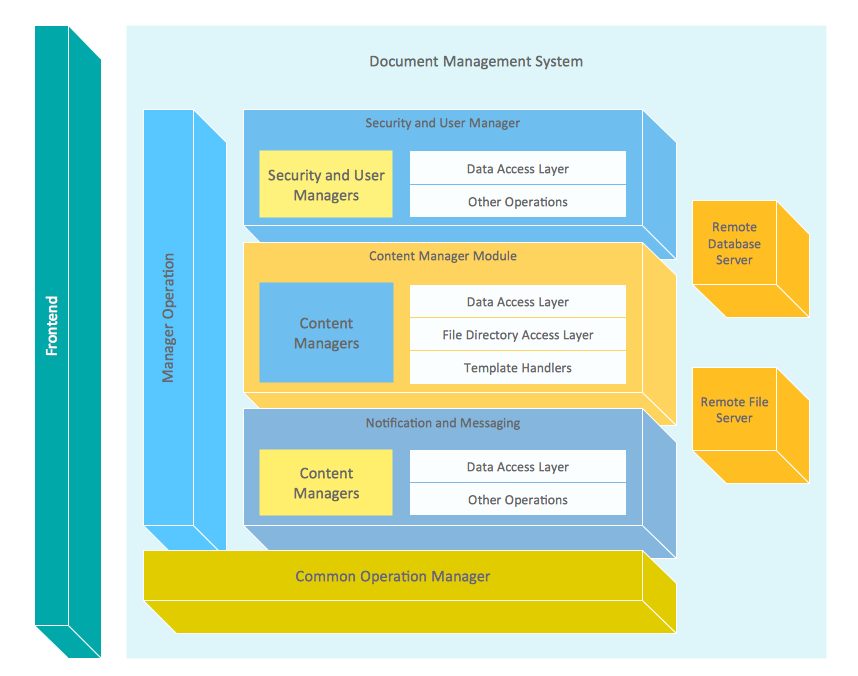
Picture: Block Diagram
Related Solution:
The behavior of worker in organization is influences organizational effectiveness. A simple block diagram made with ConceptDraw Block diagrams solution can improve the understanding of expectations of workers regarding what they l contribute to organization and what they wait to obtain. Making block diagram depicting the individual behavior in organization is used in HR management to obtain an optimal and positive overall contribution to the organization.
The behavior of worker in organization is influences organizational effectiveness. A simple block diagram made with ConceptDraw Block diagrams solution can improve the understanding of expectations of workers regarding what they l contribute to organization and what they wait to obtain. Making block diagram depicting the individual behavior in organization is used in HR management to obtain an optimal and positive overall contribution to the organization.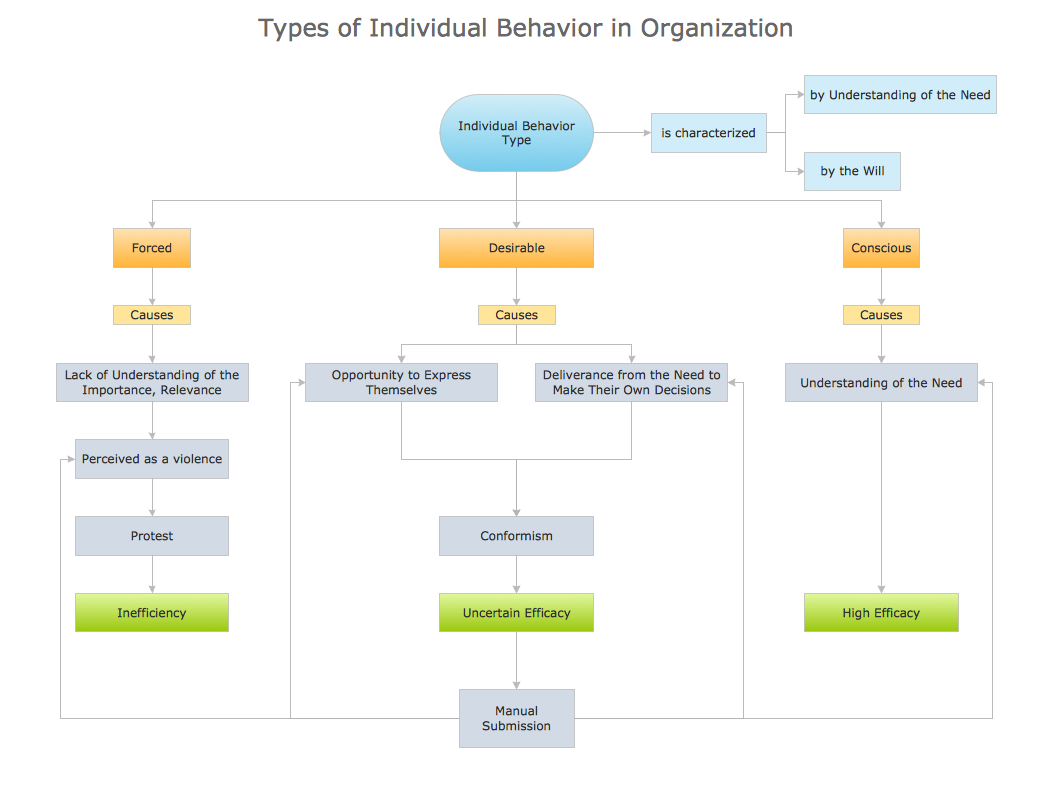
Picture: Basic Diagramming
Related Solution:


