Gantt chart examples
|
All Gantt charts were made using ConceptDraw PROJECT works both on Windows and Mac OS X. It allows to schedule a voluntary number of projects in a single Workspace document and lets easily share tasks and resources among them. ConceptDraw PROJECT shares files among Windows and Mac OS X.  Multi-project Multi-projectGantt Chart  Project Meeting Project MeetingGantt Chart  Web Site Project Web Site ProjectGantt Chart  Business Startup Business StartupProject Sample  Marketing Release
 Gantt Chart  Product Launch Product Launch Project Sample |
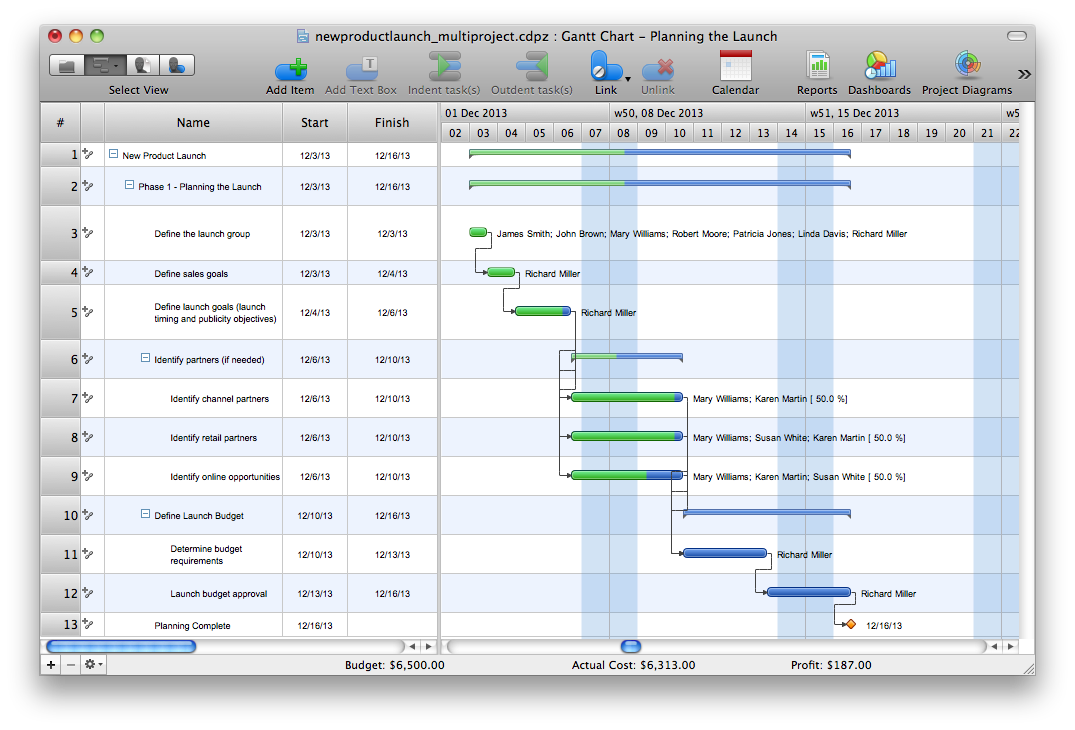
Pic 1. Example of Gantt chart
TEN RELATED HOW TO's:
ConceptDraw DIAGRAM is a very easy-to-use and intuitive database design tool which can save you hundreds of work hours. See database diagram samples created with ConceptDraw DIAGRAM database modeling database diagram software.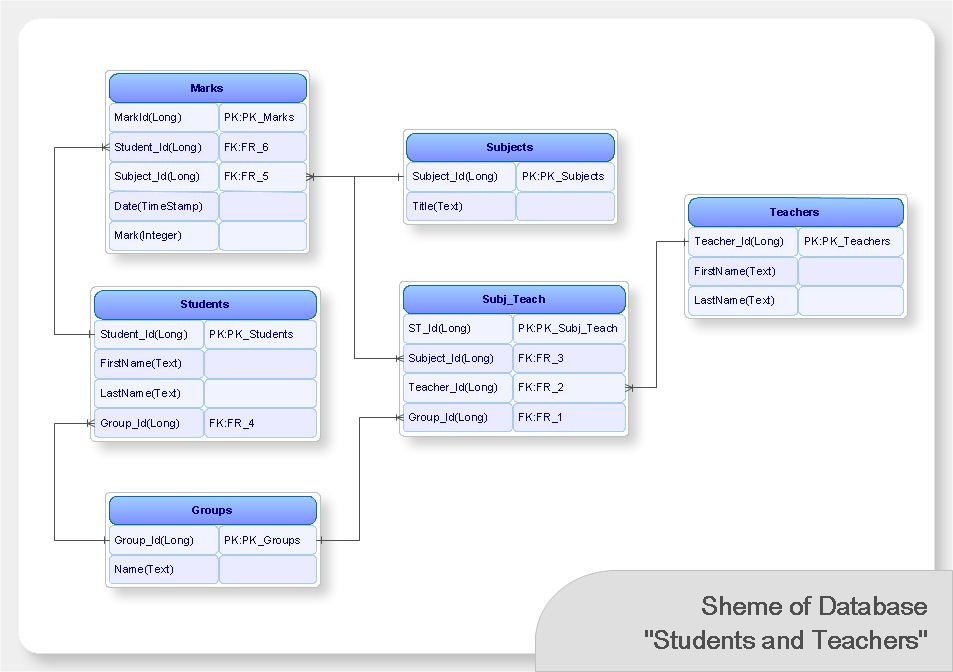
Picture: ConceptDraw DIAGRAM Database Modeling Software
In electronics, a diode is a two-terminal electronic component that conducts primarily in one direction (asymmetric conductance); it has low (ideally zero) resistance to the flow of current in one direction, and high (ideally infinite) resistance in the other. A semiconductor diode is a crystalline piece of semiconductor material with a p–n junction connected to two electrical terminals. Today, most diodes are made of silicon, but other semiconductors such as selenium or germanium are sometimes used.
26 libraries of the Electrical Engineering Solution of ConceptDraw DIAGRAM make your electrical diagramming simple, efficient, and effective. You can simply and quickly drop the ready-to-use objects from libraries into your document to create the electrical diagram.
Picture: Electrical Symbols — Semiconductor Diodes
Related Solution:
A voltage source is a two terminal device which can maintain a fixed voltage. An ideal voltage source can maintain the fixed voltage independent of the load resistance or the output current. However, a real-world voltage source cannot supply unlimited current. A voltage source is the dual of a current source. Real-world sources of electrical energy, such as batteries, generators, and power systems, can be modeled for analysis purposes as a combination of an ideal voltage source and additional combinations of impedance elements.
26 libraries of the Electrical Engineering Solution of ConceptDraw DIAGRAM make your electrical diagramming simple, efficient, and effective. You can simply and quickly drop the ready-to-use objects from libraries into your document to create the electrical diagram.
Picture: Electrical Symbols — Power Sources
Related Solution:
ConceptDraw DIAGRAM is a flowchart design software. There are large collections of professional flowchart symbols for process flow diagrams, standard flowchart symbols and colored basic flowchart symbols. Built-in examples and video lessons allow users to get started immediately and do drawing of virtually any type of flowchart or process flow diagrams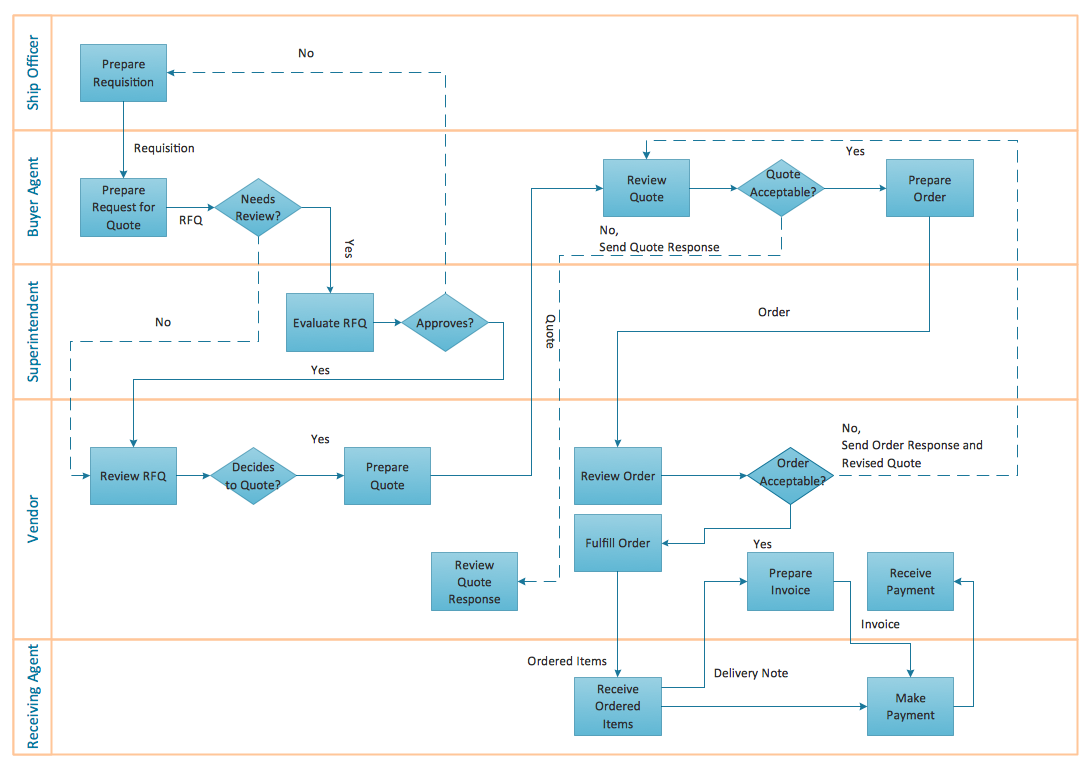
Picture: Flow Chart Creator
Related Solution:
ConceptDraw - Organigram software allows quickly create Organigrams and much more. ConceptDraw DIAGRAM is an ideal tool for Administrative staff to clearly demonstrate the company orgchart professional.
Picture: Organigrams with ConceptDraw DIAGRAM
Related Solution:
Want to create Diagrams for Amazon Web Services architecture? ConceptDraw Solution Park with AWS architecture Solution will help you!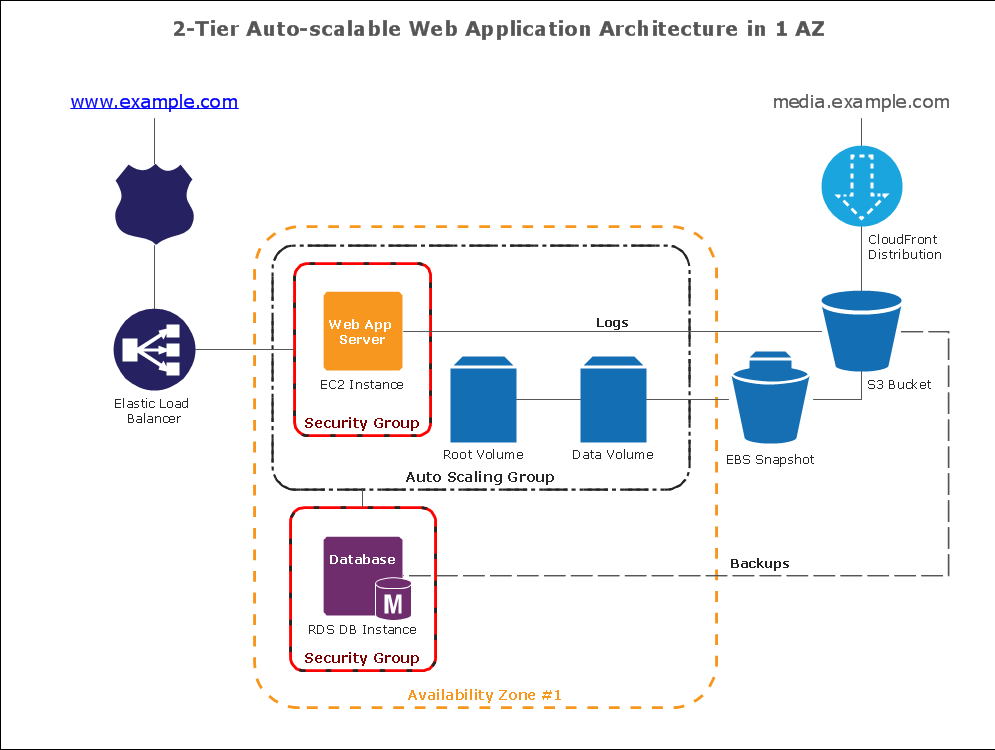
Picture: How To create Diagrams for Amazon Web Services architecture
Sometimes it’s quite useful to look on a problem from another view. To gain insight into an obstacle you should use SWOT analysis, and this will help you to see the whole situation. When composing a SWOT matrix, you divide your problem onto four elements - strengths, weaknesses, opportunities and threats and place them into matrix.
This sample SWOT analysis matrix of the athletic shoes producing company was designed on the base of template provided by ConceptDraw SWOT and TOWS Matrix Diagrams solution. It delivers number of easy-to-use templates and samples of SWOT and TOWS matrices for ConceptDraw DIAGRAM. Applying one of these templates, enables to quickly find out Strengths, Weaknesses, Opportunities, and Threats. After creating a list managers can consider methods the business can use to amplify strengths and to decrease weaknesses; realize opportunities; and avoid threats.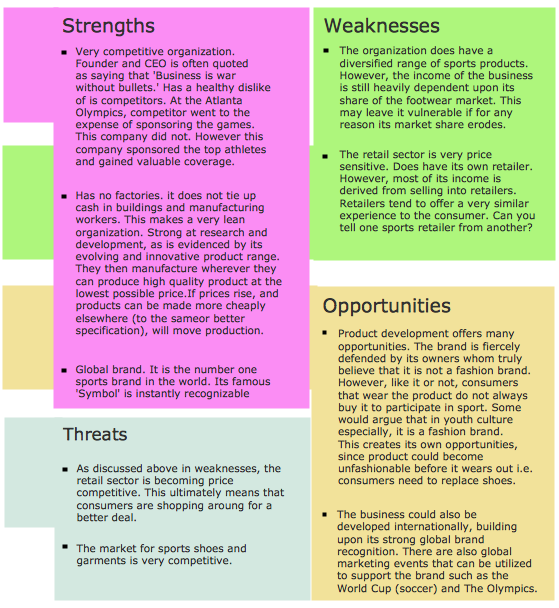
Picture: SWOT Analysis
Related Solution:
ConceptDraw Mind maps can be used to depict a quality process.
Picture: Helpful in all stages of quality management
Related Solution:
Total Quality Management (TQM) system is the management method where the confidence in quality of all organization processes is placed foremost. The given method is widely used in production, in educational system, in government organizations and so on.
Picture: Total Quality Management with ConceptDraw
To design a good workflow you have to focus on process analysis, not using the a drawing tool. This is more possible with ConceptDraw DIAGRAM software that brings the most natural drawing manner you have ever tried. First, define steps and procedures using simple rectangle shape, then select all shapes and click the Chain button to connect all shapes just in one click. After that you are able to modify some relations if needed.
Picture: How to Design a Good Workflow
Related Solution:
ConceptDraw
PROJECT 15