How to Report Task's Execution with Gantt Chart
|
When discussing your project with your team, you sometimes need to focus your audience on different project aspects. Now it’s easy thanks to the visual project diagrams in
’s powerful reporting engine lets you generate a set of tabular reports with just one click, or visualize your project as Radial Tasks Structures, Work Breakdown Structures and Resource Calendars. It also provides you with dynamic Project Dashboards.
Switch to the Reports tab. Here you can see a gallery the Project Diagrams. Click on a diagram’s icon. The diagram will open in ConceptDraw DIAGRAM
|
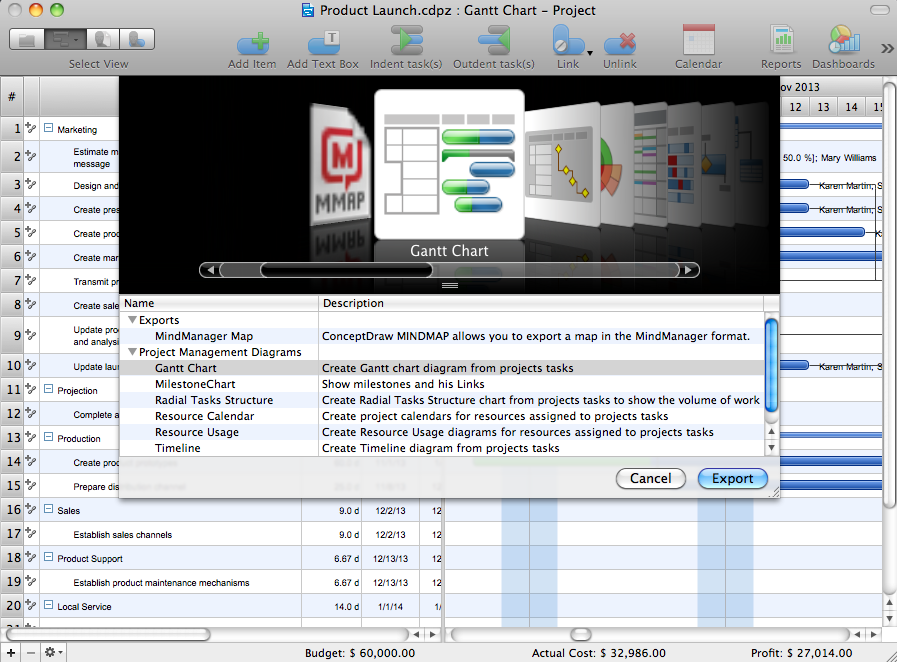
Pic. 1. Project Diagrams gallery.
The Gantt Chart diagram presents a basic view of your project. This can help during the early stages of discussion or when presenting to stakeholders.
PERT charts allow the tasks in a particular project to be analyzed, with attention paid to the time required to complete each task, and the minimum time required to finish the entire project.
The Resource Calendar gives you a two-page document for each resource. The first page is the Resource Usage diagram; the second page is a personal calendar detailing the resource's tasks.
The Timeline diagram gives you a timeline of all your projects and their level of completion on one page.
The Milestone Chart shows milestones with dates and relations contained on a timeline.
Radial Tasks Structure is an alternative way to visually analyze task structure level by level.
The Resource Usage diagram is a multipage document containing resource common loading information and detailed loading for each resource.
The Work Breakdown Structure shows the deconstruction of a project into smaller components.
Transforming project data into different visual forms is a productive way of looking at your project from different perspectives. It also helps you deliver project information in suitable way depending on your objectives and audience.
TEN RELATED HOW TO's:
A flowchart is a widely used type of diagram that visually represents an algorithm, workflow or process, using the boxes of various kinds to depict the steps and connecting them with arrows to show the order of execution these steps. Еhe ConceptDraw DIAGRAM supplied with Accounting Flowcharts Solution from the Finance and Accounting Area of ConceptDraw Solution Park is a powerful diagramming and vector drawing software which ideally suits for designing Ordering Process Flowchart of any complexity.
Picture: Ordering Process Flowchart. Flowchart Examples
Related Solution:
Astronomy and astrology require from the specialists permanent drawing wide variety of illustrations, sketches. It’s convenient for astronomers and astrologers to have software that will help design them quick and easy. ConceptDraw DIAGRAM diagramming and vector drawing software extended with Astronomy solution from the Science and Education area is exactly what they need.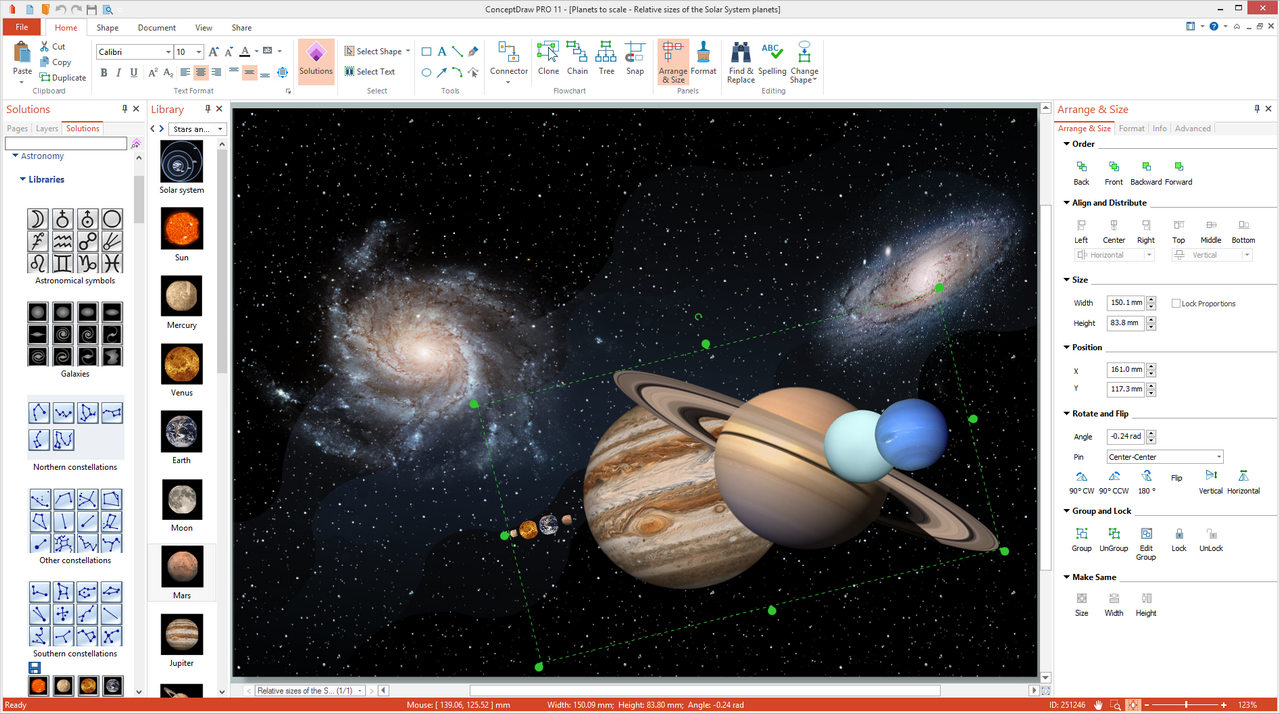
Picture: Astronomy and Astrology
Related Solution:
Why do you need a business process flow diagram? How to use business process diagram software? Explore ✔️ the significance, ✔️ creation process, and ✔️ discover cutting-edge software solutions designed to streamline and optimize your workflows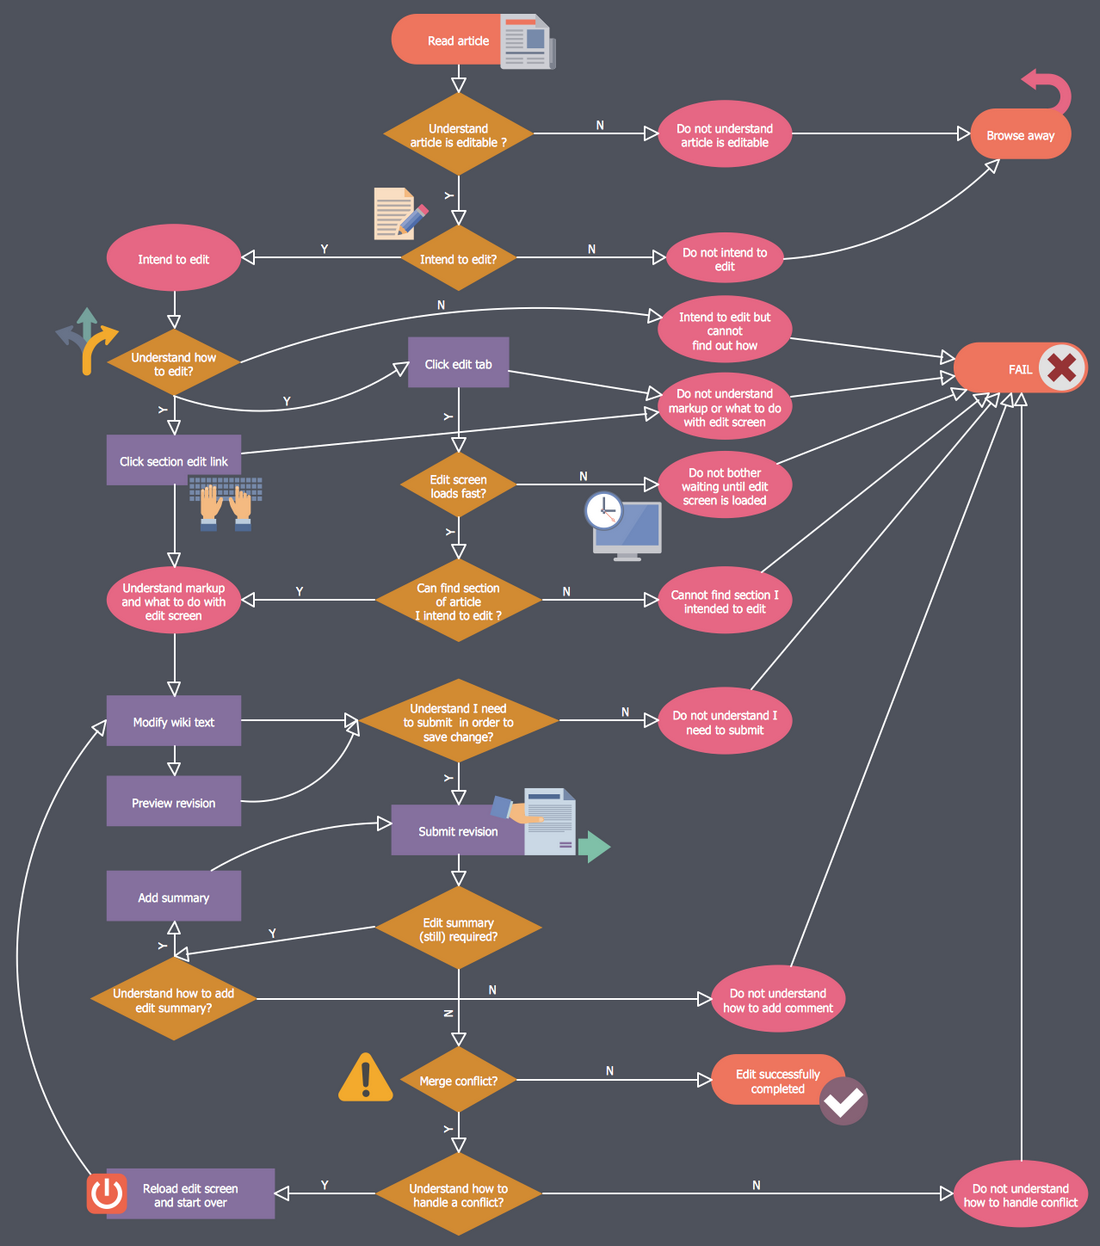
Picture: Business Process Workflow Diagrams & Software
Related Solution:
This sample shows the activity on node (AON) network. The social network analysis (SNA) is the analysis of the social networks, it analyzes the social relationships in terms of network theory that uses nodes and ties. The nodes represent the activities and are displayed as circles labeled with the activity number and completion time in brackets. The nodes are sequentially connected, the ties are represented as lines.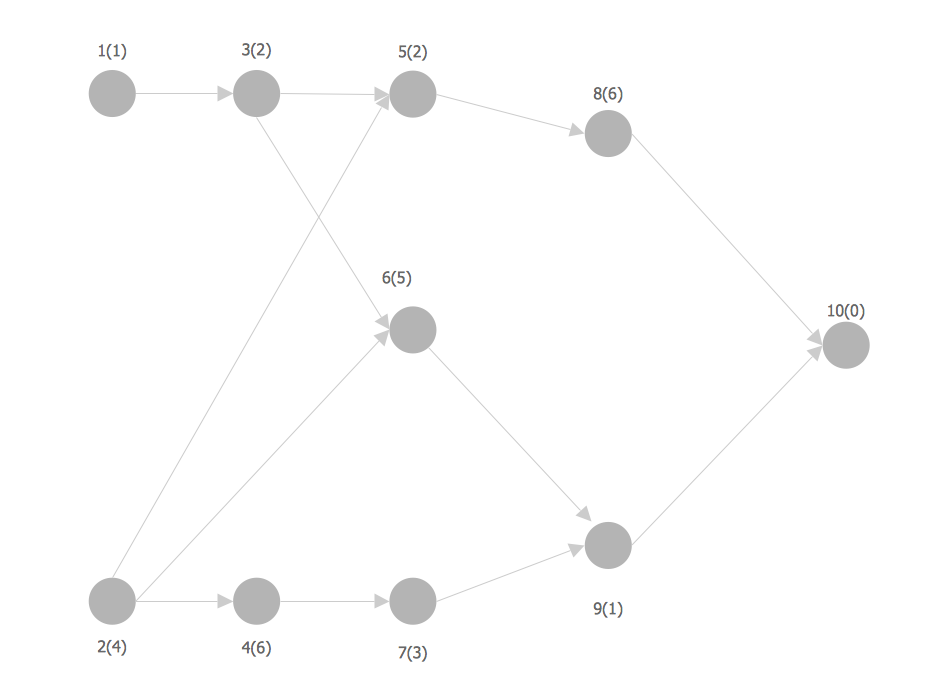
Picture: Network Analysis Activity on Node
Related Solution:
You are probably familiar with diagrams. But have you ever thought that they would be useless? Follow the recommendations and design useful Flowcharts of any type with Flowcharts solution ✔️ easily, ✔️ quickly, ✔️ efficiently
Picture: Diagrams Mean Nothing
Related Solution:
ConceptDraw DIAGRAM diagramming and vector drawing software extended with Sales Flowcharts solution from the Marketing area of ConceptDraw Solution Park offers the set of extensive tools for quick and easy drawing professional looking Sales Process Flowcharts.
Picture: Sales Process Flowcharts
Related Solution:
ConceptDraw DIAGRAM is workflow diagram software enhanced by numerous extentions from ConceptDraw Solution Park. It inludes many professional workflow diagrams, examples and ready to use workflow diagram and workflow symbols. Workflow symbol collections include symbols for Processes, Planning, Scheduling, Flow Control, In-Transit Process Visibility.
The best workflow diagram software you may find is ConceptDraw DIAGRAM. ConceptDraw DIAGRAM is world-known diagramming software that works for both Windows and Mac OS X platforms. The software contains complete set of features allows to draw diagrams faster. ConceptDraw DIAGRAM extended with the Workflow Diagram solution provides additional libraries, templates and samples for drawing professional workflow diagrams.
Picture: Workflow Diagram Software
Related Solution:
Four lessons explaining how to manage your task list in a Gantt chart. You will learn how to adjust your Gantt chart view, how to add/delete tasks or subtasks, how to change tasks hierarchy, how to show/hide subtasks.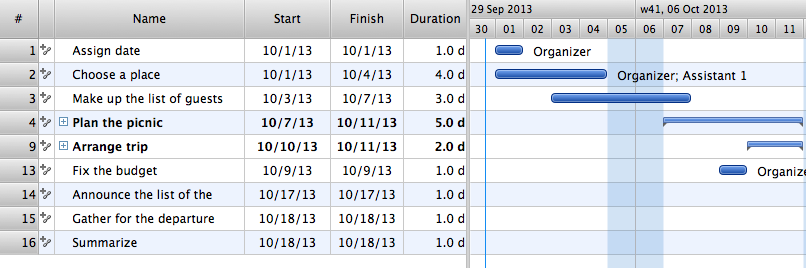
Picture: Managing the task list
Users new to ConceptDraw PROJECT will find the Basic lessons an essential platform for familiarizing themselves with the program′s functions. This video lesson will teach you how to set up task trees and dependencies.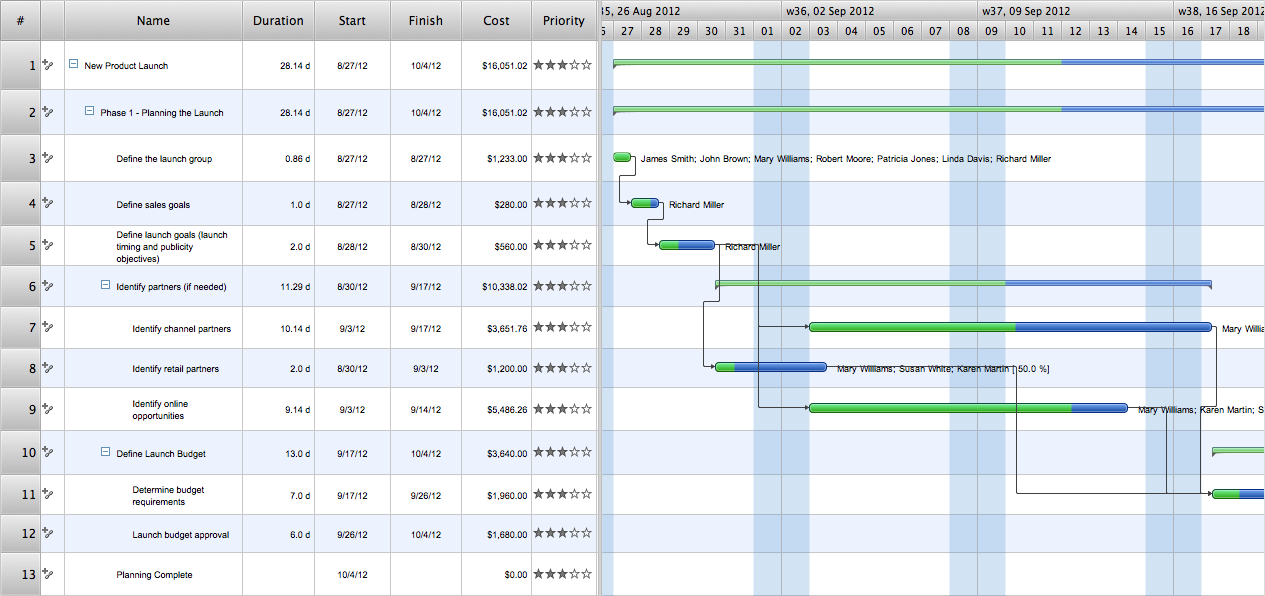
Picture: Project —Task Trees and Dependencies
How to design a Bubble Chart? It’s very easy! All that you need is a powerful software. Never before creation of a Bubble Chart wasn’t so easy as now with tools of Business Diagrams Solution from the Management Area for ConceptDraw Solution Park.
Picture: Bubble Chart
Related Solution:


