Gantt Chart Software
|
Project Planning Chart addresses the time of individual work elements giving a time line for each activity of a project. As it can be seen in the figure. On the chart, everyone is able to see when each activity starts and finishes but there is no possibility to determine when each activity may start or if we can start a particular activity before finishing the immediate predecessor activity. Therefore, we need somehow know the precedence relationships between activities. This is the main reason for using the following tools instead of using exclusively Gantt Charts.
Using the Gantt Chart software you can create and manage projects of unlimited size and length. Add and distribute as many resources as you need for your project.
Benefits of Gantt Chart Software for Windows and Mac OS X
- Speed - to make changes
- Flexibility - to look at alternatives
- Track many projects, each with many tasks
- Set and track milestones for your projects
- Communication - print reports or send software file to stakeholders or post results on web site
- Accuracy
The Gantt Chart is the main interface in It summarizes the tasks in your project and presents them graphically so you can easily view your progress.
|
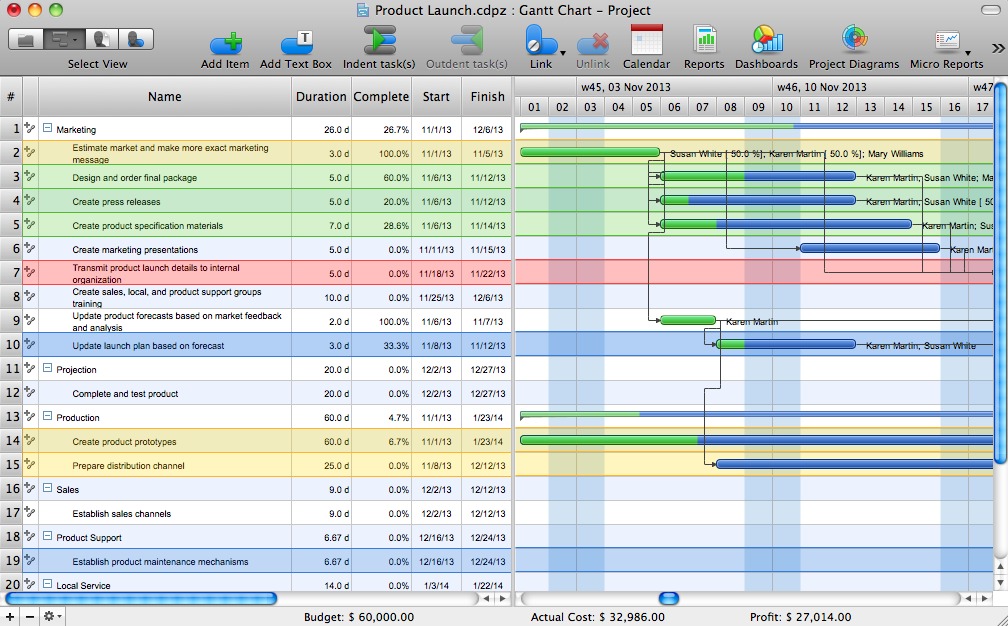
Pic. 1. ConceptDraw PROJECT - Gantt chart view.
The left pane of the Gantt Chart contains a list of tasks and shows their dates, priority, assigned resources, and subtasks. Markers help you identify the different types of task.

Pic. 2. Table part of a Gantt chart.
The right pane of the Gantt Chart shows a timeline of your project. Colored bars cover the dates assigned to each task, and changes of color within those bars show the task’s degree of completion.

Pic. 3. Gantt chart timeline.
The purpose of ConceptDraw PROJECT is to track who does what, when, as well as reporting on the cost of your project over time. It will help you manage your time better by tracking the tasks your project consists of, when they will be executed, who is assigned to each task, and the associated costs.
Learn more about creating a Gantt chart in ConceptDraw PROJECT
TEN RELATED HOW TO's:
ConceptDraw offers you a number of ready-made organizational chart templates which you can use in your drawing. They are grouped in topical sets as organizational chart template files.
Use the Organizational Charts Solution for ConceptDraw DIAGRAM to create your own Organizational Charts of any complexity quick, easy and effective.
The Organizational Charts designed with ConceptDraw DIAGRAM are vector graphic documents and are available for reviewing, modifying, converting to a variety of formats (image, HTML, PDF file, MS PowerPoint Presentation, Adobe Flash or MS Visio XML), printing and send via e-mail in one moment.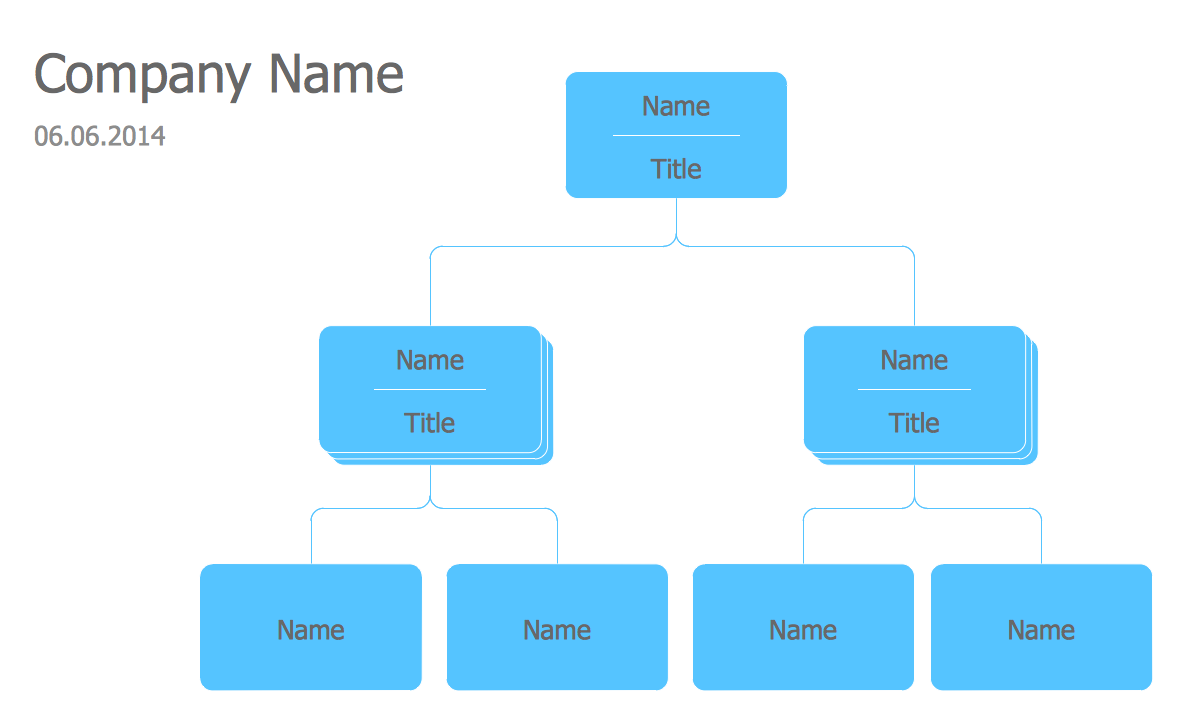
Picture: Organizational Chart Templates
Related Solution:
Process Flow Chart is a visual illustration of overall flow of activities in producing a product or service. How do you make a Process Flow Chart usually? Drawing process flow charts, diagrams and maps is quite complex and lengthy process, especially if you draw free-hand. But now thanks to the ConceptDraw DIAGRAM diagramming and vector drawing software extended with Flowcharts solution from the Diagrams area of ConceptDraw Solution Park this process became simple and fast. A confirmation of this can serve many Process Flow Chart examples included in Flowcharts solution.
Picture: Process Flow Chart Examples
Related Solution:
ConceptDraw DIAGRAM is the best software for illustration the network topologies. It's very easy and quickly to design the network topology diagrams of any kinds and complexity in ConceptDraw DIAGRAM diagramming and vector drawing software using the Computer and Networks solution from Computer and Networks area of ConceptDraw Solution Park.
Picture: Network Topology Illustration
Related Solution:
While studying, many of the students encounter the necessity of remaking class projects, over and over. To facilitate this process you can use special electrical and telecom plan software, which helps altering projects in several clicks. Using templates will fasten your work, and you will have more free time.
This sample represents an electrical and telecommunication floor plan. Electrical and telecom floor plans contain a floor plan , on which imposed the layout of electrical, and telecommunications equipment. They shows electrical and telecom details regarding the current floor of a building: lightening, fixtures, wires, outlets, circuit panels, etc. Using of standart notation of electrical and telecommunication symbols makes the plan understandable for engineers, architects, constructors, specialist in electricity and telecommunications.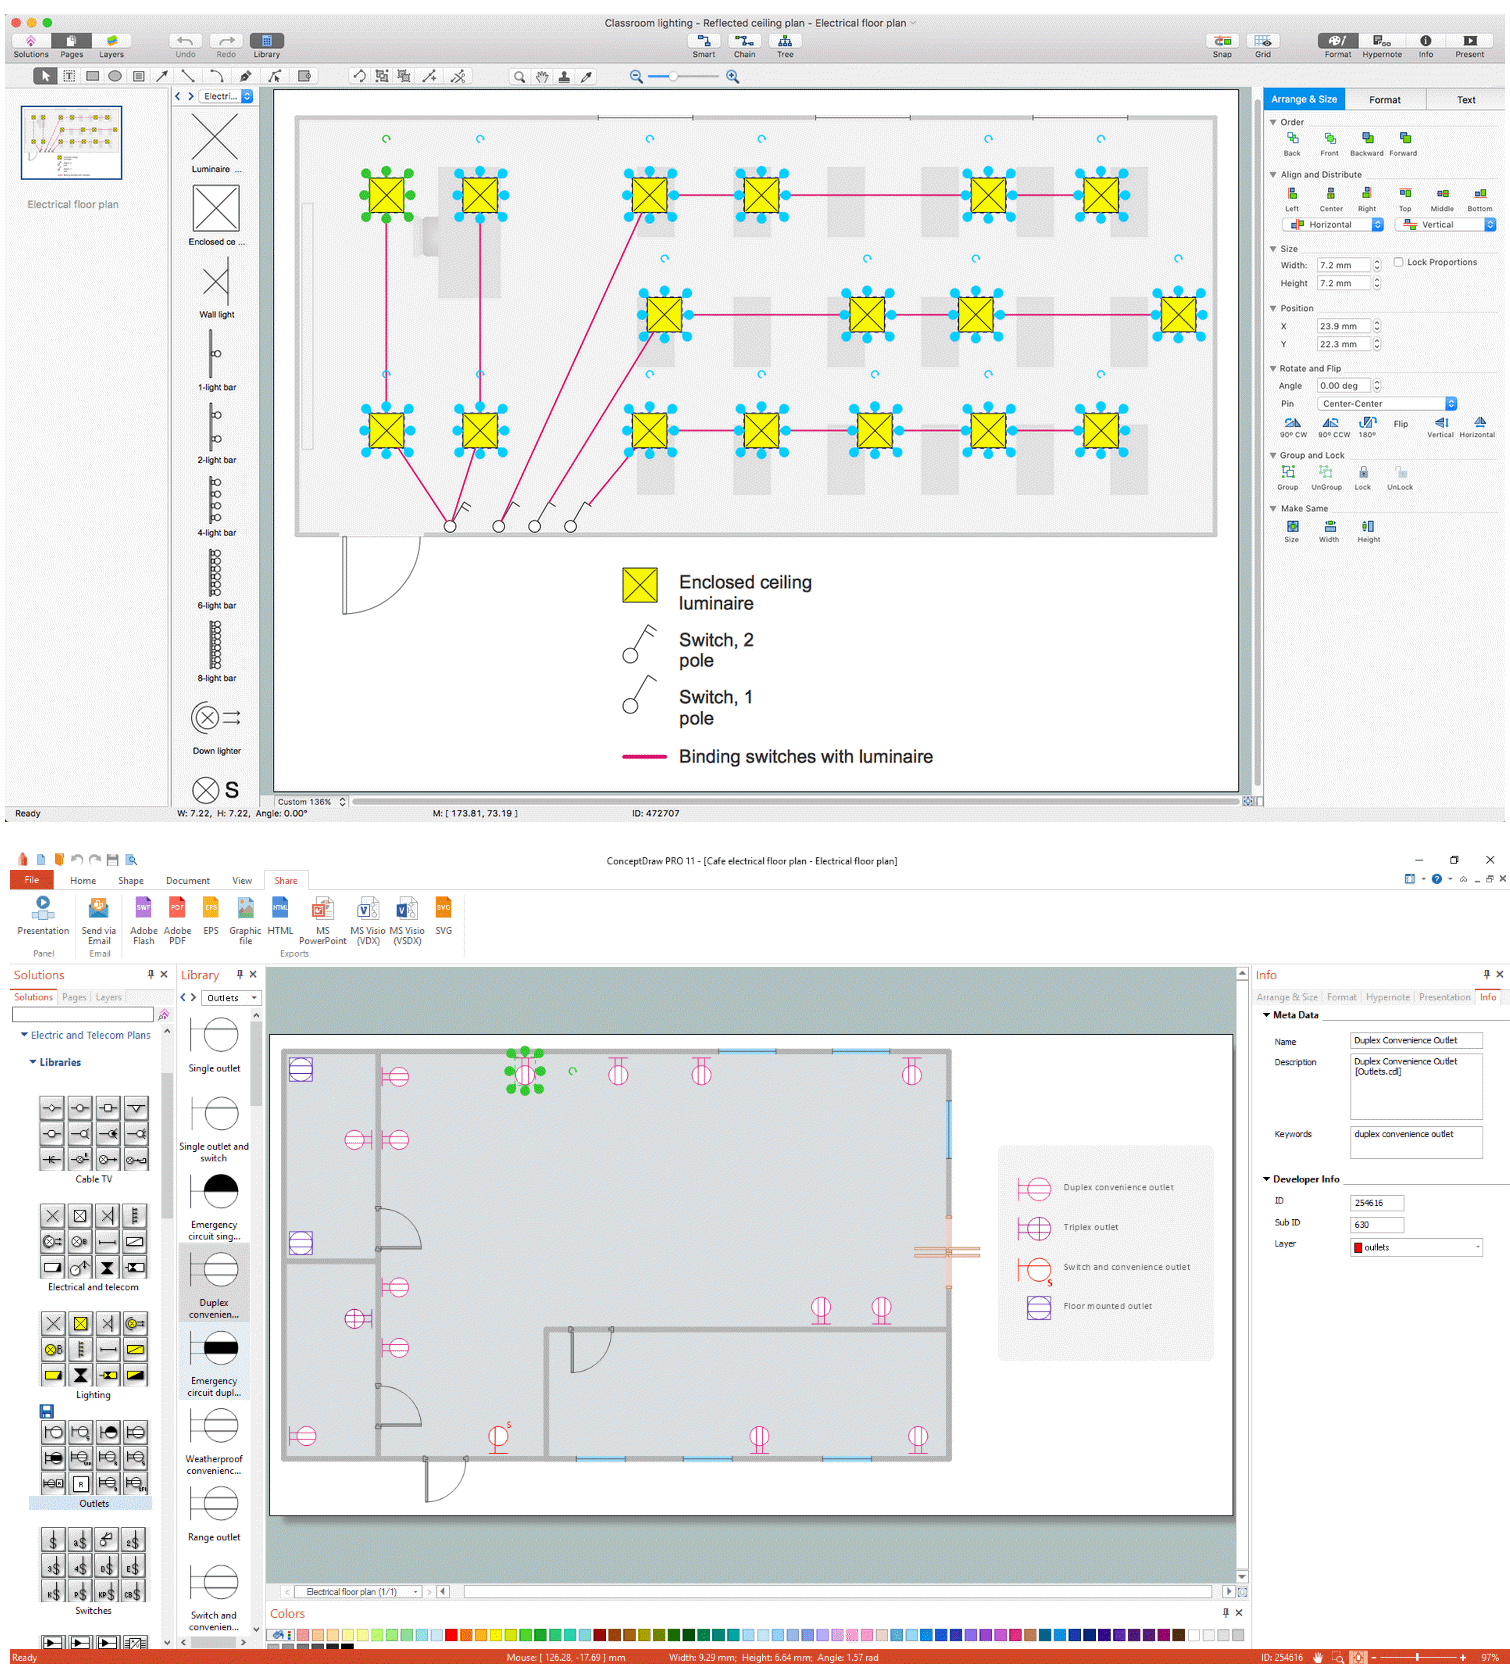
Picture: Electrical and Telecom Plan Software
Related Solution:
Activity on Node Network Diagramming Tool - Activity Network and Project Evaluation and Review Technique, or PERT, charts are a way of documenting and analyzing the tasks in a project.
This sample shows the Activity on node network diagramming method. It was created in ConceptDraw DIAGRAM diagramming and vector drawing software using the Seven Management and Planning Tools solution from the Management area of ConceptDraw Solution Park.
Picture: Activity on Node Network Diagramming Tool
Related Solution:
ConceptDraw DIAGRAM is a business flowchart software includes the wide flowchart examples package.
Picture: Basic Flowchart Examples
Related Solution:
ConceptDraw DIAGRAM is a powerful drawing tool that changes the way diagrams are produced.
Diagrama de Topologia or Topology Diagram helps you see the big picture as you develop a service.
Picture: Diagrama de Topologia
Related Solution:
ConceptDraw Network Drawing Software - Network design software for network drawings with abundant examples and templates.
Create computer network designs, diagrams and schematics using ConceptDraw.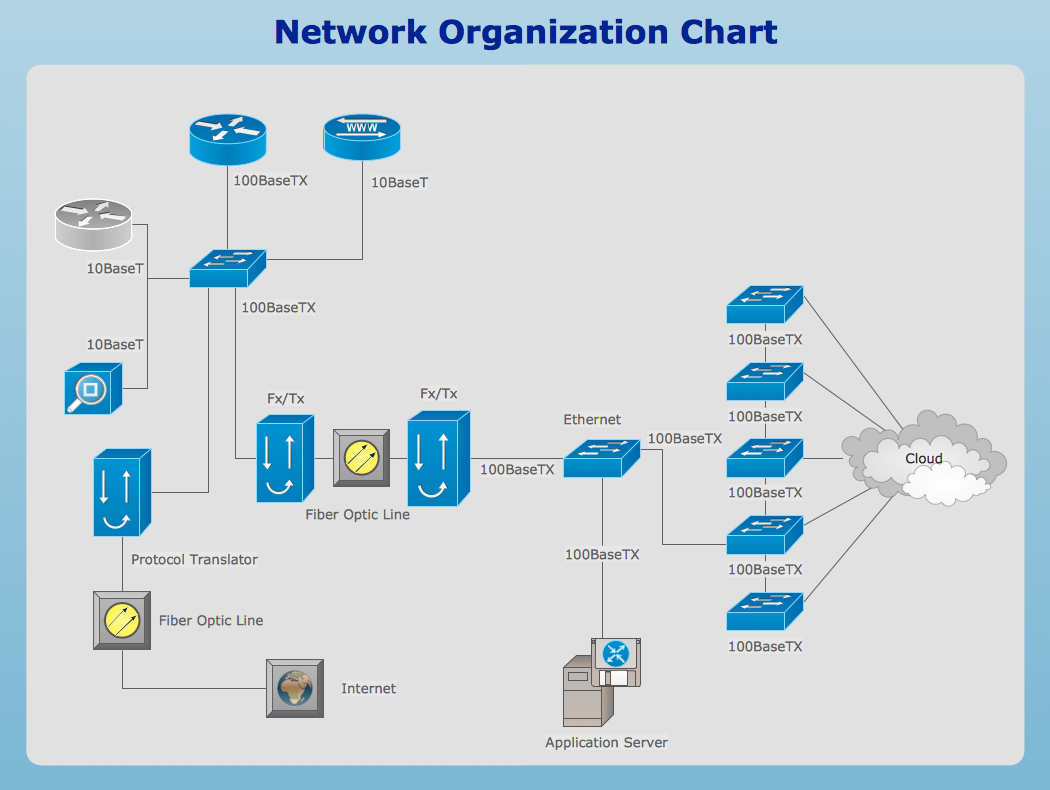
Picture: Network Drawing Software
Drawing ISG Network Diagram using ConceptDraw DIAGRAM stencils
Picture: Network Diagram SoftwareISG Network Diagram
Computer networks nowadays are spread all across the world. The large number of parameters, such as geographic scale or communication protocols, can divide networks. One of the most common types of networks is called local area network (LAN). It convenient to represent network examples by means of diagrams.
This local area network (LAN) diagram provides an easy way to see the way the devices in a local network are interacted. The diagram uses a library containing specific symbols to represent network equipment , media and the end-user devices such as computers (PC, mac, laptop) , network printer, hubs, server and finally a modem. There are two types of network topologies: physical and logical. The current diagram represents precisely a physical type of LAN topology because it refers to the physical layout of a local network equipment.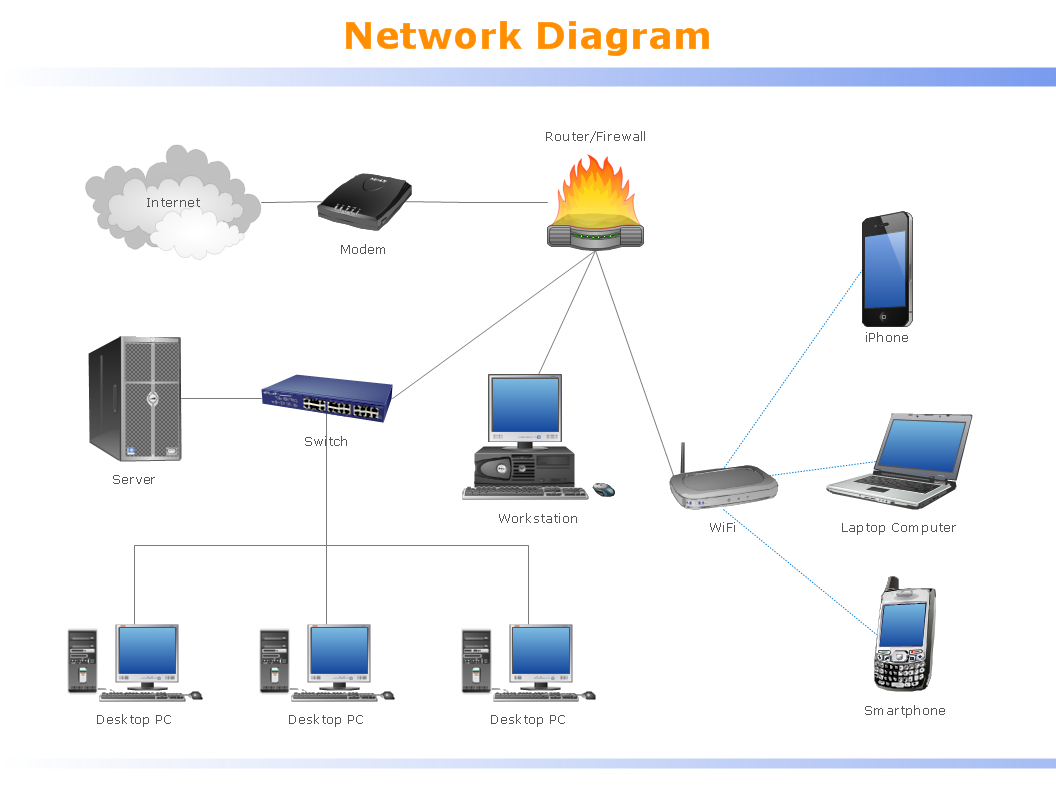
Picture:
What is a Local Area Network?
Examples of LAN Diagrams
Related Solution: