Gantt Chart Templates
PM Easy Solution from the Project Management Area extends with the ability to quickly start a project. It lists task dependencies and relationships making the terative planning easy.

Sample 1. PM Easy Solution in ConceptDraw STORE
You can use the ConceptDraw STORE to choose the New Project Template from the PM Easy Solution from the Collaboration Area. The new document will be instantly opened allowing you to create Gantt Chart and manage your project.

Sample 2. Gantt Chart Template in
lets you the useful possibility to create visual project dashboards and diagrams, generate various kinds of reports with one click. It provides also extensive capabilities of importing and exporting in various formats: Microsoft Project, ConceptDraw MINDMAP, Mindjet MindManager, PDF file.
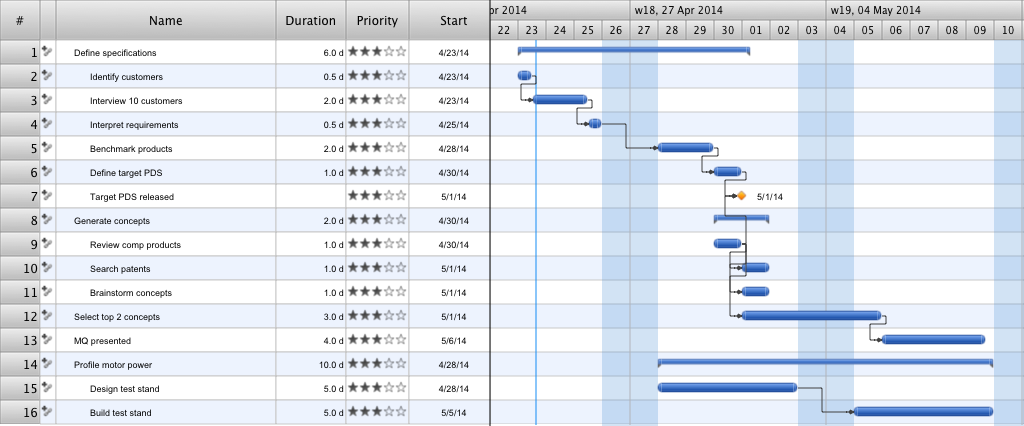
Sample 3. Gantt Chart Template
Use PM Easy Solution from the Project Management Area to create your own project in ConceptDraw PROJECT The Gantt Charts created in ConceptDraw Project allows effectively manage single and multi-projects, allocate the time and resources.
NINE RELATED HOW TO's:
While creating flowcharts and process flow diagrams, you should use special objects to define different statements, so anyone aware of flowcharts can get your scheme right. There is a short and an extended list of basic flowchart symbols and their meaning. Basic flowchart symbols include terminator objects, rectangles for describing steps of a process, diamonds representing appearing conditions and questions and parallelograms to show incoming data.
This diagram gives a general review of the standard symbols that are used when creating flowcharts and process flow diagrams. The practice of using a set of standard flowchart symbols was admitted in order to make flowcharts and other process flow diagrams created by any person properly understandable by other people. The flowchart symbols depict different kinds of actions and phases in a process. The sequence of the actions, and the relationships between them are shown by special lines and arrows. There are a large number of flowchart symbols. Which of them can be used in the particular diagram depends on its type. For instance, some symbols used in data flow diagrams usually are not used in the process flowcharts. Business process system use exactly these flowchart symbols.
Picture: Flowchart Symbols: Meaning and Examples
Related Solution:
Big and complex projects sometimes need some simplification of plans and schedules. That's why Program Evaluation and Review Technique was invented and first implemented in 1958. You can create PERT diagrams effortlessly with ConceptDraw DIAGRAM and share them with your colleagues.
Program Evaluation Review Technique (PERT) is a method that is used to assess and analyze projects. PERT is a valuable tool for the project management practice. PERT gives an assessment and analysis of the time needed to the project completion. A PERT chart is a visual tool that delivers a graphical view of a project timeline. It is used to display the sequences and dependences of project tasks necessary to complete a project. ConceptDraw DIAGRAM delivers the possibility to build a PERT along with other diagrams applied to assist management process by using its Seven Management and Planning Tools solution.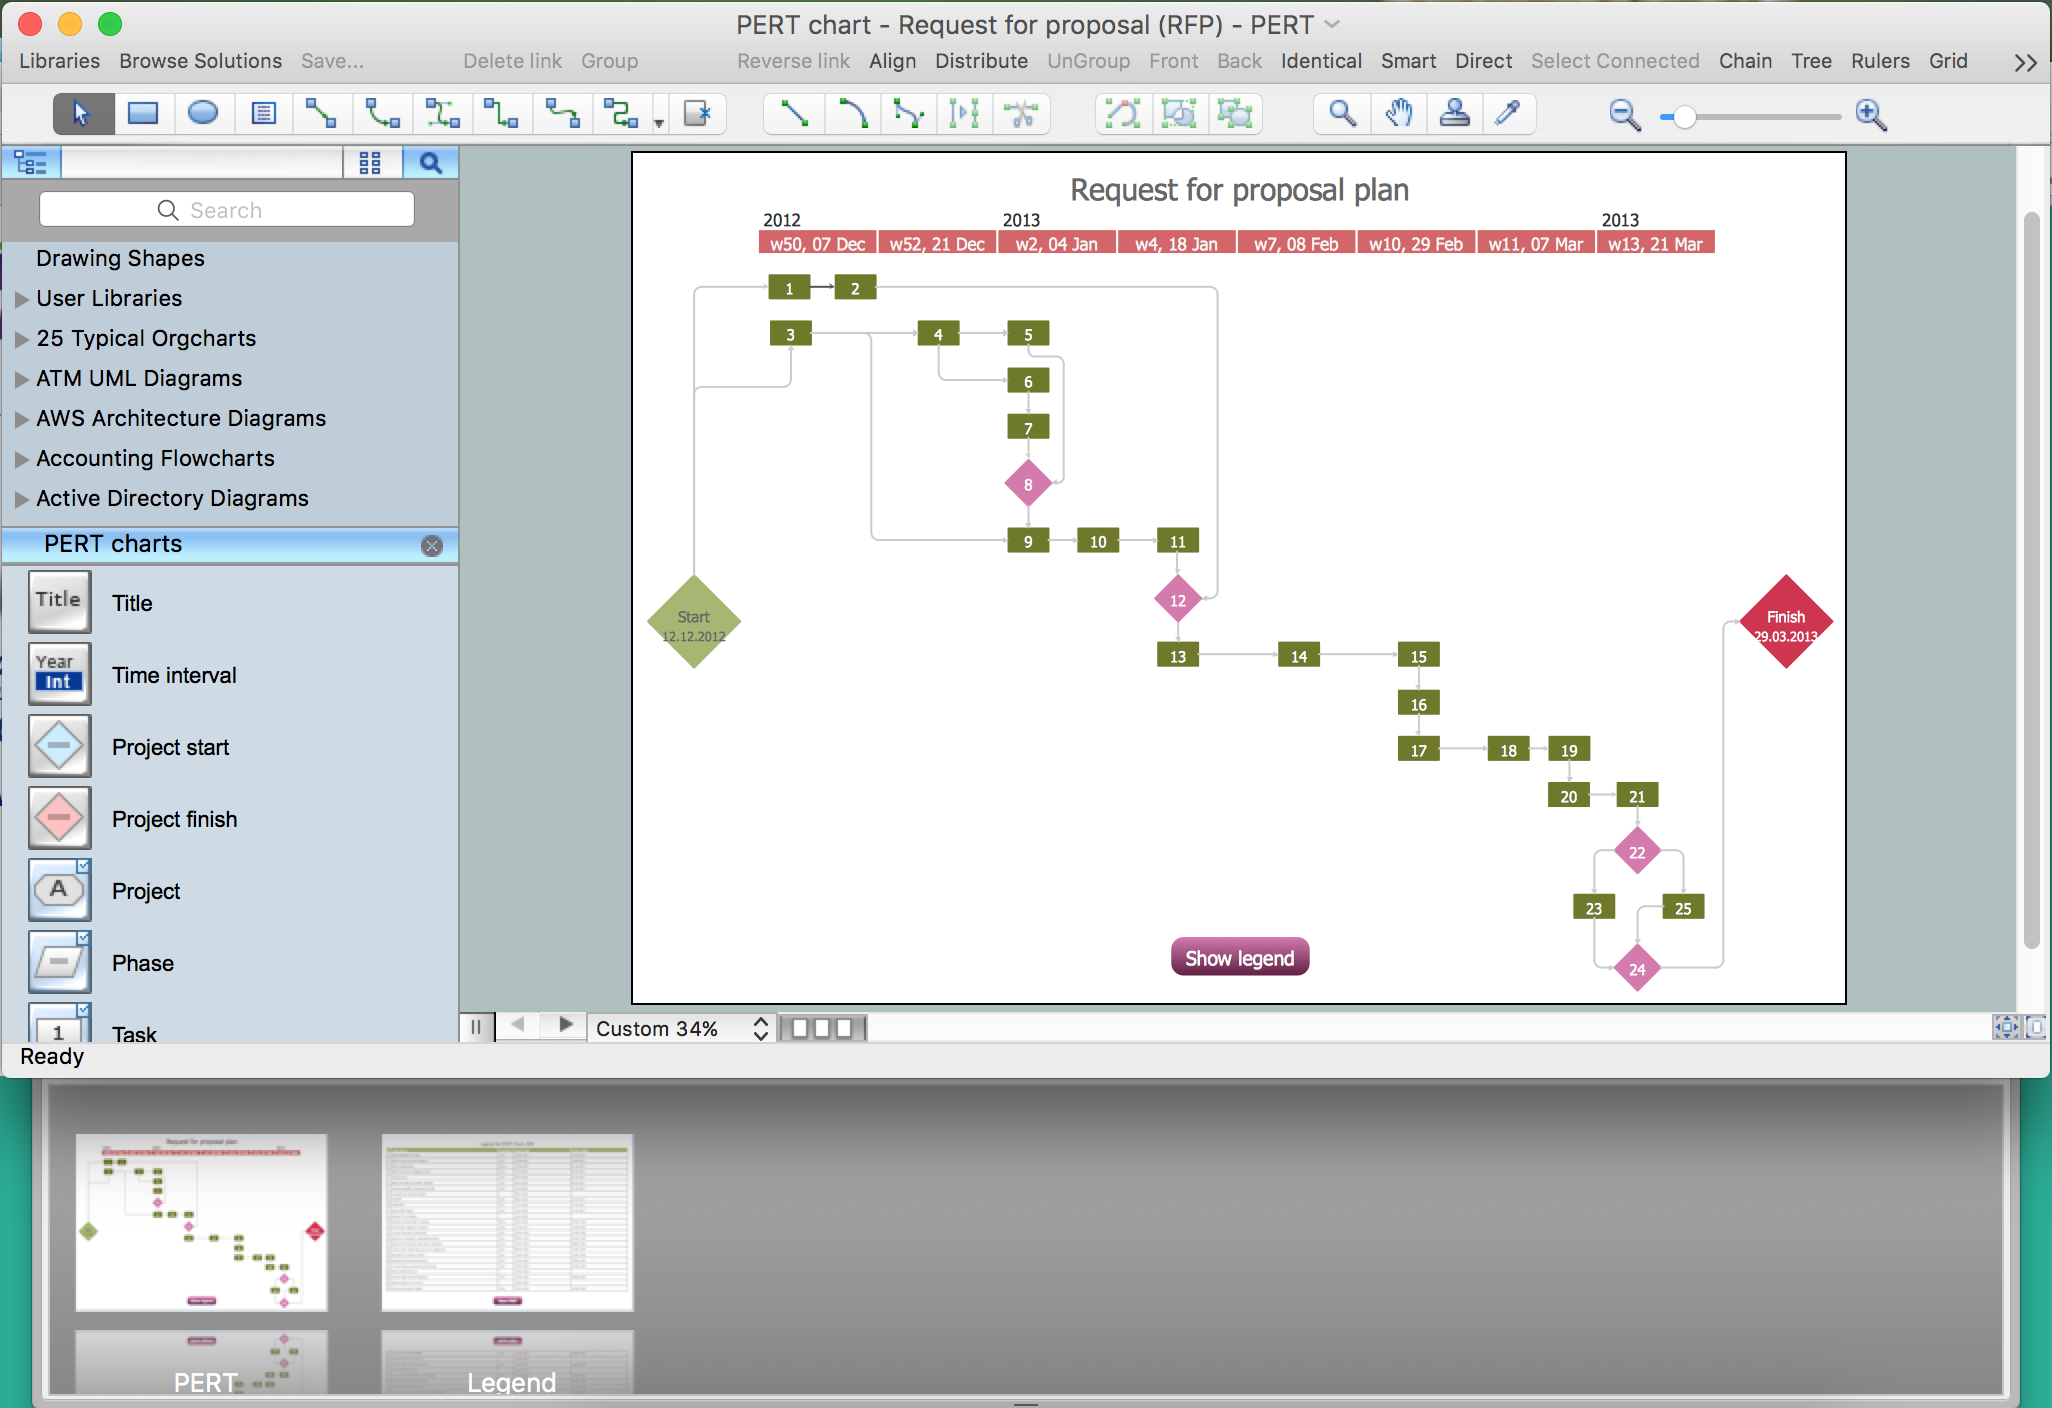
Picture: Program Evaluation and Review Technique (PERT) with ConceptDraw DIAGRAM
Related Solution:
The Critical Path Method (CPM) is an algorithm for scheduling a set of project activities. It is an important tool for effective project management. ConceptDraw PROJECT implements this method to provide the user with a wide set of project management tools.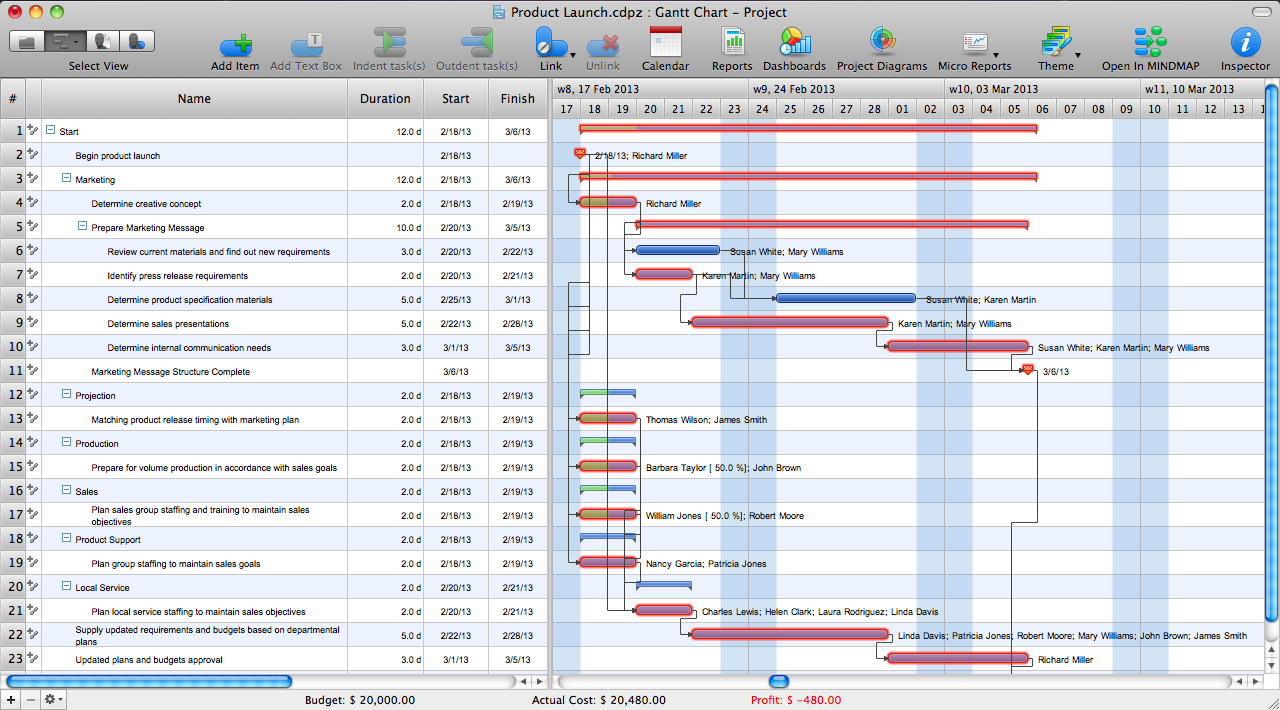
Picture: Critical Path Method in ConceptDraw PROJECT
Related Solution:
Waterfall chart shows the changing of the value from one state to another through the series of intermediate changes. The waterfall diagrams are widely used in the business. They are used to represent the set of figures and allow link the individual values to the whole.
Picture: Waterfall Bar Chart
Related Solution:
ConceptDraw MINDMAP software is an advanced tool for creating presentations. You can effectively generate, change, and update your presentation for demonstrating results of your work.
Picture: Demonstrating Results
Related Solution:
Why do you need network visualizations? 🔸 Unlock the full potential of network visualization with our in-depth guide on using the ConceptDraw Network Visualization Tool. ✔️ Explore features, tips, and best practices to create stunning visual representations of your network architecture
Picture:
Network Visualization Guide.
How to Use ConceptDraw Network Visualization Tool
Related Solutions:
ConceptDraw PROJECT’s powerful reporting engine lets you generate a set of tabular reports with just one click, or visualize your project as Radial Tasks Structures, Work Breakdown Structures and Resource Calendars. It also provides you with dynamic Project Dashboards.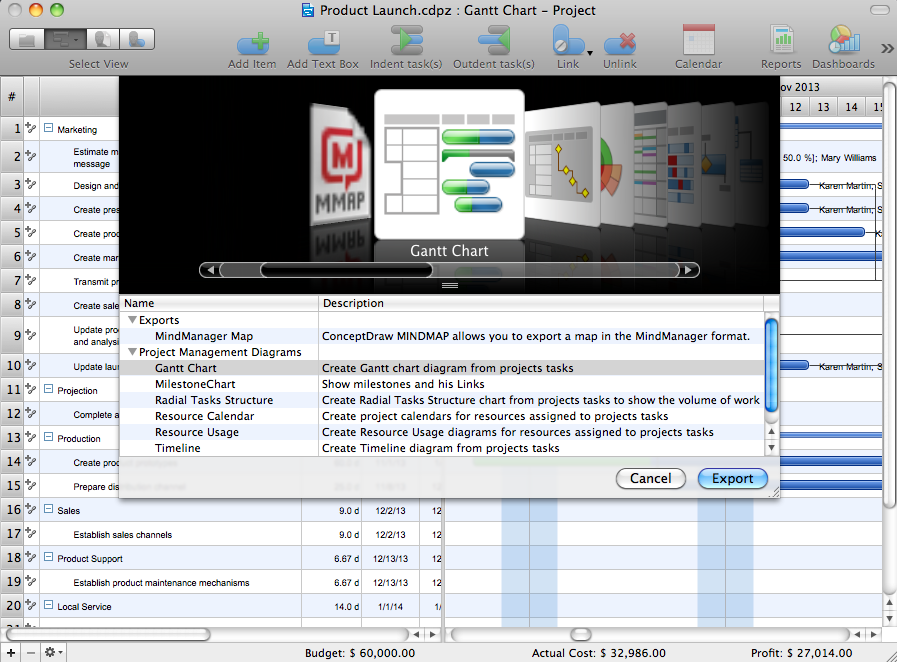
Picture: How to Report Task's Execution with Gantt Chart
An example of marketing analysis diagram, can be used to analyse product market and define marketing strategy.
This sample shows the Feature Comparison Chart of the digital scouting cameras. It can be useful for digital cameras production field, marketing, sales, etc.
Picture: Feature Comparison Chart Software
Related Solution:
Organization Chart Templates - Organizational Charts Solution from the Management Area of ConceptDraw Solution Park provides a wide collection of predesigned templates and samples that will help you create the Organizational Charts of any complexity in one moment.
Picture: Organization Chart Templates
Related Solution:

