Geo Map — USA — Illinois
Maps of USA — State of Illinois
"Illinois is a state in the Midwestern United States. It is the 5th most populous and 25th most extensive state, and is often noted as a microcosm of the entire country. With Chicago in the northeast, small industrial cities and great agricultural productivity in central and northern Illinois, and natural resources like coal, timber, and petroleum in the south, Illinois has a diverse economic base and is a major transportation hub. The Port of Chicago connects the state to other global ports from the Great Lakes, via the Saint Lawrence Seaway, to the Atlantic Ocean; as well as the Great Lakes to the Mississippi River, via the Illinois River. For decades, O'Hare International Airport has been ranked as one of the world's busiest airports. Illinois has long had a reputation as a bellwether both in social and cultural terms and politics." [Illinois. Wikipedia]
The vector stencils library Illinois contains contours for ConceptDraw DIAGRAM diagramming and vector drawing software. This library is contained in the Continent Maps solution from Maps area of ConceptDraw Solution Park.
Use the Illinois library to draw thematic maps, geospatial infographics and vector illustrations for your business documents, presentations and websites.
Geo Map — USA — State of Illinois

Geo Map — USA — Illinois Contour

Geo Map - USA

Geo Map — USA Contour

Geo Map — Contours of Territories of the United States

See Also Territories of the United States Geo Maps :
TEN RELATED HOW TO's:
Georgia is a state located in the southeastern United States.
The vector stencils library Georgia contains contours for ConceptDraw DIAGRAM diagramming and vector drawing software. This library is contained in the Continent Maps solution from Maps area of ConceptDraw Solution Park.
Picture: Geo Map — USA — Georgia
Related Solution:
Tool to draw Metro Map styled inforgraphics. London Tube map sample.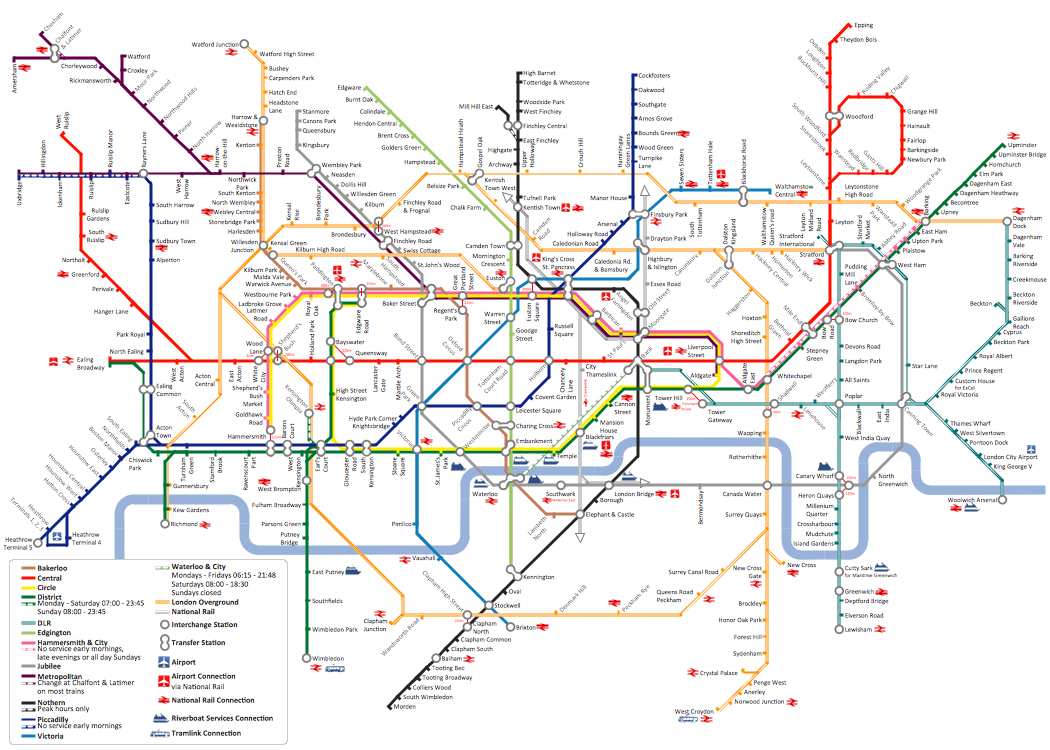
Picture: How to draw Metro Map style infographics? (London)
Related Solution:
The Education Information is multifariuos and can be often represented in various forms. Еру the most successful ways of presentation the information and data are various illustrations, diagrams and colorful education infographics which you can easily make in ConceptDraw DIAGRAM software extended with Education Infographics Solution from the Business Infographics Area.
Picture: Education Information
Related Solution:
Charting Software allows you to create diagrams, charts, graphs, flowcharts, and other business graphics. ConceptDraw DIAGRAM include simple shape drawing tools, examples, templates, and symbol libraries.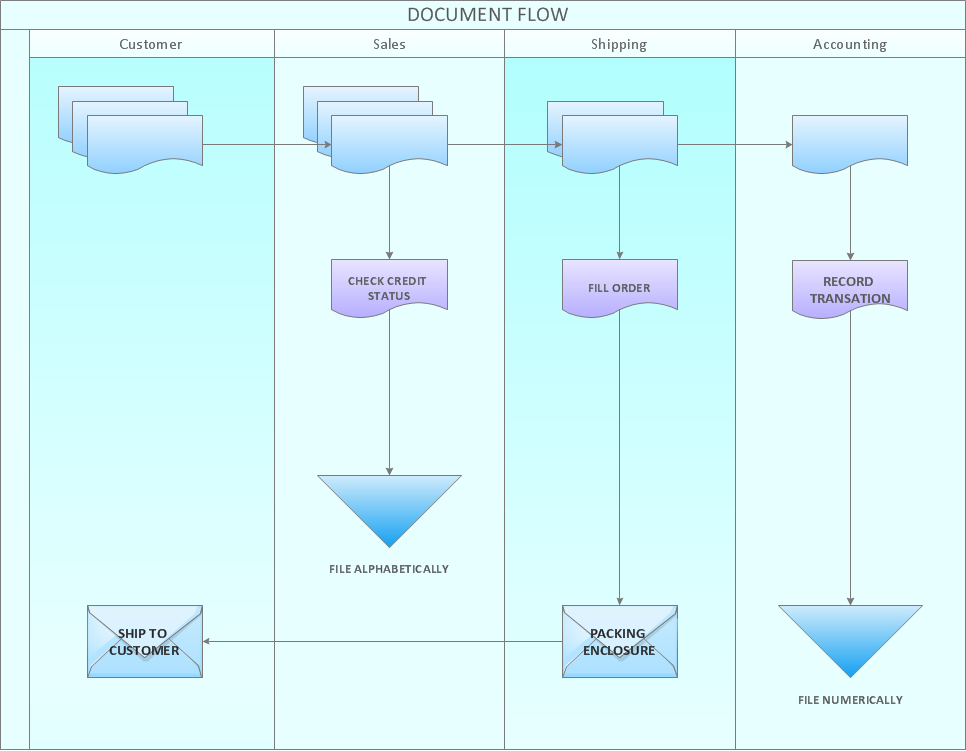
Picture: Create Graphs and Charts
Related Solution:
ConceptDraw DIAGRAM is a powerful diagramming and vector drawing software. Extended with AWS Architecture Diagrams Solution from the Computer and Networks Area, ConceptDraw DIAGRAM now is ideal software for Amazon Web Services diagrams drawing.
Picture: Amazon Web Services
Related Solution:
A network diagram represents the set of computers and network devices and the connections among them. This scheme can be developed for any institution or establishment. To illustrate this concept let’s take for example, a hotel network topology diagram or a school network diagram. These diagrams depict access points, servers, workstations, firewalls and another equipment needed to provide a network.
On this masterpiece drawing one will see a simple scheme a of connecting computers together. Such form of connecting can be applied for a hotel, guest house, bungalow, hut or something else. This diagram shows the images of the real LAN components. So, it represents a physical category of a network construction. It looks similar to a star - so this network configuration is named a star topology. The typical feature of this construction is a center point - usually it is hub, or router. The rays of this star means network connections. Computers, peripherals and other network details are placed on the ends of the star rays.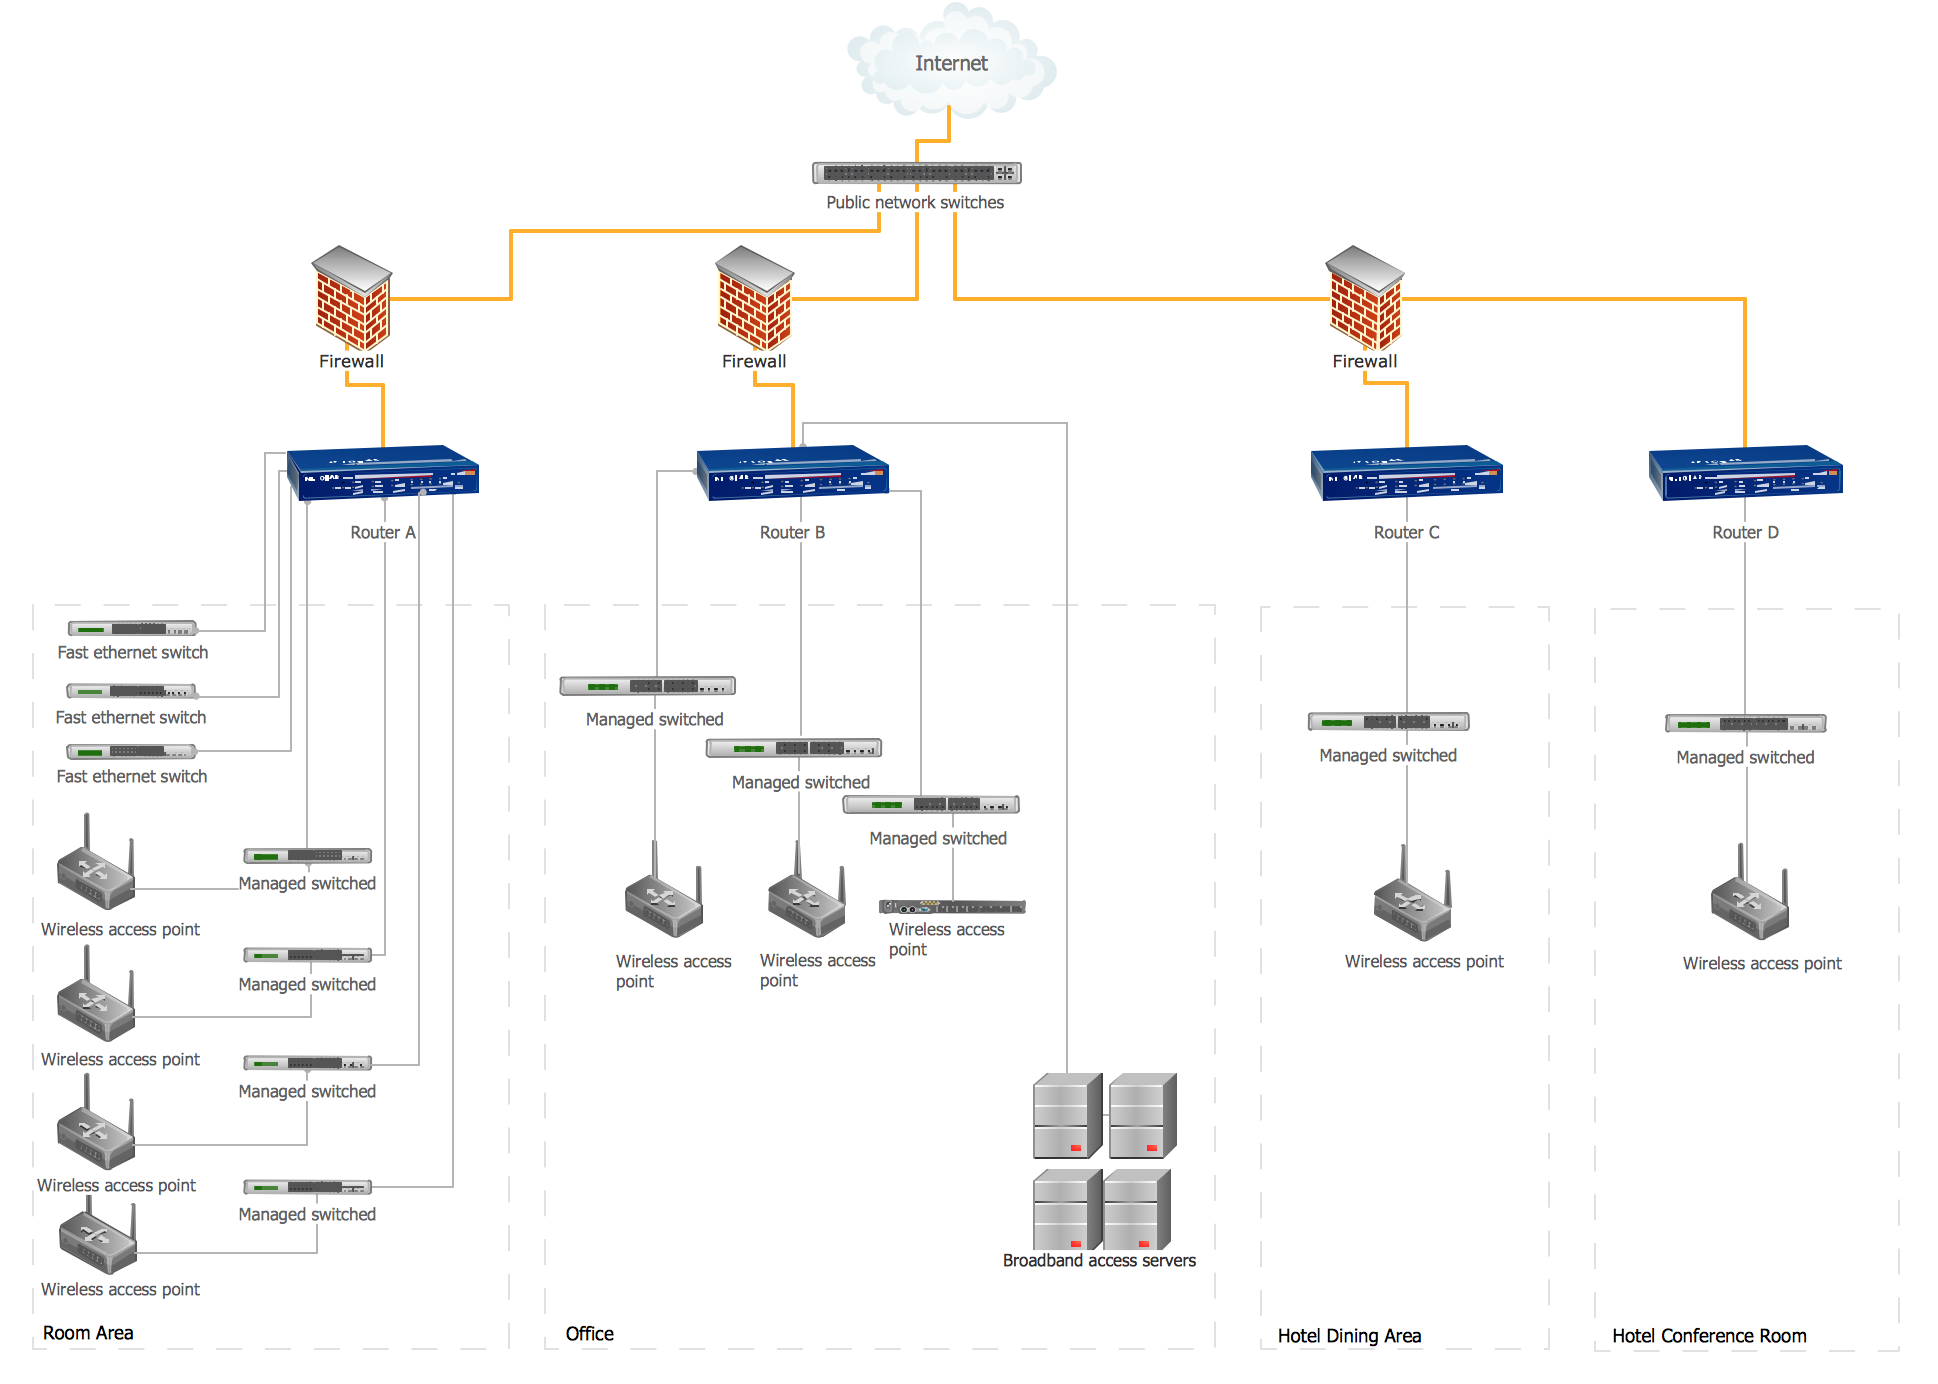
Picture: Hotel Network Topology Diagram
Related Solution:
Sample Pictorial Chart - Pictorial Infographics solution provides easy-to-use design infographics drawing tools, large collection of different sample infographics and infograms, sample pictorial chart and templates to be filled in, and 10 libraries with great quantity of predesigned vector pictograms.
Use Pictorial Infographics solution to draw your own design pictorial infographics documents quick and easy.
Picture: Sample Pictorial Chart. Sample Infographics
Related Solution:
Ontario is one of the ten provinces of Canada, located in east-central Canada.
The vector stencils library Ontario contains contours for ConceptDraw DIAGRAM diagramming and vector drawing software. This library is contained in the Continent Maps solution from Maps area of ConceptDraw Solution Park.
Picture: Geo Map - Canada - Ontario
Related Solution:
No one can imagine a geography class without such educational stuff as a geo map or a globe. As for one of the biggest countries in North America, the United States of America Map is present in every American school or college. It’s easier to remember all the states if you look on the map more often.
The following sample represents the map of USA. This precise map has names of all states of America. The different colors which are used to indicate each state add the visuality and brightness to the whole map. The ConceptDraw USA Maps solution - one of a family of ConceptDraw Maps solutions. Any country invokes a big piece of data: geographical, political, statistical, etc. A simple way of representing this data is to design maps that will show a certain item in relation to a particular area of Earth.
Picture:
How to Draw the US Map?
ConceptDraw Diagram Software for Easy USA Map Drawing
Related Solution:
Architectural drawing allows to show the location of a building or ensemble of buildings on the ground, indicating the cardinal points. For centuries, people had been studying architecture in universities to learn how to draw building plans and now everyone can do it easily just using appropriate software. While developing the building plan, its graphic part, you can display the part of the floor or the entire floor of a building with an indication of the exact location of the drawn premise.
Small-sized apartments does not restrict the advanced interior design opportunities. Here is a detailed and precise floor plan of a pretty small apartment. A furniture objects are added to show possible interior of this home. This plan can be used to help somebody with a floor layout and furniture arrangement. Having this floor plan in a pocket while shopping would be useful to check if there is enough rooms for a new furniture.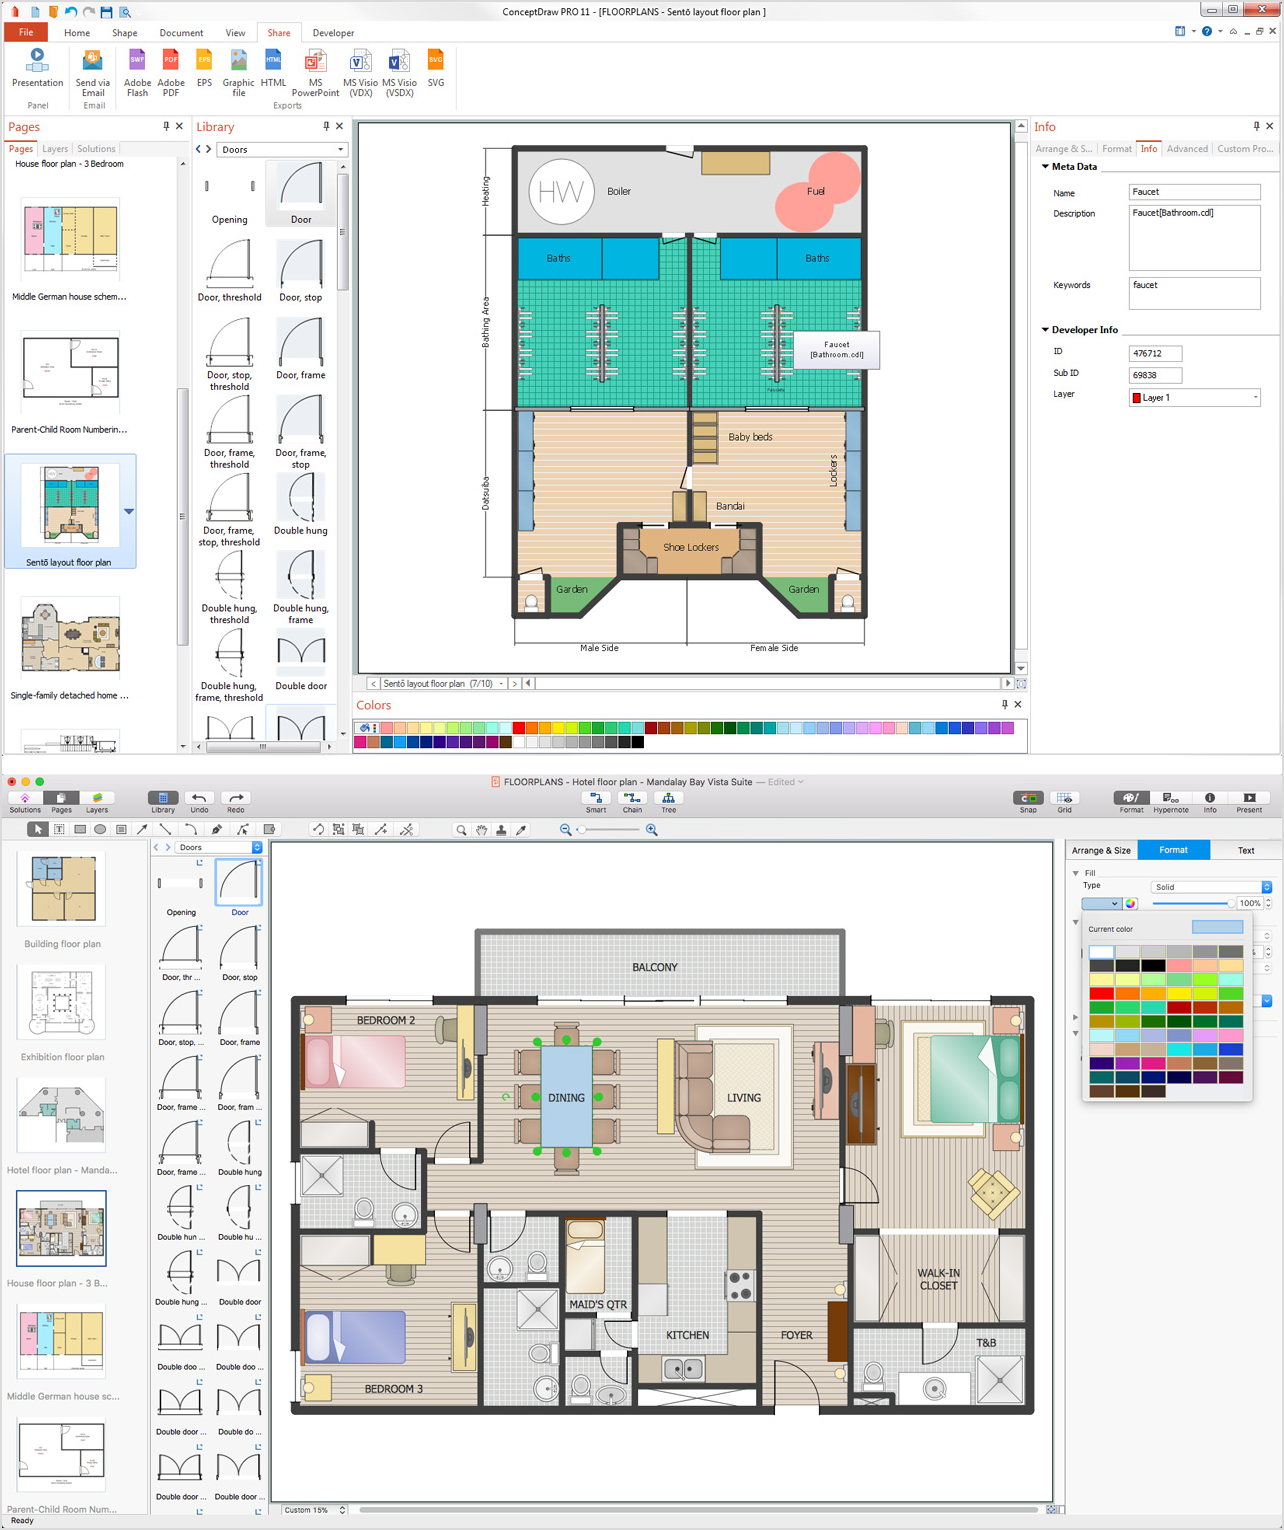
Picture: How To Draw Building Plans
Related Solution:


