Healthy Foods
Use of various charts, diagrams and infographics is the most effective way of visual presenting information about healthy foods, healthy eating and healthy diet. ConceptDraw DIAGRAM diagramming and vector drawing software offers the Health Food solution from the Food and Beverage area of ConceptDraw Solution Park which is overfull of powerful drawing tools, libraries with ready-to-use vector objects and clipart, predesigned samples and examples which will help you easy design healthy foods illustrations.
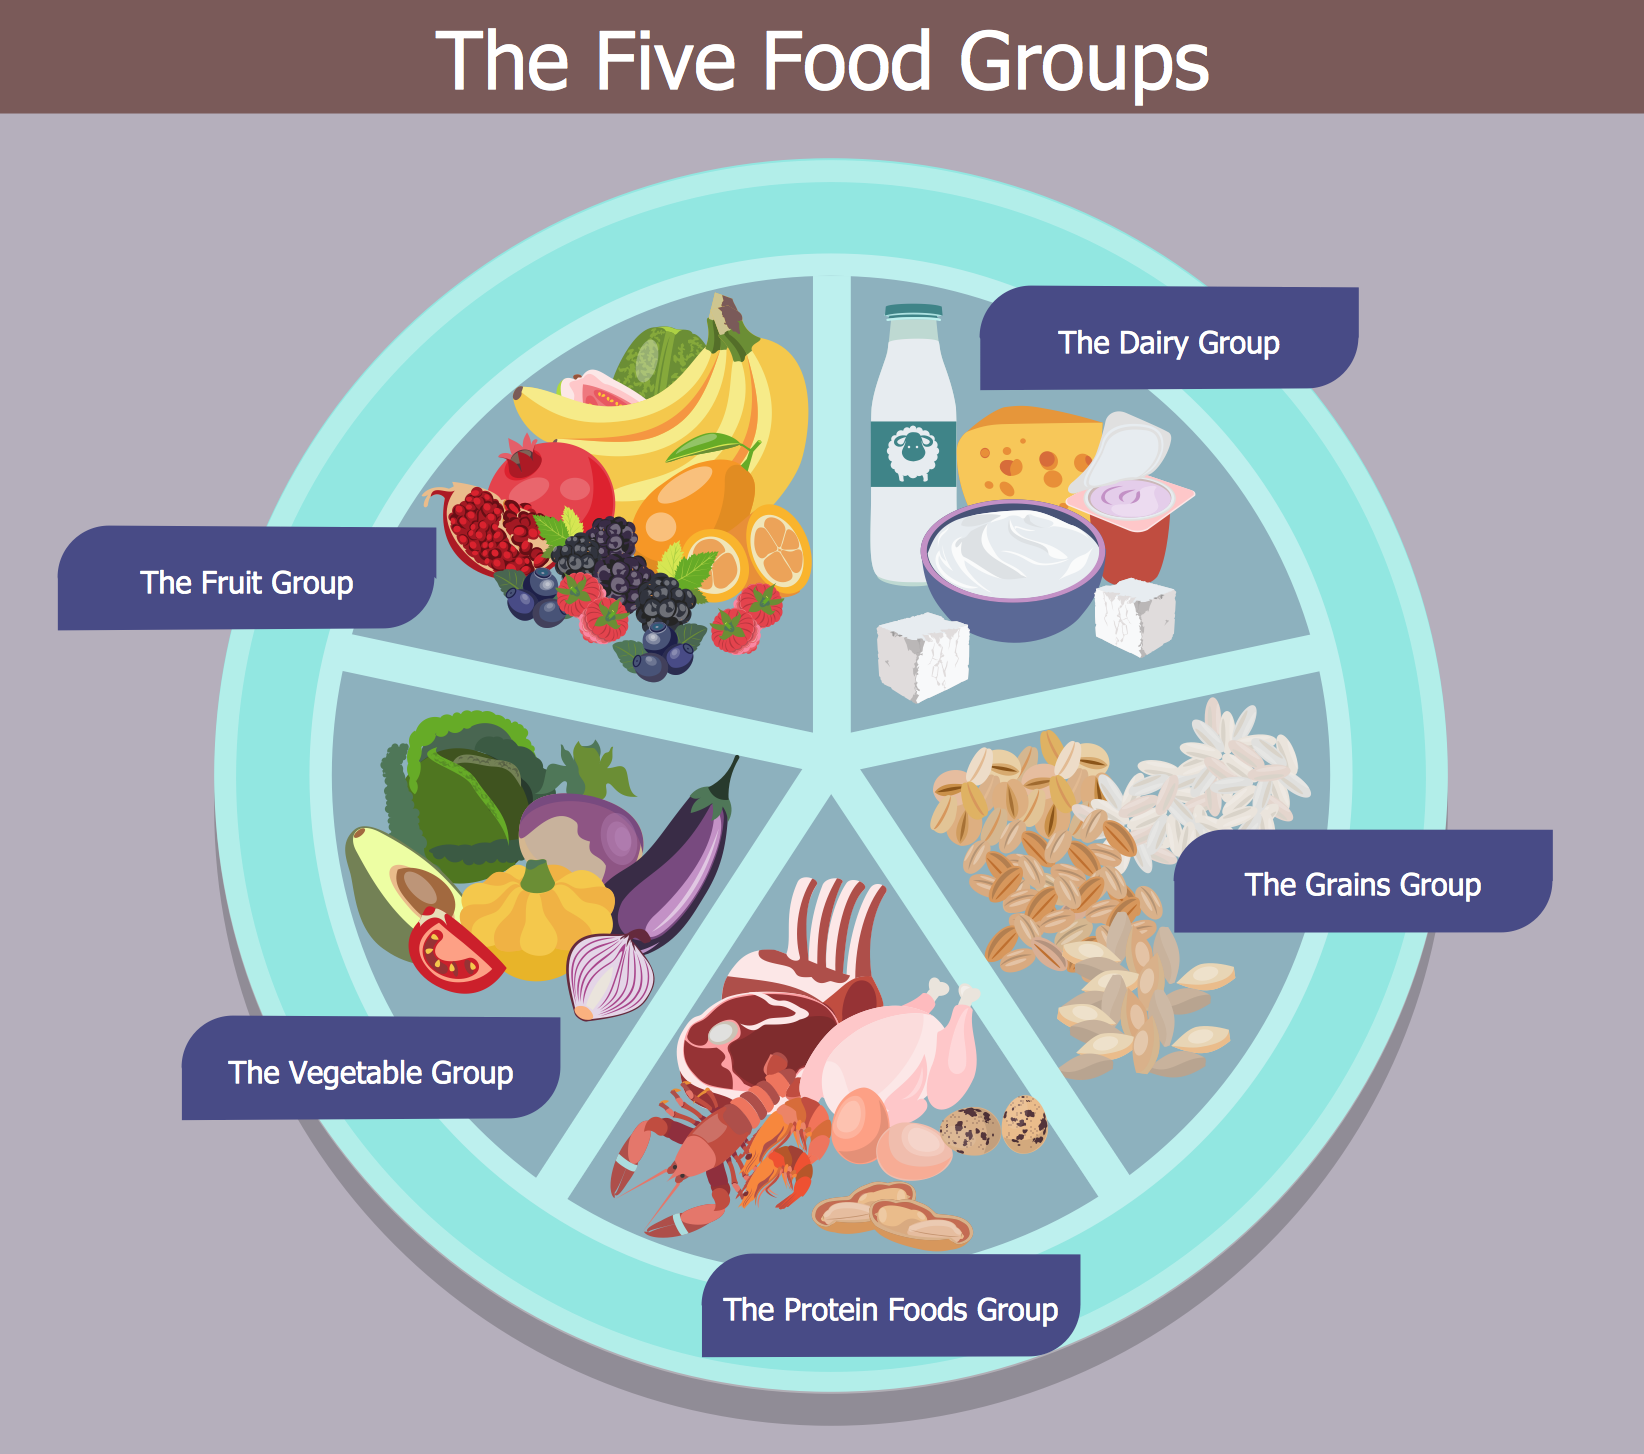
Example 1. Healthy Foods — Five Food Groups
Variety of predesigned objects of healthy foods is represented by 8 libraries included in Health Food Solution. These libraries contain 238 ready-to-use clipart specially developed for ConceptDraw DIAGRAM users. All they are vector, so you can easy resize them without loss of quality, change their color, combine several clipart to make your health food infographics and illustrations more interesting, bright and attractive.
ConceptDraw DIAGRAM gives you all needed tools to design your health food images from the blank sheet, but you can also use as the base or as the source of inspiration ready samples and examples offered in ConceptDraw STORE.

Example 2. Health Food Solution in ConceptDraw STORE
You can also use clipart from the libraries of other solutions included in Food and Beverage area to make your drawings yet more attractive and bright.

Example 3. Healthy Foods — USDA Food Pyramid
The healthy foods samples you see on this page were created in ConceptDraw DIAGRAM software using the Health Food Solution. An experienced user spent 10-15 minutes creating each of these samples.
Use the predesigned objects from the libraries of Health Food Solution for ConceptDraw DIAGRAM to illustrate the healthy food recipes and design attractive healthy foods pictures quick, easy and effective.
All source documents are vector graphic documents. They are available for reviewing, modifying, or converting to a variety of formats (PDF file, MS PowerPoint, MS Visio, and many other graphic formats) from the ConceptDraw STORE. The Health Food Solution is available for all ConceptDraw DIAGRAM users.
TEN RELATED HOW TO's:
Why do you need a business process flow diagram? How to use business process diagram software? Explore ✔️ the significance, ✔️ creation process, and ✔️ discover cutting-edge software solutions designed to streamline and optimize your workflows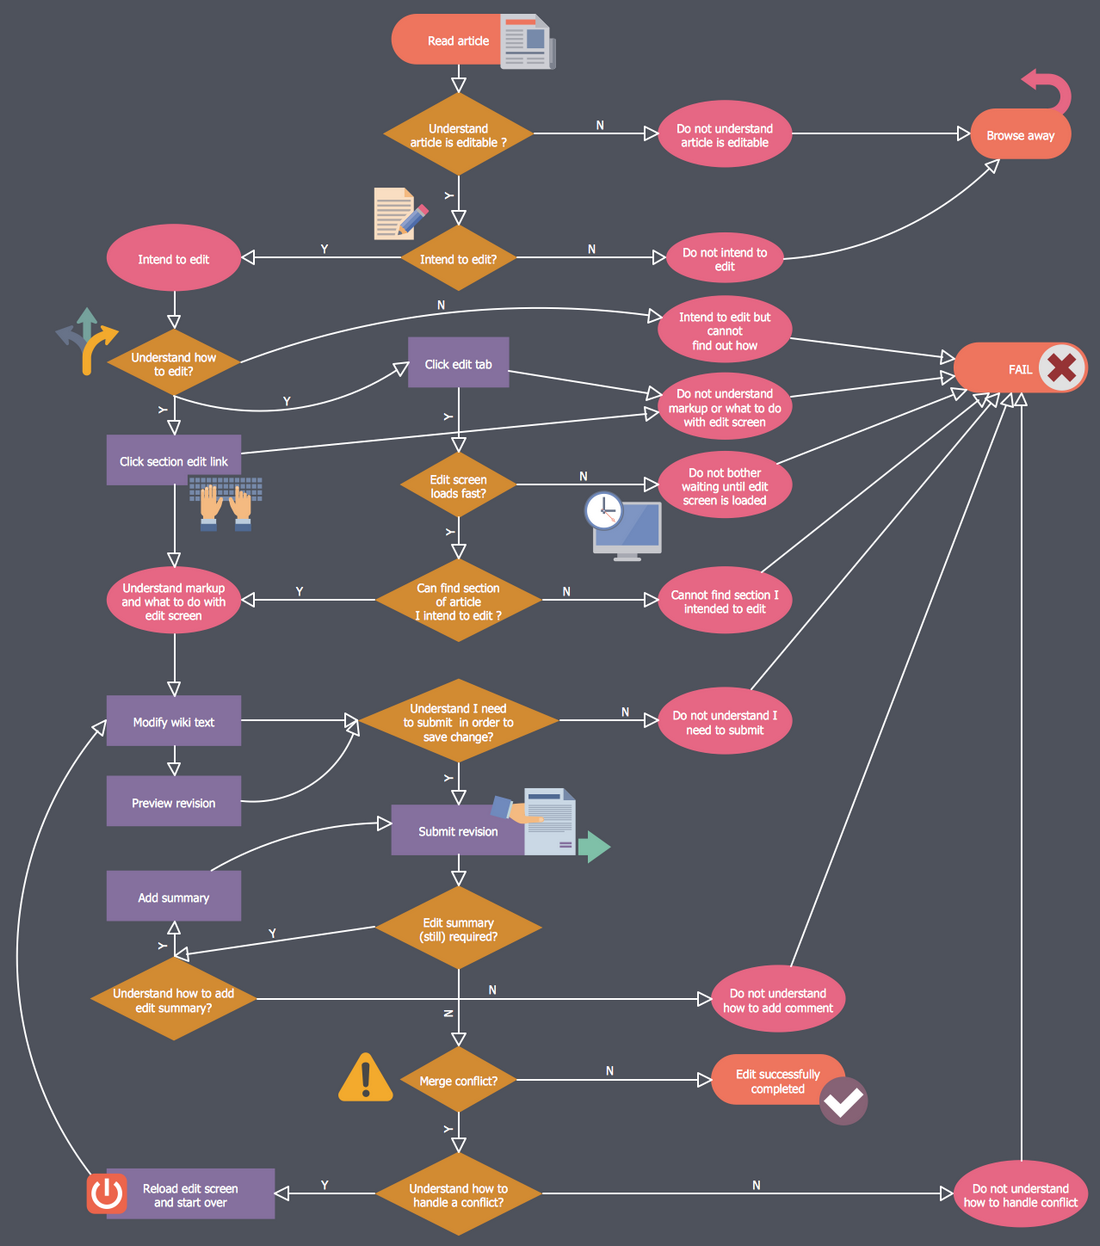
Picture: Business Process Workflow Diagrams & Software
Related Solution:
Western Australia (abbreviated as WA) is a state occupying the entire western third of Australia.
Maps surround us everywhere in our life, study, work, traveling, they are widely used in geography, history, politics, economics, and many other fields of science and life activity. But designing of maps is usually complex and labor-intensive process. Now we have the possibility to make easier this process - ConceptDraw DIAGRAM diagramming and vector drawing software extended with Australia Map Solution from the Maps Area of ConceptDraw Solution Park will help us in easy drawing detailed Australia map.
Picture: Australia Map — Western Australia
Related Solution:
This template shows the restaurant floor plan for kids. The floor plans are necessary for architects, builders, designers. It’s very simple, convenient and quick to design the professional looking Floor Plans of any difficulty in ConceptDraw DIAGRAM.
Use the ready-to-use predesigned objects, templates and samples from the Floor Plans Solution for ConceptDraw DIAGRAM you can create your own Floor Plans quick and easy.
Picture: Template Restaurant Floor Plan for Kids
Related Solution:
To connect two or more network devices are used the network cables. There are more different types of the network cables: Coaxial cable, Optical fiber cable, Twisted Pair, Ethernet crossover cable, Power lines and others. They are used depending of the network topology, size, protocol.
This example was created in ConceptDraw DIAGRAM using the Computer and Networks solution from the Computer and Networks area of ConceptDraw Solution Park.
Picture: Network wiring cable. Computer and Network Examples
Related Solution:
Bubble diagrams solution extends ConceptDraw DIAGRAM software with templates, Using ConceptDraw Connectors, you can create a bubble chart in moments.
Using ConceptDraw you will be able to create a bubble chart from the ready ConceptDraw library objects or make your own objects. The created diagram can represent ideas organization, in brainstorming processes, by teachers for explaining difficult ideas or for presentations.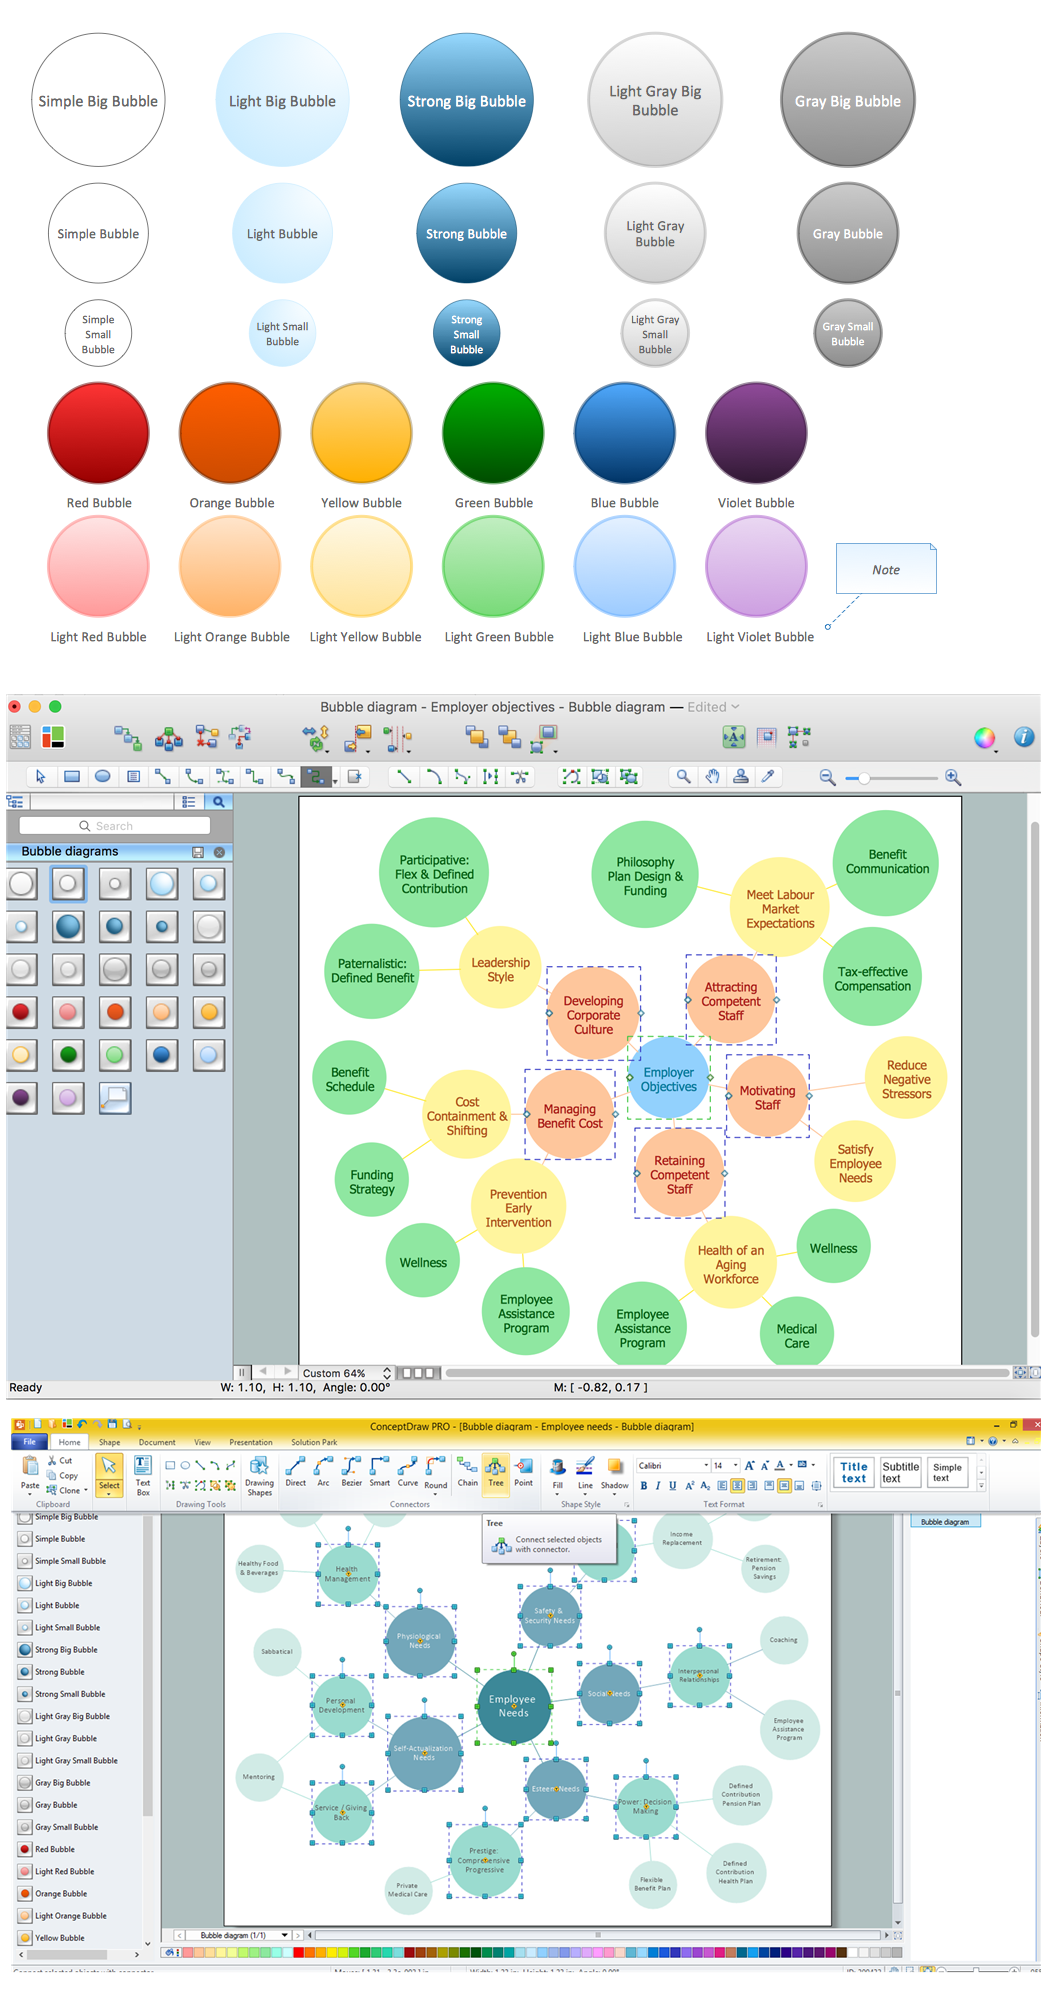
Picture: How To Create a Bubble Chart
Related Solution:
Electrical plan is a document that is developed during the first stage of the building design. This scheme is composed of conventional images or symbols of components that operate by means of electric energy. To simplify the creation of these schemes you can use house electrical plan software, which will not require a long additional training to understand how to use it. You only need to install the necessary software ant it’s libraries and you’ll have one less problem during the building projection.
Any building contains a number of electrical systems, including switches, fixtures, outlets and other lightening equipment. All these should be depicted in a building electrical plans and included to general building documentation. This home electrical plan displays electrical and telecommunication devices placed to a home floor plan. On the plan, each electrical device is referenced with the proper symbol. Electrical symbols are used for universal recognition of the building plan by different persons who will be working on the construction. Not all possible electric symbols used on a certain plan, so the symbols used in the current home plan are included to a legend. The electrical home plan may be added as a separate document to a complete set of building plans.
Picture: How To use House Electrical Plan Software
Related Solution:
Create your own flow charts of settlement processes using the ConceptDraw DIAGRAM diagramming and vector drawing software extended with the Cross-Functional Flowcharts solution from the Business Processes area of ConceptDraw Solution Park.
Download easy flowchart software to create settlement process flowcharts show steps of monthly settlement with your business quickly and easily.
Picture: Settlement Process Flowchart. Flowchart Examples
Related Solution:
ConceptDraw Wireless Network solution includes 81 of professional-looking stencils and several samples that you can modify and make your own diagram.
Picture: How to Create Network Diagrams
Related Solution:
You want to decorate menu, design pictorial illustration for the cooking article in the fashionable magazine, create attractive posters for your cafe or restaurant, or develop beautiful advertising materials? In order to ideally cope with all these tasks, use the easy recipes design software - ConceptDraw DIAGRAM extended with Cooking Recipes solution from the Food and Beverage area of ConceptDraw Solution Park.
Picture: Easy Recipes
Related Solution:


