
Example 1. Cookbook of Holiday Recipes
Cooking Recipes Solution offers for ConceptDraw DIAGRAM users powerful drawing tools, numerous libraries with predesigned vector objects, the set of ready samples on cooking thematic. All these tools make ConceptDraw DIAGRAM software the best for easy designing illustrations with holiday recipes and about cooking and decoration the tasty dishes.

Example 2. Holiday Table Setting
The following 14 libraries with 565 vector objects are included in Cooking Recipes Solution and available from ConceptDraw STORE:
- Bread and Baking
- Breakfast
- Cooking Appliances
- Cookware and Bakeware
- Desserts
- Drinks
- Fish, Seafood, Sushi
- Kitchen Knifes, Spoons and Forks
- Kitchen Utensils
- Meats
- Salads, Side Dishes and Vegetables
- Soups, Stocks, Stews, and Sauces
- Spices, Herbs, Condiments
- Tableware
All that you need to design your own holiday recipe is create new ConceptDraw document, add text of your recipe, and decorate your illustration by simply dragging desired objects from these libraries to your document.

Example 3. Holiday Recipes - Chocolate Cake
The samples you see on this page were created in ConceptDraw DIAGRAM software using the Cooking Recipes Solution and demonstrate the images with various holiday recipes. An experienced user spent 10-15 minutes creating each of these samples.
Use the tools of the Cooking Recipes Solution for quick, easy and effective illustration daily and holiday recipes of any detailing.
All source documents are vector graphic documents. They are available for reviewing, modifying, or converting to a variety of formats (PDF file, MS PowerPoint, MS Visio, and many other graphic formats) from the ConceptDraw STORE. The Cooking Recipes Solution is available for all ConceptDraw DIAGRAM users.
TEN RELATED HOW TO's:
Do you like the professional schemes that you can find on the Internet? Take into account that the most part of them is made using the Best Flowchart Software and Flowchart Symbols. Try you own powers in creating such diagrams!
Flowcharts are the most business diagramming tool. If you are a business manager, you can use flow chart to depict work flow in your organization, develop the effective organizational structure and present the information to investors or other stakeholders. Combining the smart management solutions with ConceptDraw DIAGRAM diagramming engine delivers the set of comprehensive flowchart tools necessary to support professionals in their creativeness and business activity.
Picture: Best Flowchart Software and Flowchart Symbols
Related Solution:
The Ishikawa diagram, Cause and Effect diagram, Fishbone diagram — all they are the names of one and the same visual method for working with causal connections. Originally invented by Kaoru Ishikawa to control the process quality, the Ishikawa diagram is well proven in other fields of management and personal scheduling, events planning, time management. It is a chart in the form of a fish, whose head is a problem, the fins are variants for its causes.
To design easily the Fishbone diagram, you can use a special ConceptDraw DIAGRAM vector graphic and diagramming software which contains the powerful tools for Fishbone diagram problem solving offered by Fishbone Diagrams solution for the Management area of ConceptDraw Solution Park.
Picture: Fishbone Diagram Problem Solving
Related Solution:
ConceptDraw DIAGRAM diagramming and vector drawing software extended with Sales Flowcharts solution from the Marketing area of ConceptDraw Solution Park offers the set of extensive tools for quick and easy drawing professional looking Sales Process Flowcharts.
Picture: Sales Process Flowcharts
Related Solution:
Electrical plan is a document that is developed during the first stage of the building design. This scheme is composed of conventional images or symbols of components that operate by means of electric energy. To simplify the creation of these schemes you can use house electrical plan software, which will not require a long additional training to understand how to use it. You only need to install the necessary software ant it’s libraries and you’ll have one less problem during the building projection.
Any building contains a number of electrical systems, including switches, fixtures, outlets and other lightening equipment. All these should be depicted in a building electrical plans and included to general building documentation. This home electrical plan displays electrical and telecommunication devices placed to a home floor plan. On the plan, each electrical device is referenced with the proper symbol. Electrical symbols are used for universal recognition of the building plan by different persons who will be working on the construction. Not all possible electric symbols used on a certain plan, so the symbols used in the current home plan are included to a legend. The electrical home plan may be added as a separate document to a complete set of building plans.
Picture: How To use House Electrical Plan Software
Related Solution:
Structured-systems analysis and design method uses data flow diagrams to represent the process of data flowing through a system. Talking about this might be useless without a proper example of DFD for online store (Data Flow Diagram). This DFD example shows all the distinctness that a diagram can bring into a scattered data structure.
Data flow diagrams are used to show how data is processed within some business processes. Making DFD is a common practice for business process modeling and analysis. This diagram represents the online store business flow. It describes inputs and outputs within online selling process and depicts the interactions between its participants. This DF diagram can be used by system analysts to create an overview of a business, to study and discover its inherent strengths and weak points.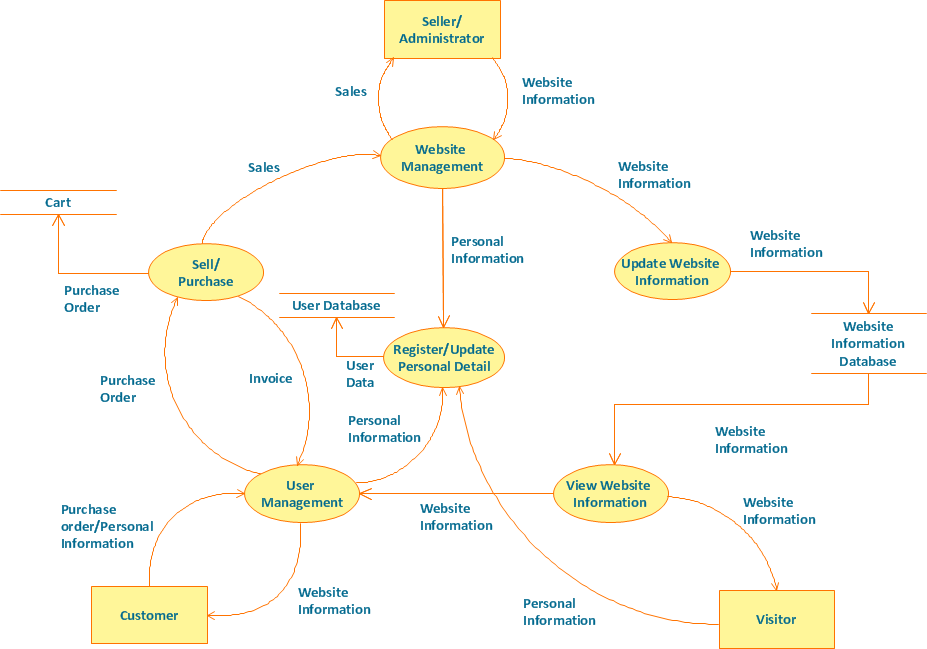
Picture: Example of DFD for Online Store (Data Flow Diagram)
Related Solution:
Make diagrams, charts, workflows, flowcharts, org charts, project charts easily with ConceptDraw software.
Picture: Best Program to Make Diagrams
Related Solution:
Now it’s easy to share your visual documents with other people in a form most convenient for them.
ConceptDraw DIAGRAM can save your drawings and diagrams in a number of highly useful formats, including graphic files. You can save your drawing as a.PNG,.JPG, or other graphic format file.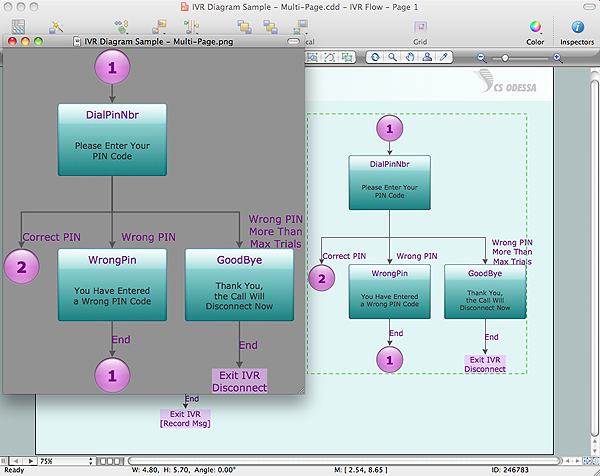
Picture: Export from ConceptDraw DIAGRAM Document to a Graphic File
Flowcharts can be used in designing and documenting both simple and complex processes or programs and, similar to the other types of diagrams, they can help visualize what happens and so help understand some definite process, and, as a result, find flaws, bottlenecks and other features within it.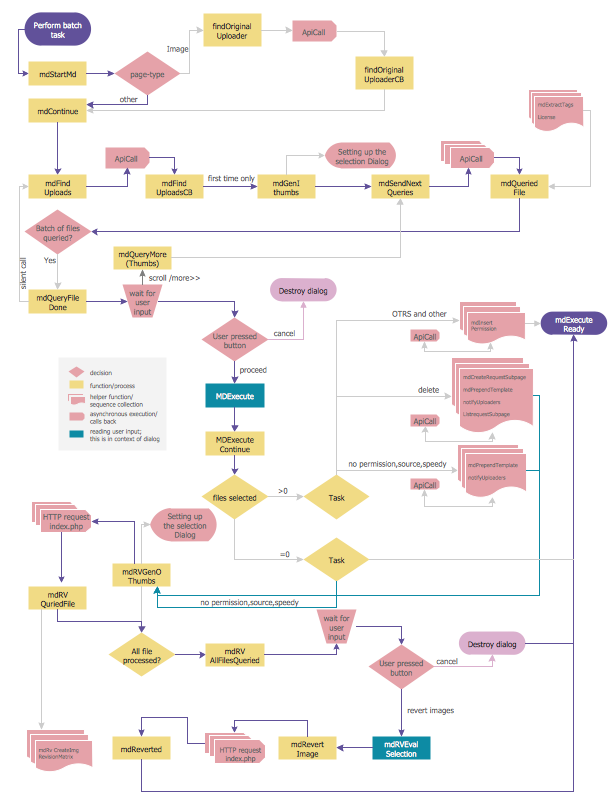
Picture: Flowchart Programming Project. Flowchart Examples
Related Solution:
When searching for a diagramming tool, we look for a powerful and reliable software that would be easy to use. To mention one, ConceptDraw DIAGRAM has all the necessary features to create cross-functional flowcharts (Swim Lanes) quick and effortlessly. You can draw swim lane diagrams in both vertical and horizontal ways.
This cross-functional flowchart displays a payroll process. It explains to each participant his role in the process depending on the category, represented with swimlanes. Using this flowchart, every employee can easily find out what he can expect in terms of salary. Generally a cross-functional diagram enables one to take a look at processes with a wider scope and with more precision than simple flowchart. Business process capturing using cross-functional flowcharts can be useful for stakeholders and managers to define clearly the staff's roles and responsibilities.
Picture: Cross-Functional Flowchart (Swim Lanes)
Related Solution:
Every good manager has to predict different situations that might occur in any process. If only every of them Swot Analysis Examples at that time, I could have succeeded in my career. Unfortunately I didn't have any notion about it.
This is a sample of SWOT diagram. This is also a mean of marketing strategy elaboration. Before as filling this table, marketing manager has to investigate both external and internal factors. The effective SWOT analysis helps to gain benefits from opportunities and decrease threats by conversion of strengths and weaknesses into advantage. The SWOT and TOWS Analysis solution to ConceptDraw offers a number of template matrices for SWOT, designed to support a marketing strategy development process.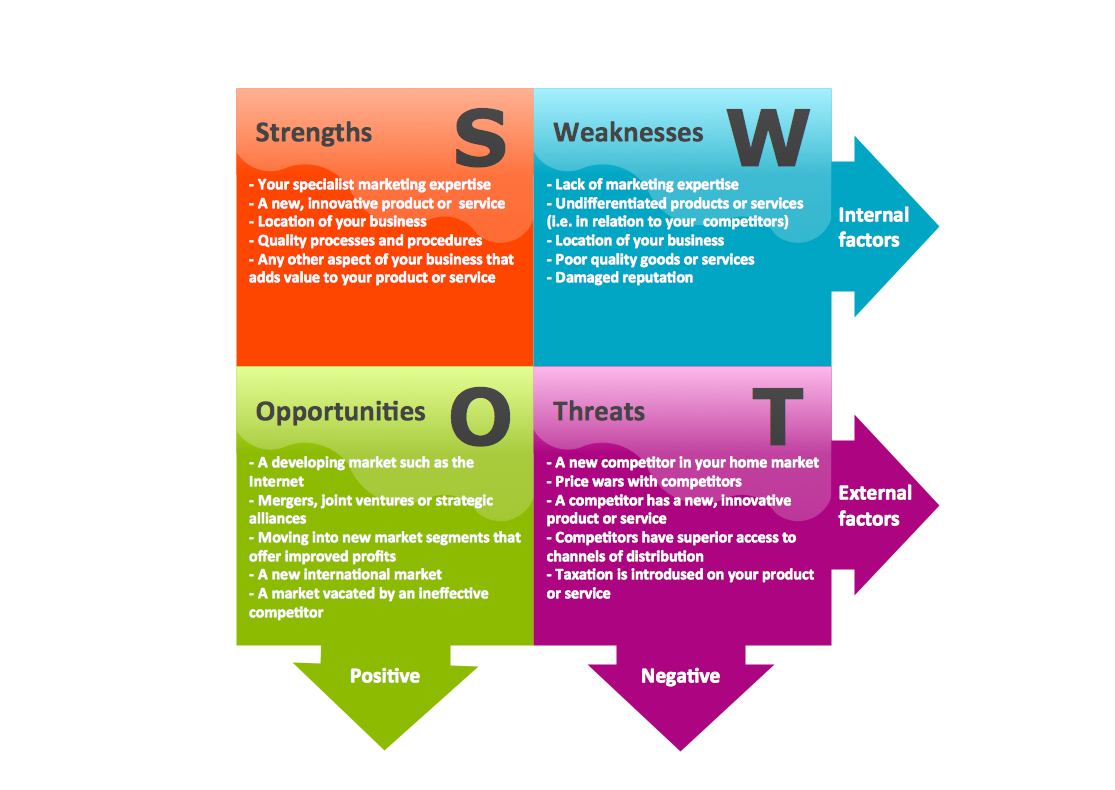
Picture: Swot Analysis Examples

