Horizontal Flowchart
This sample was created in ConceptDraw DIAGRAM diagramming and vector drawing software using the Flowcharts solution from the "Diagrams" area of ConceptDraw Solution Park.
A Flowchart is a graphically representation of the process, algorithm or the step-by-step solution of the problem. The Flowcharts have one or more starting and ending points. The geometric figures on the Flowcharts represent the steps of the process and are connected with arrows that show the sequence of the actions.
The Flowcharts can be presented vertically or horizontally. This sample shows the horizontal Flowchart.

Example 1. Flowchart uploaden
This example was redesigned from the file [en.wikimedia.org]
Use the predesigned objects, samples and templates from the Flowcharts Solution for ConceptDraw DIAGRAM to create your own professional looking Flowchart Diagrams quick and easy.
The Flowcharts produced with ConceptDraw DIAGRAM are vector graphic documents and are available for reviewing, modifying, and converting to a variety of formats (image, HTML, PDF file, MS PowerPoint Presentation, Adobe Flash or MS Visio).
NINE RELATED HOW TO's:
Website wireframe is a detailed view of design or its skeleton. It shows all the important elements of the final website, the main groups of contents, information structure, describes the user's interaction with interface and its estimated visualisation.
ConceptDraw DIAGRAM extended with Website Wireframe solution from the Software Development area is the best wireframing software. Using the wireframe tools, libraries of vector objects, template and examples which offers a Website Wireframe solution, you will easily design the websites wireframes of any complexity.
Picture: Wireframing
Related Solution:
Creating diagrams and schemes is a pleasure with proper software. You don’t need any additional skills to create organizational chart quick and effectively with our diagramming tool. Create your ConceptDraw account today and start your diagramming experience.
This is the most regular type of organizational chart - hierarchical. It is created using the ConceptDraw Organizational Charts solution. Its composition can be displayed as a pyramid, with an only person in authority at the top, with sub-levels of management below them. According to hierarchy, an employee communicates only to his immediate head or subordinates. A hierarchical organizational structure may be choice for a businesses that work on multiform markets or any other organization that has a workflow requiring a multilevel structure of middle management.
Picture: Create Organizational Chart
Related Solution:
Job duties in small companies are usually spread randomly among workers, causing lots of problems and misunderstanding. One of the ways to restore order in business processing is to create a cross-functional flowchart with swim lanes that would represent every step in production system. Another advantage of using swim lanes flowchart is that it represents not only processes, but people responsible for them.
Swim lane diagram is a kind of a process flow diagram. Its special feature is that it joins the features of process flow diagrams with organizational charts. Thus, a swim lane diagram display a participant of the business process in a conjunction with general flow of the business system. A swim lane diagram is looks similar to a swimming pool's lanes. Lanes can be horizontal and vertical. The lanes are pointed out relatively to resource name, which is assigned on implementation of the given part of the business process. ConceptDraw Business Process Mapping solution delivers the ability to design develop swim lanes flowcharts using the vector graphic objects of Swim Lanes library.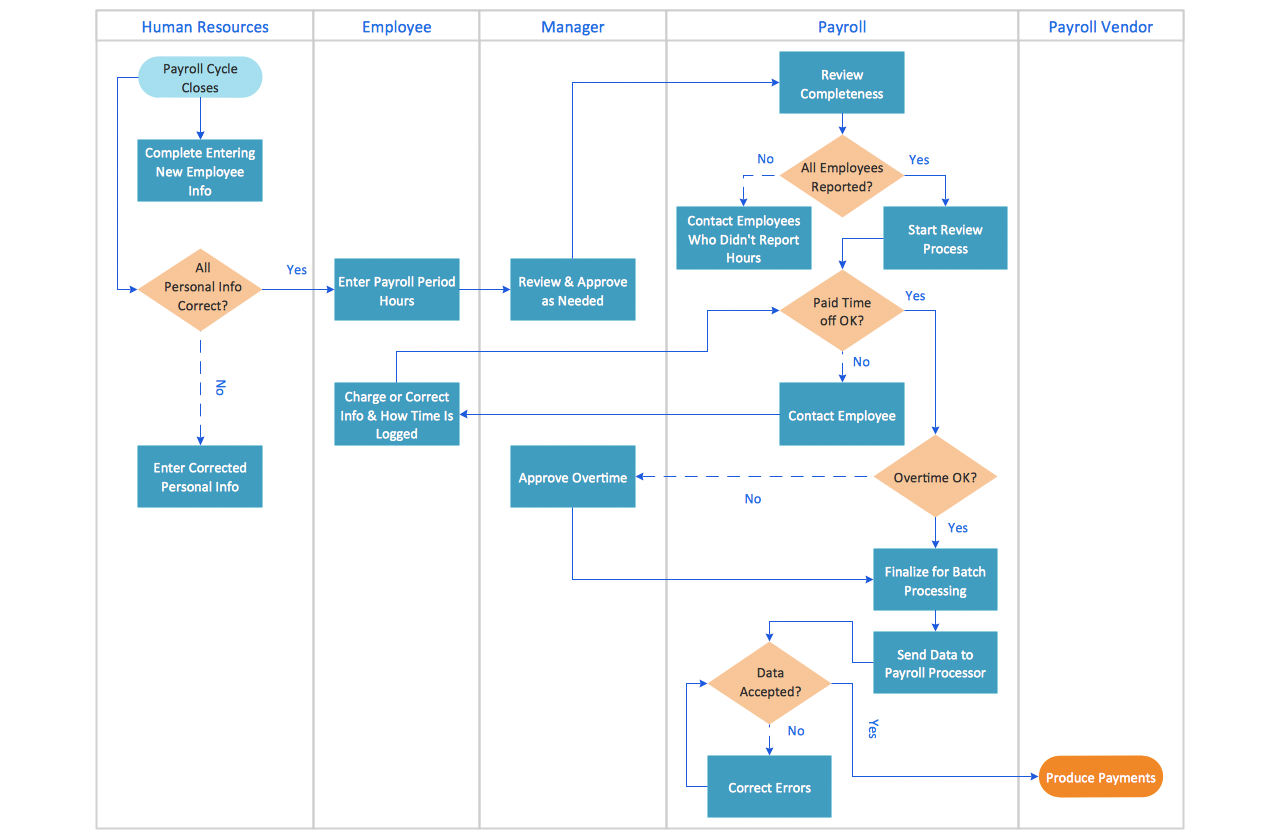
Picture: Swim Lane Diagrams
Related Solution:
ConceptDraw gives the ability to draw simple diagrams like flowcharts, block diagrams, bar charts, histograms, pie charts, divided bar diagrams, line graphs, area charts, scatter plots, circular arrows diagrams, Venn diagrams, bubble diagrams, concept maps, and others.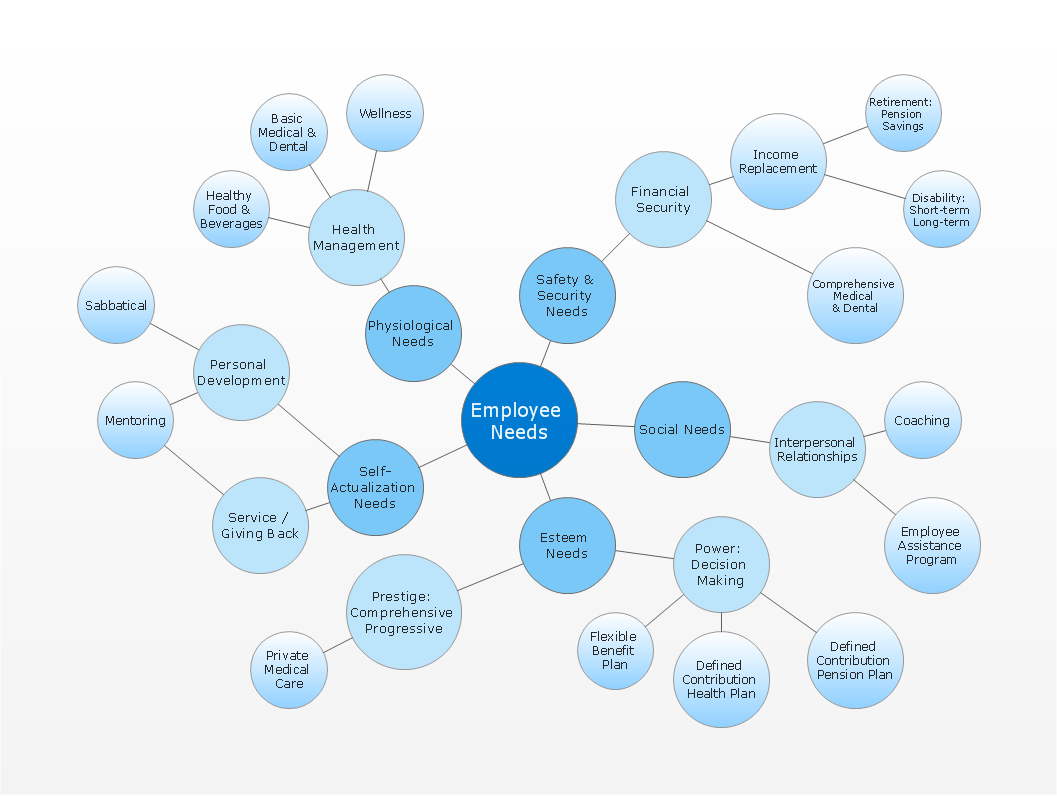
Picture: Simple Drawing Applications for Mac
Related Solution:
The answer how to create a bar chart can be found in ConceptDraw software. The simple tips guide you through the software to quickly learn how to create a bar chart.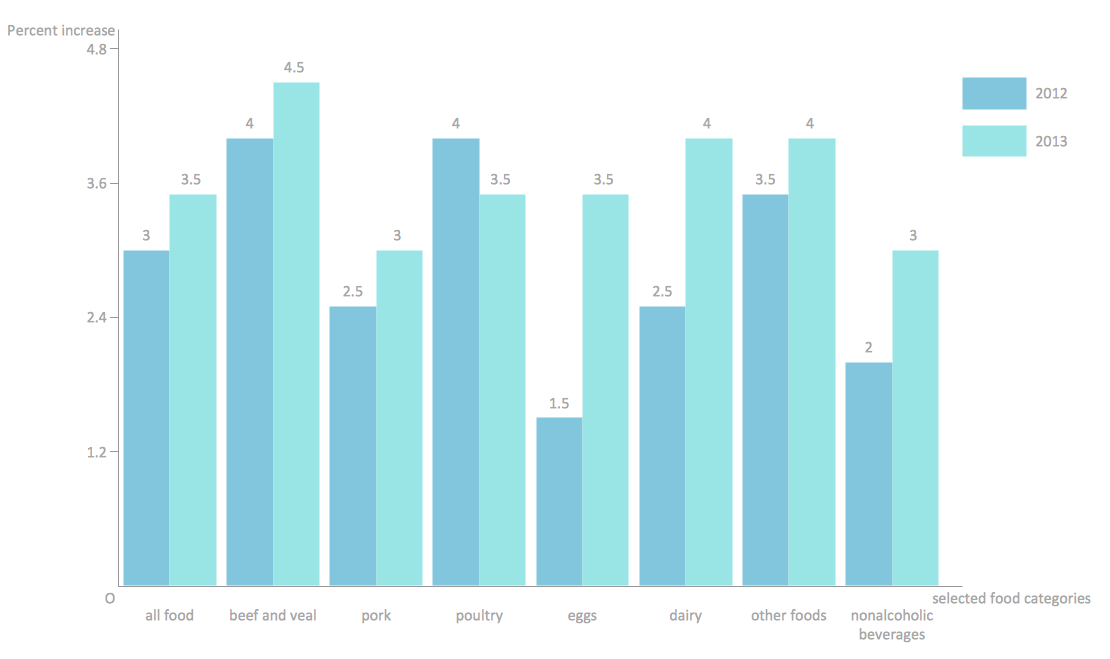
Picture: How to Create a Bar Chart
Related Solution:
Process mapping helps with sharing business results and reorganizing workflow. In almost every case, after creating a sales process flowchart the steps that are redundant become obvious for a manager. It's easy to find a flowchart examples that will help in developing one for your business.
This sales process flowchart consists of a sequence of steps that represent a simple sale process. Each step is shown graphically by a rectangle representing processing steps or an activity, or a diamond representing a decision. These rectangles are linked by arrows, that indicate the direction of the sales workflow. ConceptDraw Sales Flowcharts solution delivers a the full set of classical flowchart notation symbols, along with sales-related icons and pictograms.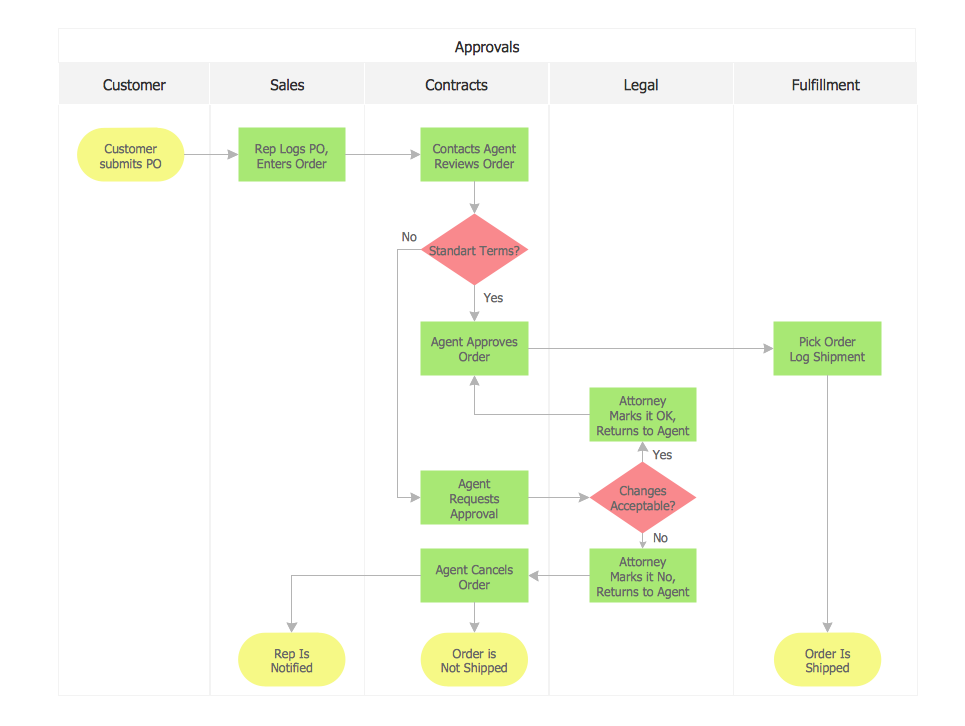
Picture:
Sales Process Flowchart
Flowchart Examples
Related Solutions:
Being usually a very complex process that requires a lot of skills, patience, time, and artistic abilities, the concept mapping process now is incredibly easy thanks to the Concept Maps Solution from the Diagrams Area of ConceptDraw Solution Park.
Picture: Concept Mapping
Related Solution:
ConceptDraw DIAGRAM is a powerful software for creating professional looking Flowcharts quick and easy.
Picture:
Flowchart
What is Flowchart
Related Solution:
The most effective and easiest way to design a Flowchart is to use an easy Flowchart software - ConceptDraw DIAGRAM. It is enhanced with the special Flowcharts solution from the Diagrams area of ConceptDraw Solution Park. This software allows designing as simple as complex processes in a moment. And even drawing multiple flowcharts simultaneously on the separate pages of one document or different ones is also possible.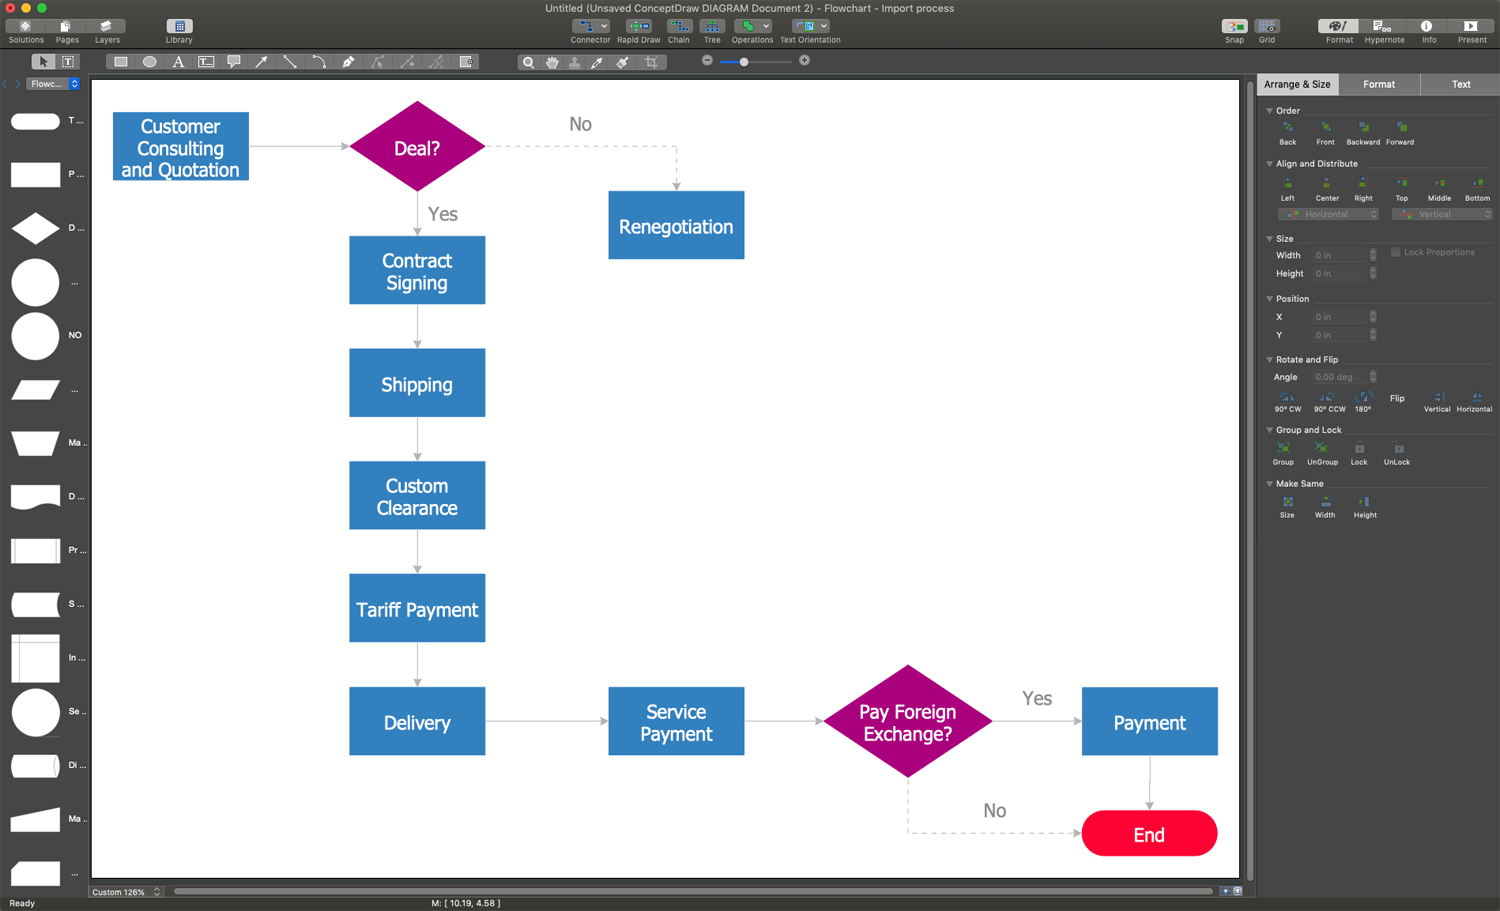
Picture: Easy Flowchart Software
Related Solution: