Made with
ConceptDraw
DIAGRAM 18

How to Build Cloud Computing Diagram
Principal Cloud Manufacturing

The term “cloud” is very popular and widely used now, it is a server, data processing centre, or a network which lets to store the data and software, provides access to them, allows to run applications without installation and gives the possibility to process data hosted remotely via the Internet connection.

With increasing a competition, each manufacturing company strives to support flexible and scalable business processes, that's why the modern technologies, such as the cloud manufacturing, are so actively applied today.

Cloud manufacturing (CMfg) is a new, relatively recently developed manufacturing paradigm. It is based on the service-oriented technologies and advanced computing technologies under the support of cloud computing, popular manufacturing models such as ASP, NM, AM, MGrid. Cloud manufacturing are the high-quality, effective, safe, reliable, cheap, on-demand manufacturing services for the whole lifecycle of manufacturing. It includes all steps of a product lifecycle - design, simulation, production, test and maintenance. Cloud manufacturing offers the capabilities of intelligent management, lets to share and jointly use the manufacturing capabilities and resources, transform them into the manufacturing services, the on-demand use of services is offered for all users involved to this manufacturing process.

Succeed in design Cloud Computing Diagrams, visually represent how cloud computing works and depict professionally Cloud Computing Architecture, with powerful tools of Cloud Computing Diagrams solution for ConceptDraw DIAGRAM software.

Let's see how to build the Cloud Computing Diagram on the example of building the Principal Cloud Manufacturing. Here is represented the chain of easy steps you need to follow for designing professional looking and attractive diagram representing the cloud manufacturing.

  • Create new document
  • Change document Page size in Document Properties - Page Size
    To see orientation buttons, select Page Size, other than your printer paper size
  • Select Orientation - Landscape

    How to Build Cloud Computing Diagram

  • Select Rectangle tool from the main toolbar and make it the same size as a page
  • Use Fill Inspector to change fill color of rectangle. For more specific color use Color Wheel

    How to Build Cloud Computing Diagram

  • Lock layer with rectangle in Inspectors - Layers
  • Select other Layer for next drawing
  • Add Guide line to the page center. Just drag and drop it from rulers

    How to Build Cloud Computing Diagram

  • Open Cloud Computing Diagrams Solution -> Cloud clipart library. Select Cloud shape
  • Drag Cloud shape from library to the page
  • Glue shape center to guide - glued points are marked in red.
  • Add label to shape - double click on share or just select shape and start typing
  • Move label - grab yellow diamond point with T.
  • Change text attributes in Inspectors - Text

    How to Build Cloud Computing Diagram

  • Add two more Cloud shapes
  • Bring to front first cloud using buttons on a toolbar
  • Add Network bus shape from Cloud clipart library
  • Rotate shape dragging a shape rotate tool

    How to Build Cloud Computing Diagram

  • Change background rectangle color using Color Slider. Also you can set a specific color in RGB, CMYC, HSB systems ets.
  • Change Network bus shape color
  • Add Rectangle, orange shape from Cloud shapes library and change the size
  • Type text for Network bus shape. To rotate text box use Rotate tool in text edit mode

    How to Build Cloud Computing Diagram

  • Increase shapes' sizes, replace
  • Snap to guides Cloud shapes placed to back

    How to Build Cloud Computing Diagram

  • You can change Snap Sensitivity in ConceptDraw DIAGRAM Preferences - General

    How to Build Cloud Computing Diagram

  • To make both back clouds same sizes, select them and use Shape Tool - Make Same - Size. All selected shapes will become the same sizes as main selected shape with green frame

    How to Build Cloud Computing Diagram

  • Add Square frame from Cloud shapes library around clouds on page
  • Duplicate orange Rectangle using Command+D few times
  • Replace rectangles and connect them using connector tool
  • Add Ellipse frame from library around rectangles
  • Change connectors arrows ends if needed
  • Specify arrows and frames color

    How to Build Cloud Computing Diagram

  • Add connectors and arrow one-way from Cloud Connectors library
  • Add connect dotted one-way shape and select color from this shape using eyedropper tool
  • You can add specific color to palette panel to access it more quickly

    How to Build Cloud Computing Diagram

  • Change color if needed, delete unnecessary shapes
  • Add text to one-way Arrow and to Ellipse frame. Set color and size for text. Replace if needed

    How to Build Cloud Computing Diagram

  • Add shapes from Cloud clipart library
  • Specify place, size, text and text color

    How to Build Cloud Computing Diagram

  • Replace inspectors
  • Add more shapes and texts
  • Specify attributes

    How to Build Cloud Computing Diagram

  • Zoom some area on screen
  • Correct it the way you need

    How to Build Cloud Computing Diagram

  • Add more shapes, connectors, text etc.
  • Specify attributes

    How to Build Cloud Computing Diagram

  • Open page navigator
  • Open context menu on page - select Adjust to Drawing Contents
    Note that this function apply to all pages and take into account page margins from printer settings

    How to Build Cloud Computing Diagram

  • Check if everything is correct
  • Your document is ready!
How to Build Cloud Computing Diagram<br>Principal Cloud Manufacturing *
  • All exporting commands are available at ConceptDraw DIAGRAM from the File menu. You can immediately apply them when your diagram is ready.

    Export Options

    Export to Adobe PDF

    Export to PowerPoint Presentation

    Export to MS Visio

    This Cloud Computing Diagram depicting the Principal Cloud Manufacturing is designed fast and easy thanks to the powerful drawing tools of ConceptDraw DIAGRAM software and numerous predesigned vector objects offered by the libraries of Cloud Computing Diagrams solution. It is a perfect example of fast and easy building processes in ConceptDraw DIAGRAM drawing Cloud Computing Diagrams and displaying the use of cloud manufacturing for streamlining manufacturing processes.


    Design with pleasure your own cloud-based systems and draw your own professional-looking, vivid and attractive Cloud Computing Diagrams with help of Cloud Computing Diagrams solution for ConceptDraw Solution Park.

    Make easier developing the cloud-based strategies in manufacturing and distribution industries, also in sphere of services with ConceptDraw DIAGRAM software. Use the cloud manufacturing for successful automatization customer services and optimization key areas in business field, create the cloud-based Human Resource Management (HRM) systems and Enterprise Resource Planning (ERP) solutions for manufacturing, apply the cloud manufacturing technologies in industrial, aerospace and defense industries.





    TEN RELATED HOW TO's:
    Audit Steps - The auditing process is an independent examination of data, statements, operations, records, financial or otherwise performances of an enterprise for any stated purpose. It is a complex process that includes 10 audit steps: Notification, Planning, Opening Meeting, Fieldwork, Communication, Draft Audit, Management Response, Final Meeting, Report Distribution, Feedback.Audit Steps *
    Picture: Audit Steps
    Related Solution:
    ConceptDraw Flowcharts visualize a process or algorithm of program as step/operation blocks of various shapes connected with arrowed lines showed the process flow direction. They are used to visualize business or technical processes and software algorithms.Selecting & Creating Flowcharts *
    Picture: Selecting & Creating Flowcharts
    Related Solution:
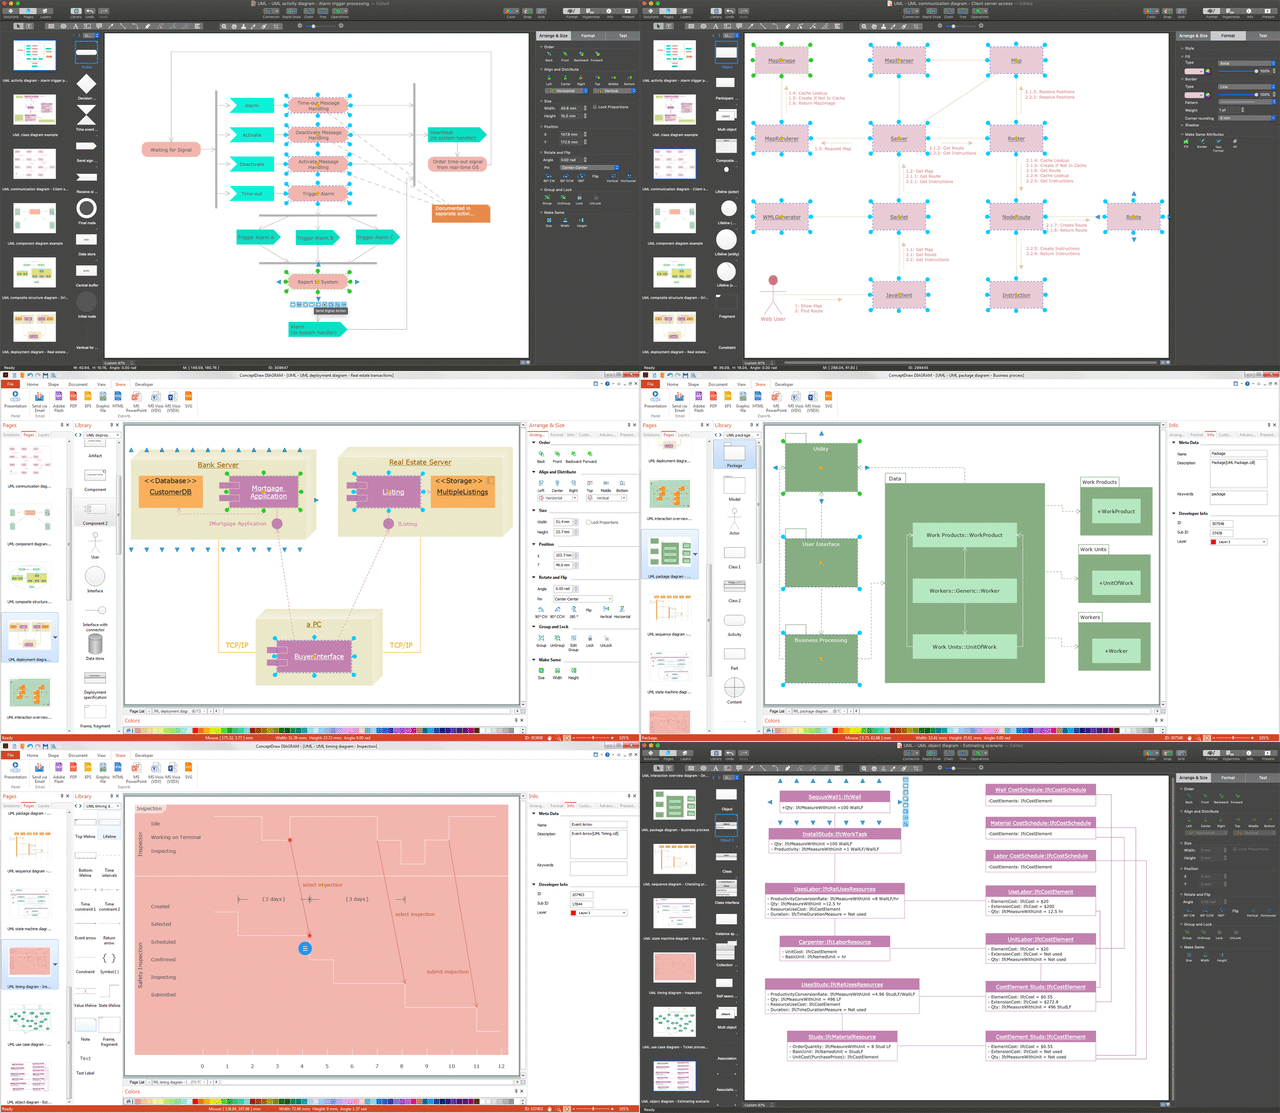
    While developing software, it is very important to have a visual model, because it helps to represent the logic and the architecture of an application. Experienced engineers use UML diagrams to denote relationships between classes and their instances. UML is a general language for a set of diagrams like deployment diagrams, object diagrams or use case diagrams. This diagram represents UML class diagram used for a software system development using an object-oriented method. Class diagrams are categorized as static structure diagrams that depict the physical structure of a system. Class diagram divides a software system's structure into "classes". Classes are defined by the methods and variables of objects. UML Class diagram is used to depict relationships and source code dependencies between objects.UML Diagram *
    Picture: UML Diagram
    Related Solution:
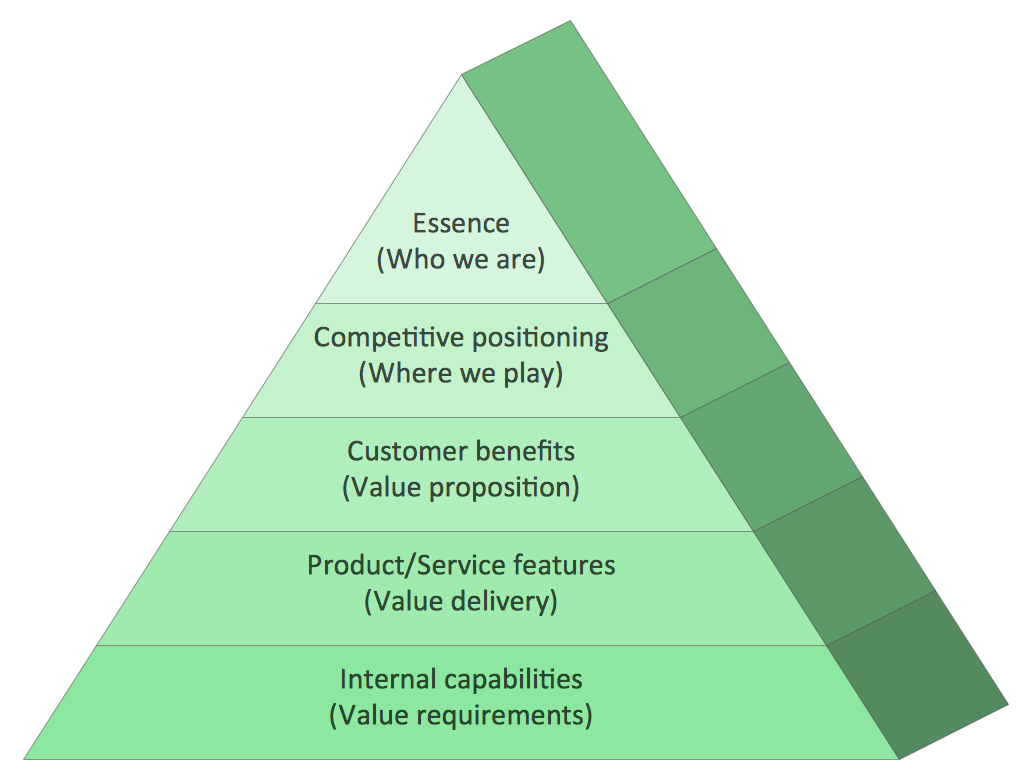
    Any hierarchical structure of any company can be represented as a triangle or a pyramid. You can create a pyramid diagram and pyramid chart of any complexity using special libraries included in ConceptDraw DIAGRAM. Actually, any knowledge or chain of facts can also be depicted as a pyramid. A wide range of graph and chart are utilized in marketing to maintain documentation and various visual issues, that deal with marketing information and data. The marketing value pyramid can be created to illustrate how the value of company, or product is based on its competitiveness. To design this diagram we used ConceptDraw DIAGRAM drawing tools in conjunction with Pyramid solution for Solution Park.Pyramid Diagram and Pyramid Chart *
    Picture: Pyramid Diagram and Pyramid Chart
    Related Solutions:
    Nodes of any computer network are somehow organized in a hierarchy or a layout. Some of the common layouts like star network topology are more reliable and some like ring topology withstand high loads better. It is also important to distinguish logical topologies from physical. This diagram represents a typical view of the star network topology. The star network topology is one of the most frequently used network topologies in the majority of office and home networks. It is very popular because of its low cost and the easy maintenance. The plus of the star network topology is that if one computer on the local network is downed, this means that only the failed computer can not send or receive data. The other part of the network works normally. The minus of using star network topology is that all computers are connected to a single point-switch, or hub. Thus, if this equipment goes down, the whole local network comes down.Star Network Topology *
    Picture: Star Network Topology
    Related Solution:
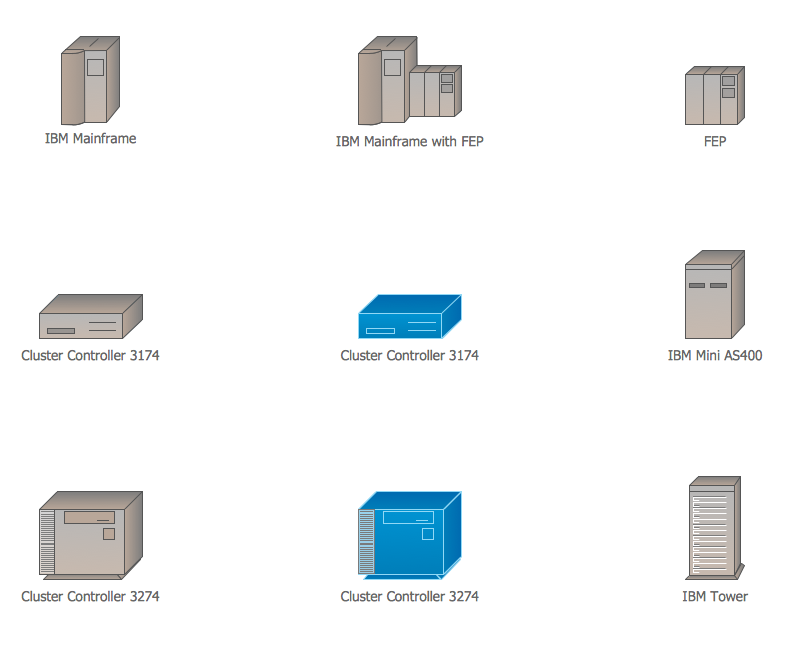
    The ConceptDraw vector stencils library Cisco IBM contains equipment symbols for drawing the computer network diagrams.Cisco IBM. <br>Cisco icons, shapes, stencils and symbols *
    Picture: Cisco IBM. Cisco icons, shapes, stencils and symbols
    Related Solution:
    Teams working with Scrum methodology use the product backlog items (PBIs), bug work item types (WITs), reports and dashboards. SCRUM Workflow solution for ConceptDraw DIAGRAM software offers collection of samples, variety of predesigned objects, clipart and graphic elements, a set of Scrum process work items and workflow which are developed for agile teams working using Scrum.Scrum process work items and workflow *
    Picture: Scrum process work items and workflow
    Related Solution:
    This sample was created in ConceptDraw DIAGRAM diagramming and vector drawing software using the UML Class Diagram library of the Rapid UML Solution from the Software Development area of ConceptDraw Solution Park. This sample describes the use of the classes, the generalization associations between them, the multiplicity of associations and constraints. Provided UML diagram is one of the examples set that are part of Rapid UML solution.UML Class Diagram Generalization Example<br>UML Diagrams *
    Picture: UML Class Diagram Generalization ExampleUML Diagrams
    Related Solution:
    Flow chart is a diagrammatic representation of an algorithm and essential part of planning the system. Flow charts are widely used in technical analysis and programming for easy writing programs and explaining them to others. So, one of the most popular type of flow charts is Technical Flow Chart. Technical Flow Chart can be drawn by pencil on the paper, but it will be easier to use for designing a special software. ConceptDraw DIAGRAM diagramming and vector drawing software extended with Flowcharts Solution from the Diagrams Area of ConceptDraw Solution Park will be useful for this goal.Technical Flow Chart *
    Picture: Technical Flow Chart
    Related Solution:
    ConceptDraw
    DIAGRAM 18