How to Construct a Fishbone Diagram
What is Fishbone, Ishikawa or Cause and Effect Diagram
A Cause and Effect diagram or Fishbone diagram shows the key points of business issues. So, let’s find out more about a Cause and Effect diagram.
This diagram helps understand the reasons of completed or potential actions by structuring their causes in smaller categories. Also, one can use it to see how the contributing factors are related to each other.
In everyday company routine, a Cause and Effect diagram is helpful with a number of regular activities like brainstorming, project management, and problem solving. A Cause and Effect diagram is often called a Fishbone diagram or Ishikawa diagram. It is also included into the Seven Basic Tools of Quality.
They are called Fishbone Diagrams because the outline of the finished diagram resembles a fish’s skeleton – with the ‘fish’s head’ on the right and ‘the tail’ on the left. Most such diagrams include common potential causes for any issue in question.
How to Construct a Fishbone Diagram
How to Construct a Fishbone Diagram? Construction a Fishbone diagram in professional diagramming software ConceptDraw DIAGRAM is more easy than you think. Just use the predesigned vector elements from the Fishbone Diagrams library for Fishbone Diagrams solution or one of plenty Fishbone templates and examples, and you will get a Cause and Effect diagram in minutes. Follow next steps for the constructing:
- Launch ConceptDraw DIAGRAM
- Set a page orientation: File – Page Setup – Horizontal Orientation – Ok.

- Open the Fishbone Diagrams library on the Libraries panel:

- Take an Effect (rectangle head) object from the library. Place it on the page.

- Take a Category object from the library. Connect it to one of the connection points.

- Repeat it as many times as necessary.

- Name the categories.

- Take a Cause object from the library. Connect it to the Category object.

- Holding down the Option key (ALT), copy the object. Place it on the diagram.

- Name the Causes.

- Take a Reason (secondary cause) object from the library. Connect it to the Cause object.

- Holding down the Option key (ALT), copy the object. Place it on the diagram.

- Select the Category objects. Holding down the Shift key, click successively on the needed objects.
- Open Color menu from the Toolbar – Shape Color – Change the color.

- Open the Text tab in Inspectors – Change text color.

- Select the diagram excluding the Effect object.
- Use Cmd+A – Holding down the Shift key, click the Effect object.
- Open the Line tab in Inspectors. Change the color.

- Select the arrow of the Effect object. Open the Line tab in Inspectors.
- Make the color same as of Category objects using the Eyedropper tool.

- Select the Cause text – Change Color.

- Set Alignment.

- Select the Reason objects. Holding down the Shift key, click successively on the needed objects.
- Open the Text tab in Inspectors. Set Color, Font, Size and Alignment.

- Take a Fish frame from the library. Place it on the page.

- Open the Line tab in Inspectors – Change Color and Width.

- Select the rectangle head of the Effect object – delete it.

- Use the Search option on the Library panel to find a needed object.

- Take a Coffee cup object. Place it on the diagram.

- Now your Drawing is ready.
- You may save it or export to different formats via the File menu.
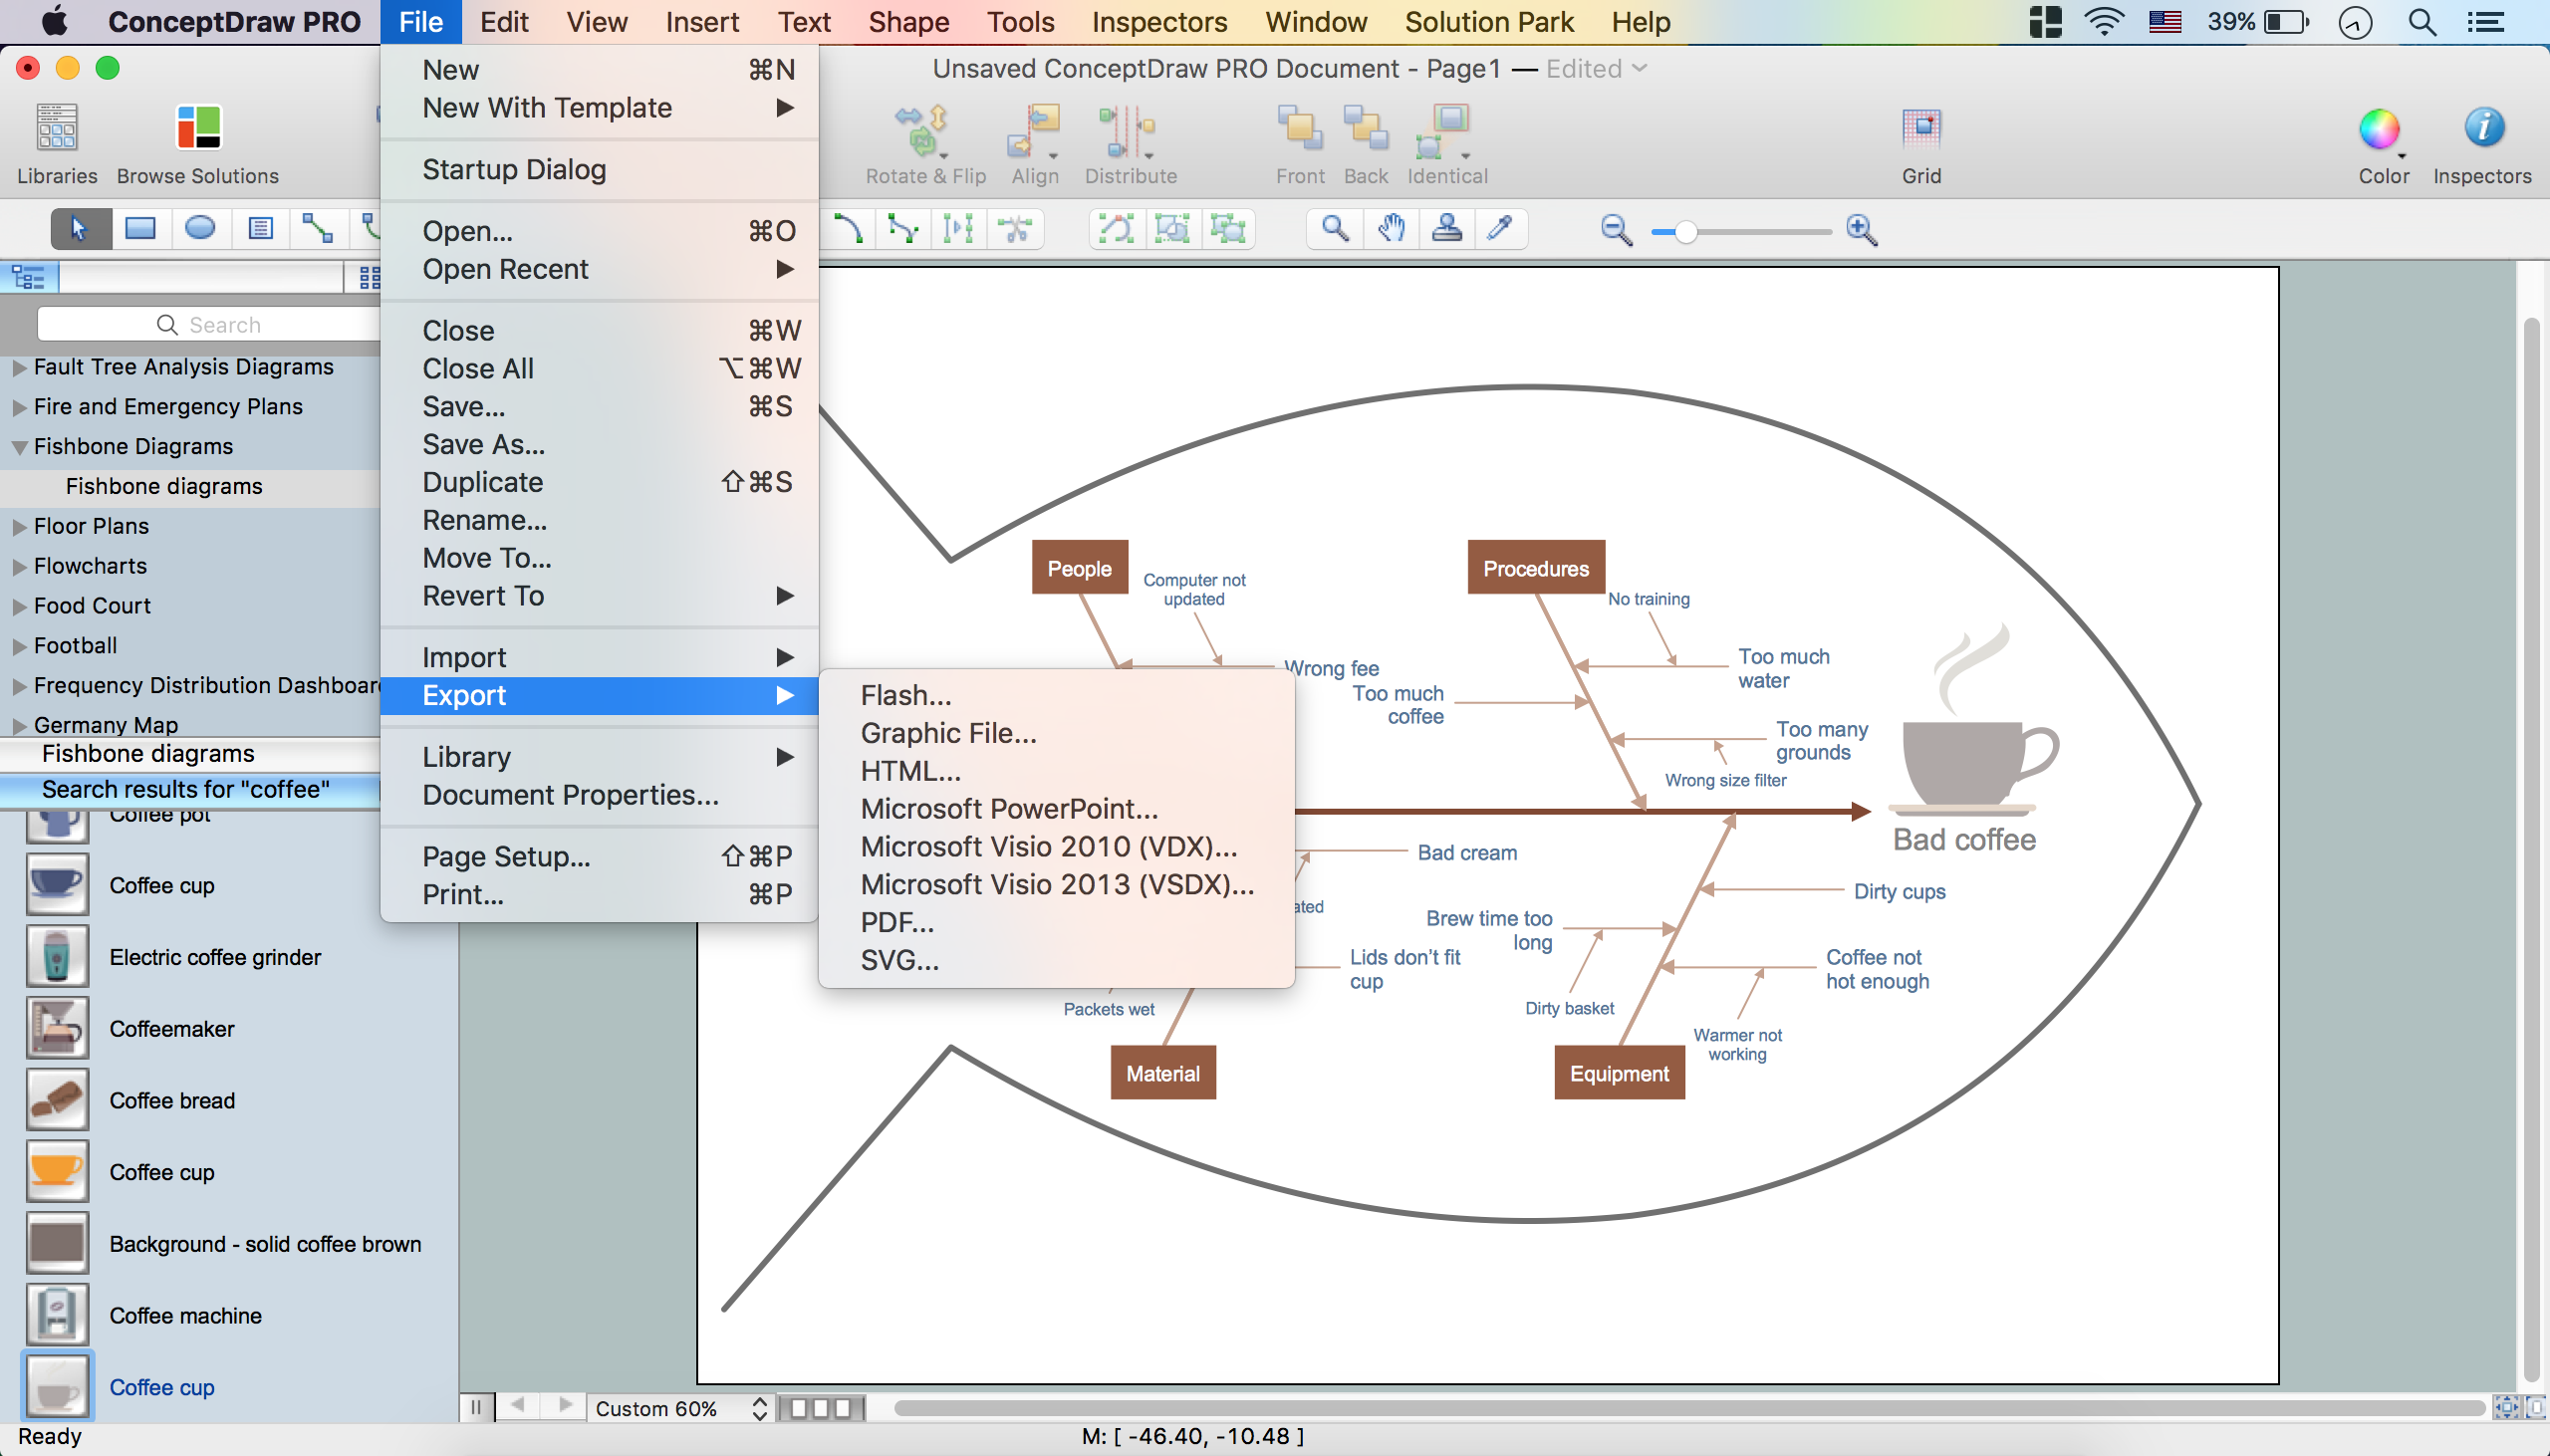
The possibility of exporting to variety of popular graphical formats (PNG, JPEG, JPG, GIF, TIF, TIFF, BMP, DIB, EMF, SVG) and file formats, such as Microsoft PowerPoint (PPT), Adobe Acrobat (PDF), Microsoft Visio (VDX, VSDX), Adobe Flash (SWF), Encapsulated PostScript (EPS), HTML, opens wide opportunities for you.
The Fishbone Diagrams Solution for ConceptDraw DIAGRAM Solution Park is available for all ConceptDraw DIAGRAM or later users. Use it for easy and effective cause and effect analysis and problem solving.
TEN RELATED HOW TO's:
Working with personnel might be difficult if you are not prepared enough. To explain your workers all the details of communication with customers, you can draw an order process flowchart which will describe every step of the process and answer all the questions that might appear. You can view a lot of business process mapping diagram examples here, in ConceptDraw Solution Park.
This business process flow chart is created to illustrate the sample work order process. Before an organization can make some work for a person, the customer work order request must be completed. It is needed for tracking and accountability objectives. We used this business process flowchart to show a certain tasks and actions assumed by an organization. This flowchart depicts the outside inputs that are needed to launch a process, and ways the organization delivers its outputs. This business process flowchart was created with a help of ConceptDraw Business Process Mapping solution.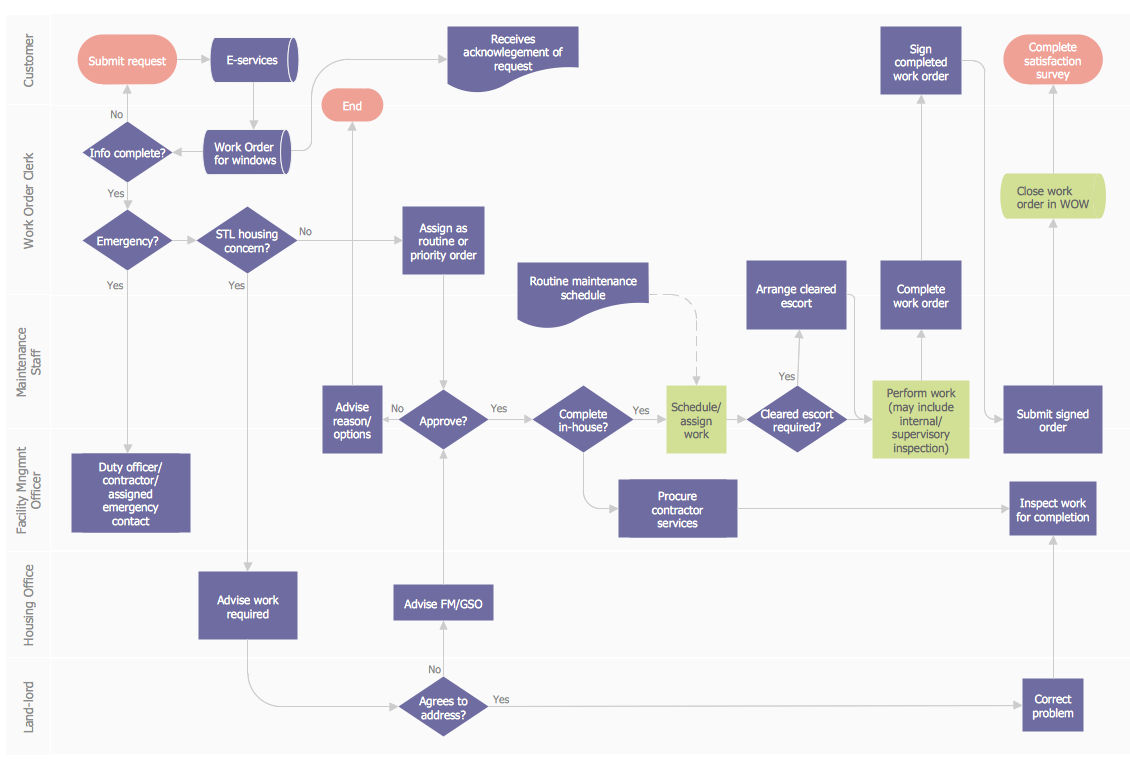
Picture: Work Order Process Flowchart. Business Process Mapping Examples
Related Solution:
ConceptDraw DIAGRAM extended with Seven Management and Planning Tools Solution from the Management Area of ConceptDraw Solution Park is the best software for drawing all types of diagrams from the Seven Management and Planning Tools: Affinity Diagram, Relations Diagram, Prioritization Matrix, Root Cause Analysis Tree Diagram, Involvement Matrix, PERT Chart, and Risk Diagram (PDPC).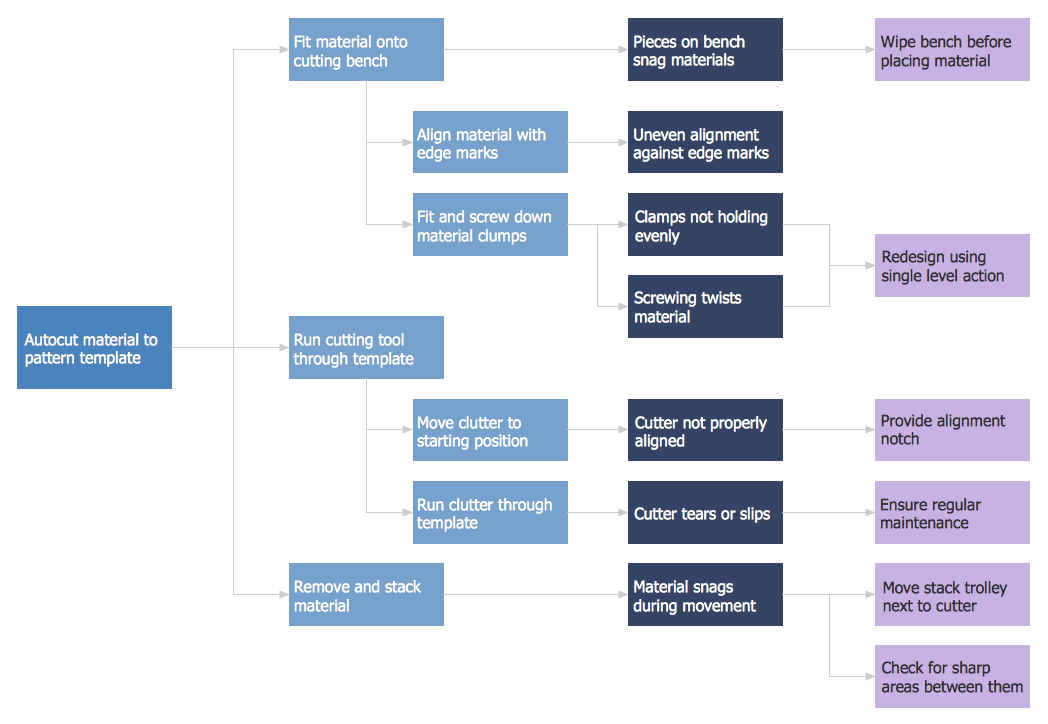
Picture: PDPC
Related Solution:
Mongolia is a landlocked country in Central Asia.
The vector stencils library Mongolia contains contours for ConceptDraw DIAGRAM diagramming and vector drawing software. This library is contained in the Continent Maps solution from Maps area of ConceptDraw Solution Park.
Picture: Geo Map - Asia - Mongolia
Related Solution:
The Building Plans area of ConceptDraw Solution Park includes a set of solutions of Interior Design. The Interior Design solutions for ConceptDraw DIAGRAM allow you simply and quickly create the professional looking Building Plans that will help you to design, redesign your room, flat, home, office, cafe or any other building. Having the ready plan of the rooms you can easy rearrange the furniture, interior objects on the plan and see the future result at once.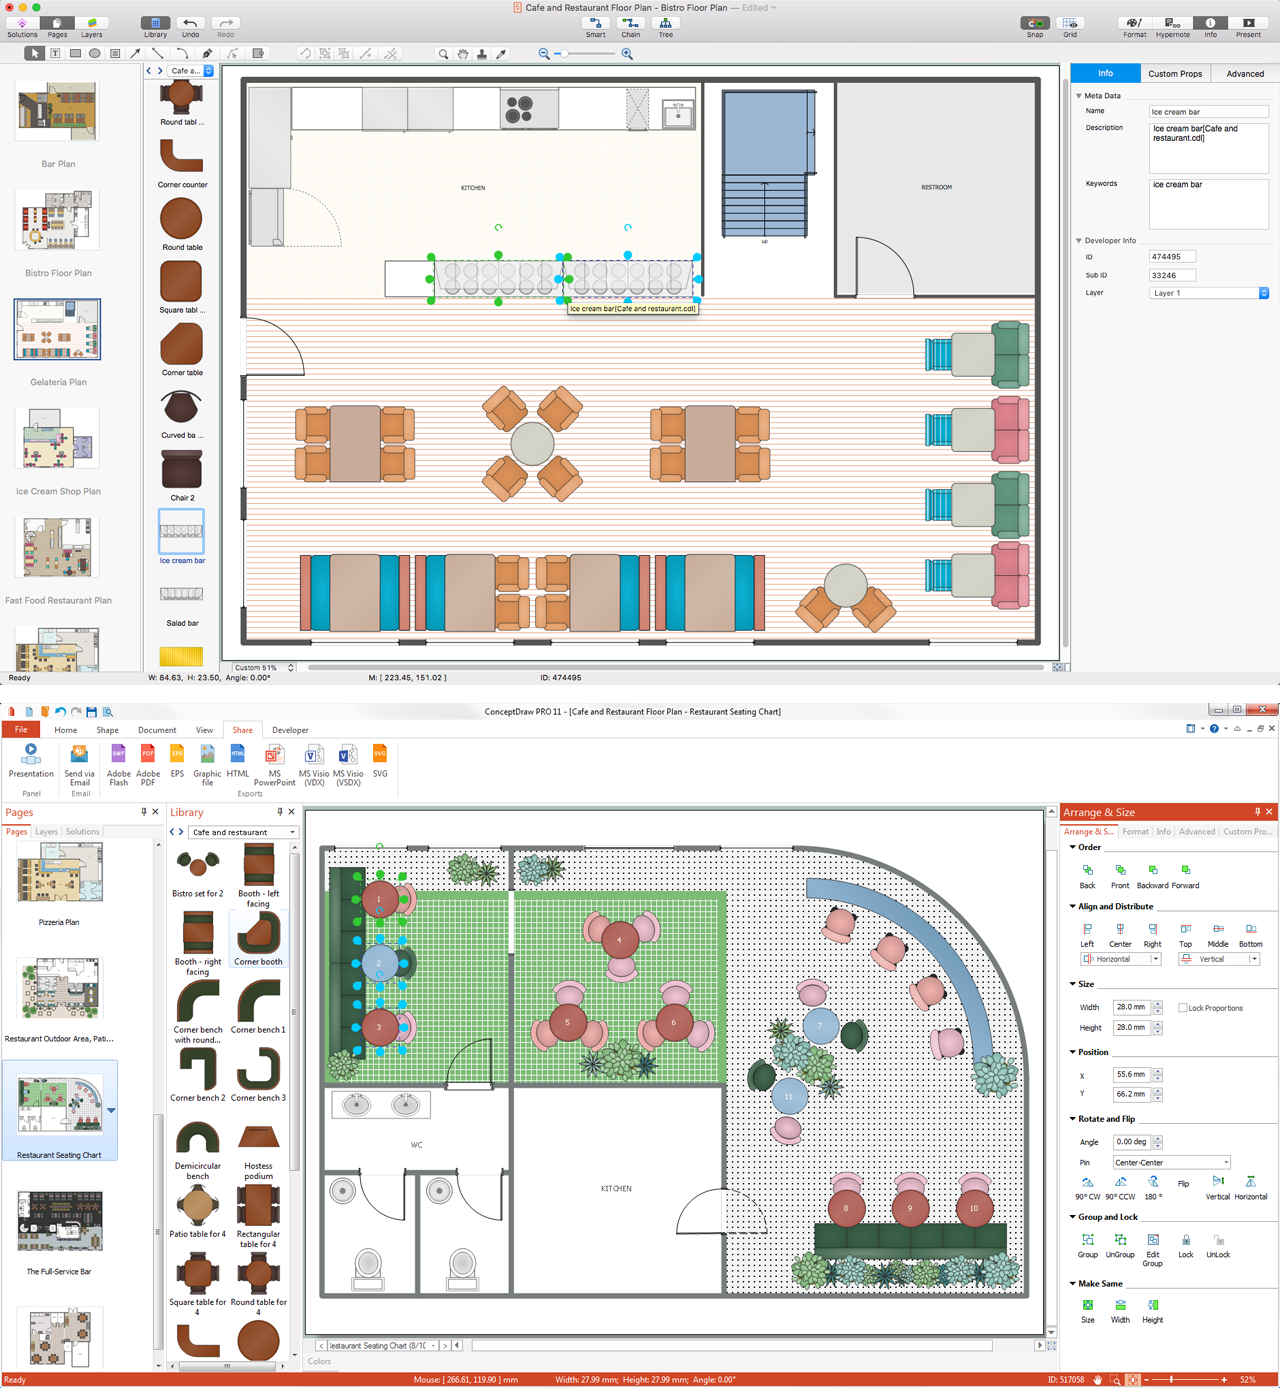
Picture: Interior Design Software. Building Plan Examples
Related Solution:
It can be tough to get straight into business papers and processes.Otherwise, you can learn how to create flowcharts for an accounting information system and visualize these documents. Accounting diagrams are clear and easy to understand for all the participants of the process.
There are symbols used for creating accounting flowcharts using ConceptDraw DIAGRAM and its Accounting Flowcharts solution. Accounting flow charts are a special kind of flow charts. Actually a variety of flowcharts are often used to facilitate many aspects of a workflow of accounting department. Accounting flowcharts are utilized to support creating accounting documentation, to depict positions responsible for fulfillment of each phase of accounting workflow.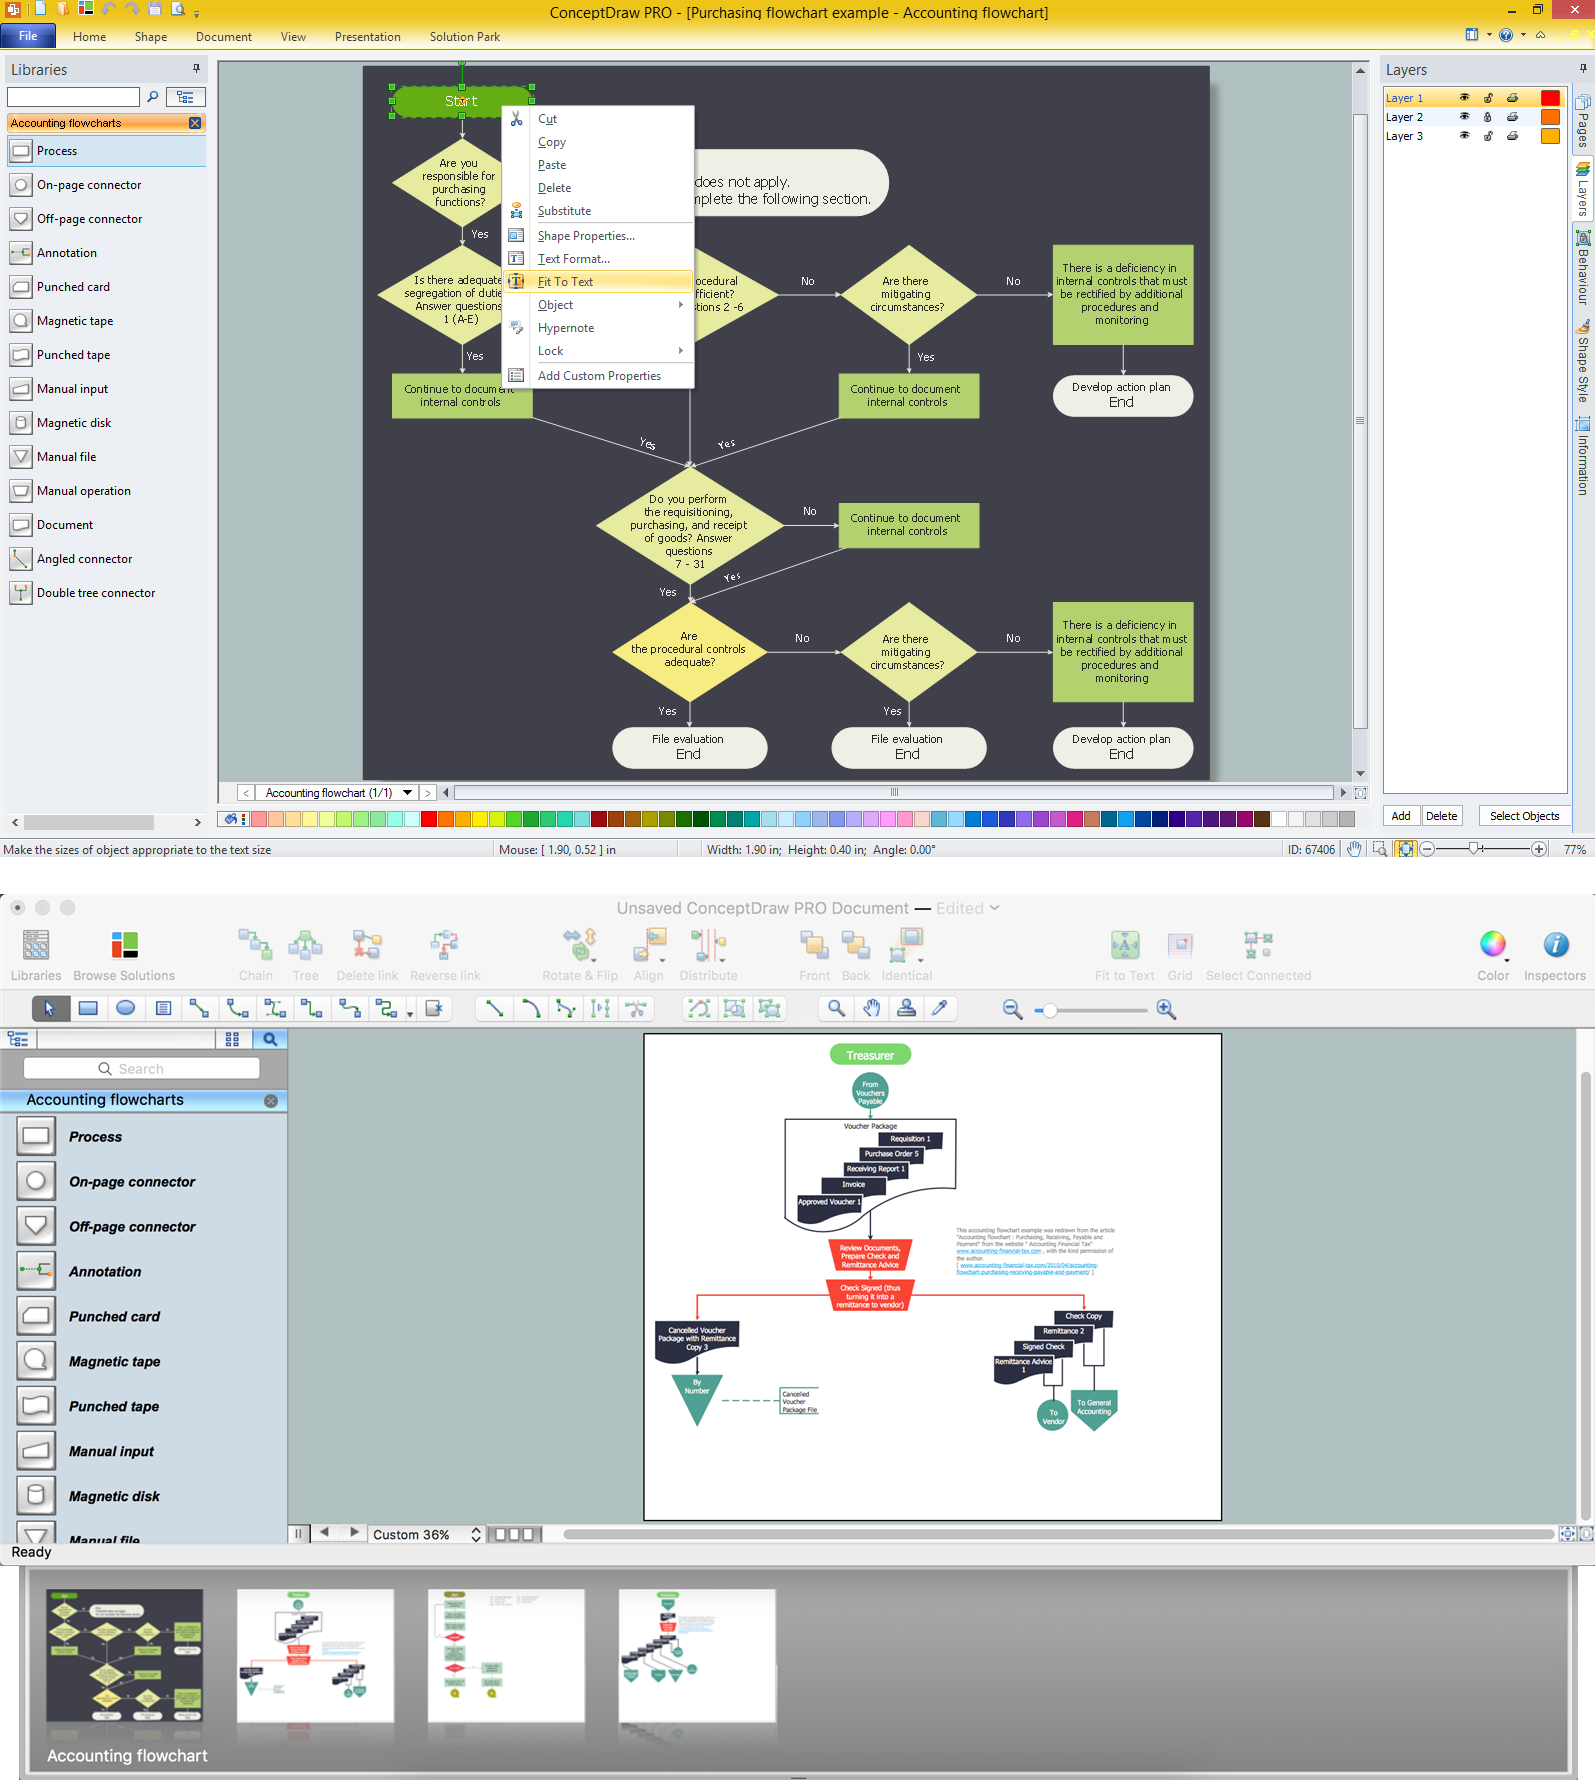
Picture:
How to Create Flowcharts for an
Accounting Information System
Related Solution:
An abstract representation is usually the first thing you will need while developing a database. To understand the ways that databases are structured, you should look through entity-relationship diagram examples and see the notations features and attributes. With an entity-relationship model you can describe a database of any complexity.
This Entity-relationship diagram is a tool for software developers. It enables every element of database to be managed, communicated and tested before release. This ERD was created using symbols advocated by Chen's notation. Because of a linguistic origin of the Chen’s notation, the boxes representing entities could be interpreted as nouns, and the relationships between them are in verb form, shown on a diagram as a diamond.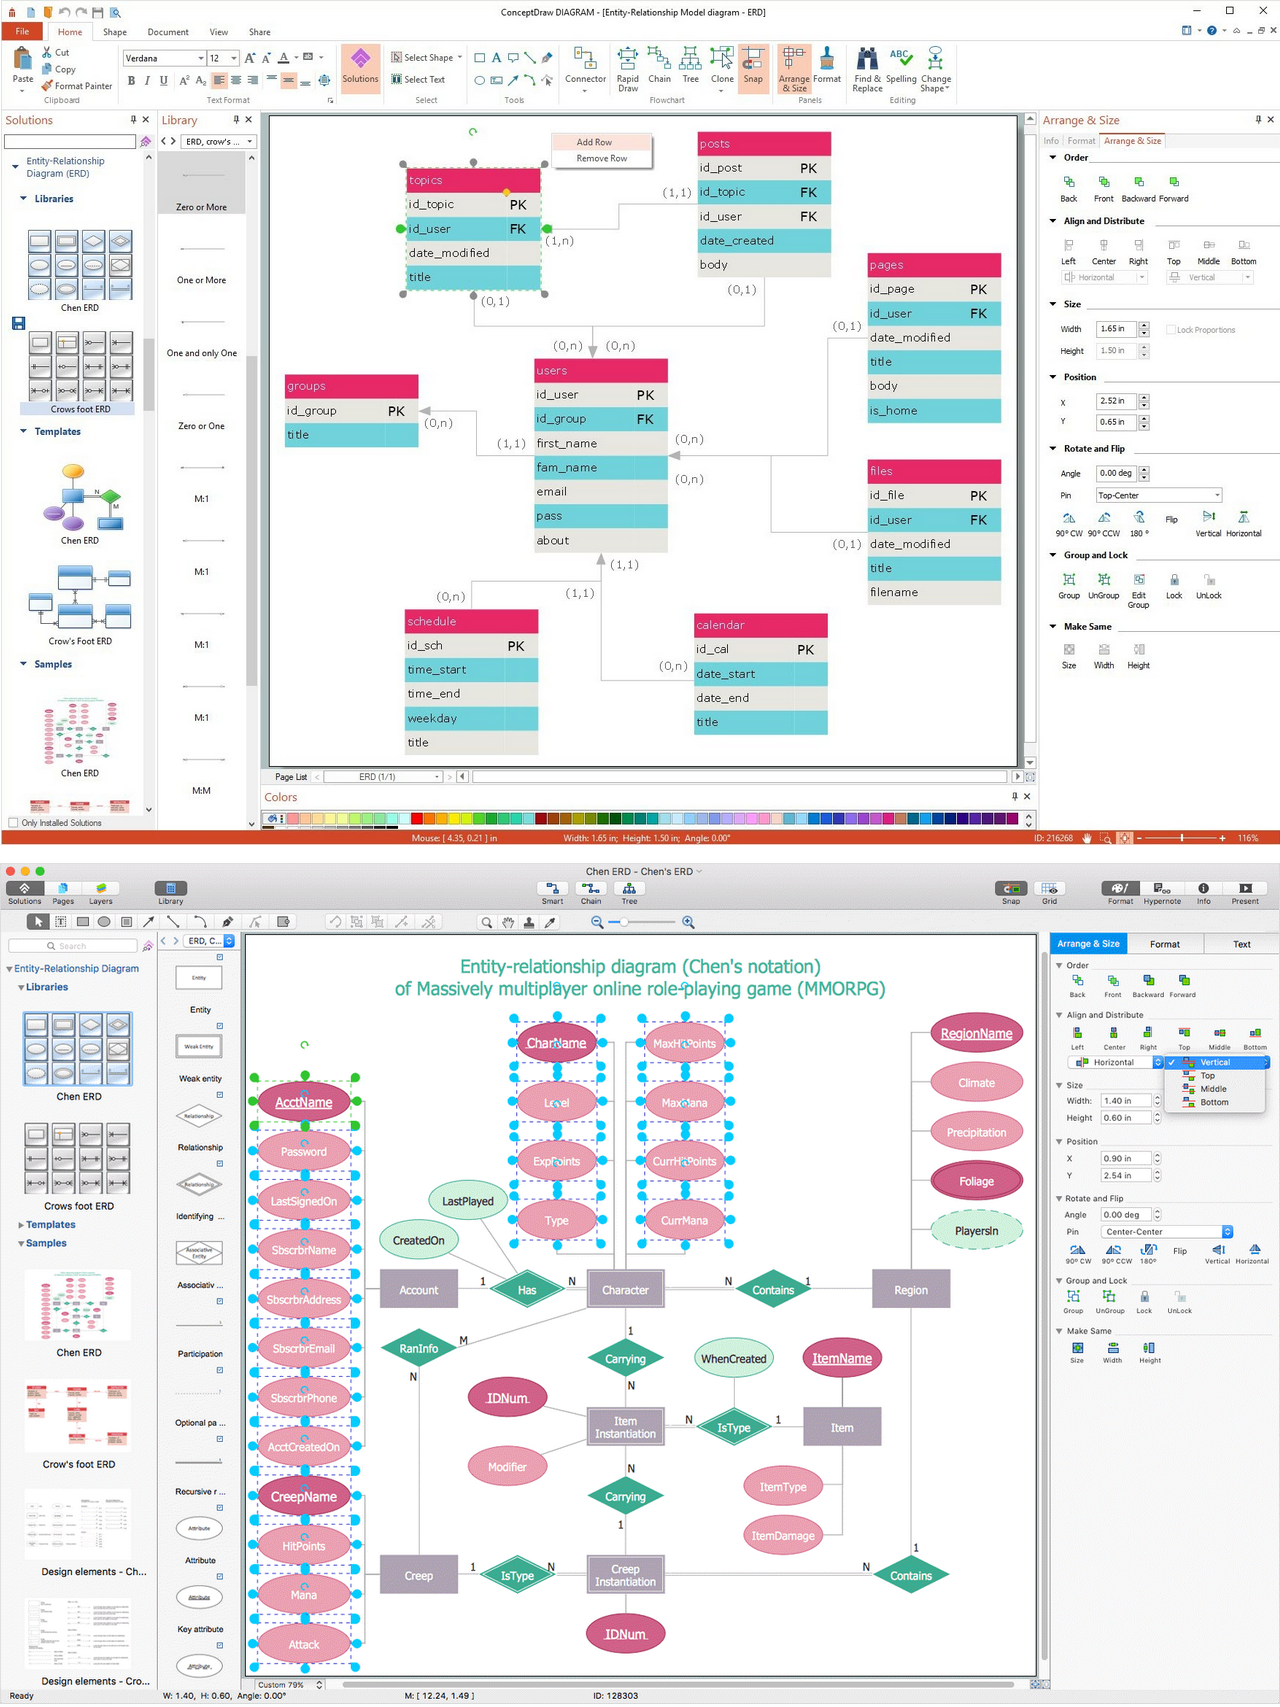
Picture: Entity Relationship Diagram Examples
Related Solution:
Everyone who starts the construction, repair or remodeling of the home, flat or office, is facing with a need of visualization its ideas for visual explanation how all should to be for the foreman and construction team. It is incredibly convenient to use for this professional home architect software. ConceptDraw DIAGRAM software enhanced with Floor Plans solution provides a lot of built-in drawing tools which allow you quick and easy create design plans for the home of your dreams.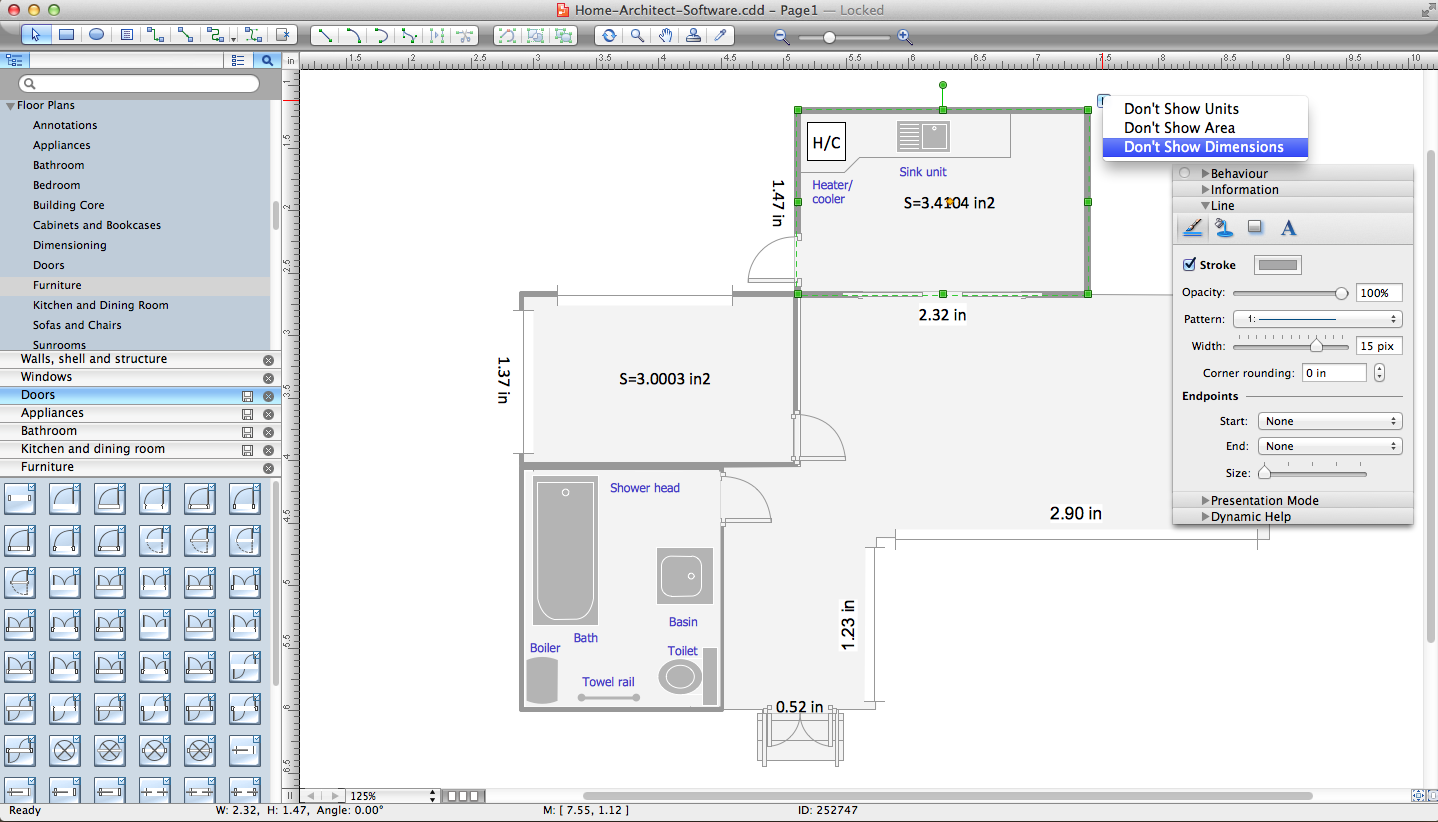
Picture: Home Architect Software. Home Plan Examples
Related Solution:
ConceptDraw DIAGRAM has the powerful tools for rapid drawing Fishbone diagrams and identifying many possible causes for an effect for problem solving. Causes can be grouped into major categories to identify these sources of variation. Easy create Fishbone diagrams with the ConceptDraw DIAGRAM software and Fishbone Diagrams solution included to ConceptDraw Solution Park!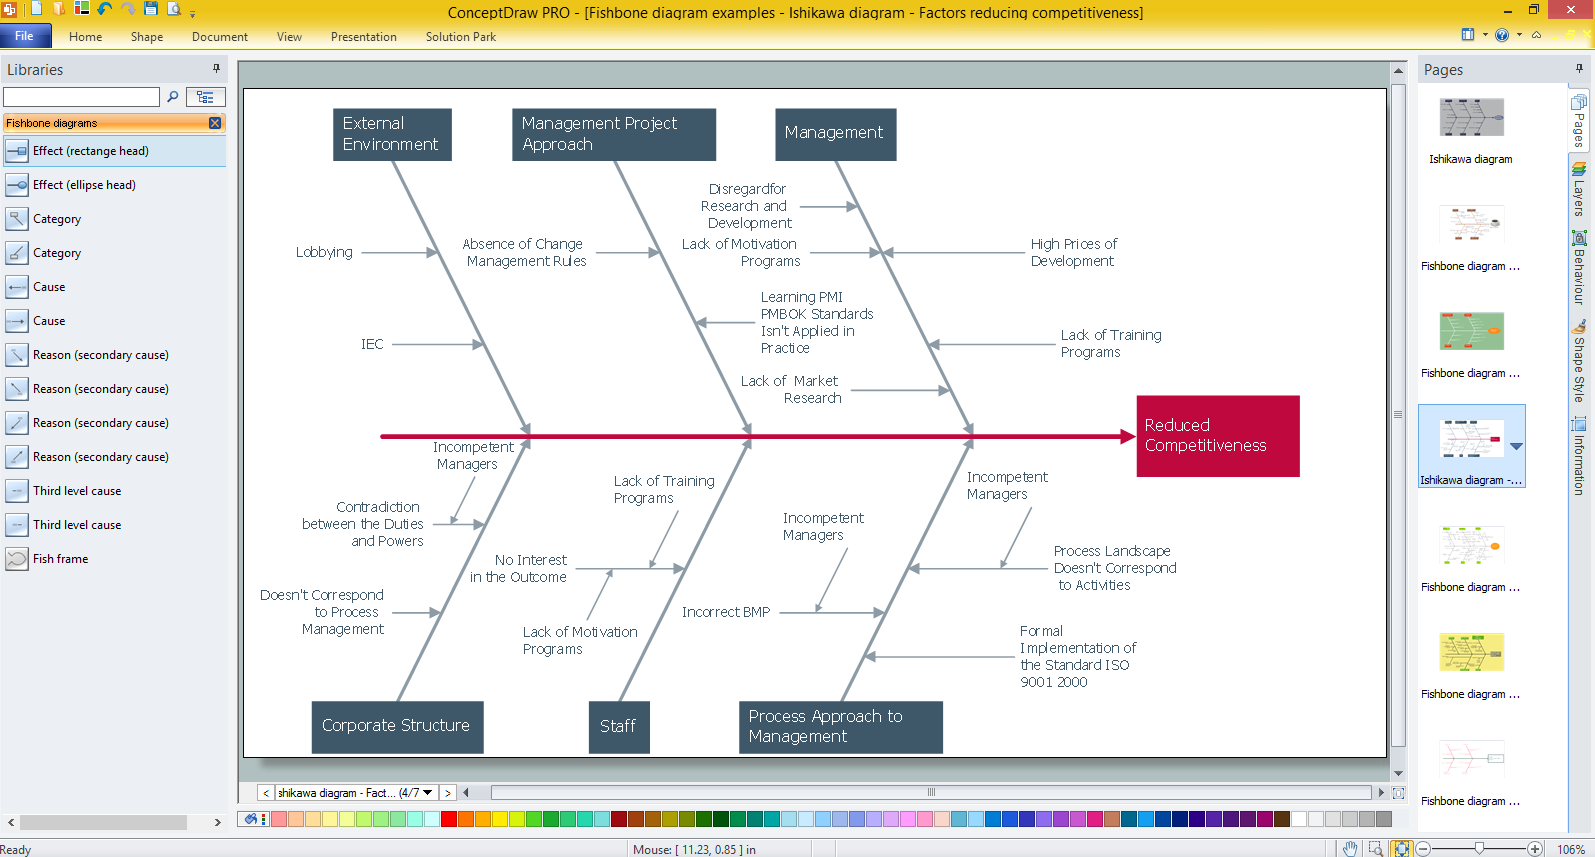
Picture: Create Fishbone Diagrams with the ConceptDraw
Related Solution:


