How to Create a Powerful Infographic
When You do Not Have a Designer
ConceptDraw DIAGRAM is an infographics tool with more than 100 library objects that is a scalable vector images. With the Spatial Infographics solution which contains spatial infographics samples, map templates to be filled in for main design elements of spatial infographics.
The addition of this new solution permits users to quickly and easily draw professional infographics that quickly orient viewers so they can be self-directed to a point of interest.
The infographic document that was made by Spatial Infographics solution can be easily exported to PDF format, Microsoft PowerPoint, Microsoft Visio, graphic image file, or HTML.

Sample 1. Spatial infographics - The 100th Tour de France 2013.
Solution Spatial Infographics from ConceptDraw Solution Park extends ConceptDraw DIAGRAM vector diagramming and business graphics software with easy-to-use spatial infographics drawing tools.
Use Solution:
- Graphic Communication
- Information Visualization
- Data Journalism and Visual Statistics
- Visual Learning
- Knowledge Visualization
- Spatial Infographics Templates and Examples
- Infographics Vector Elements
This solution contains spatial infographics samples, map templates to be filled in, and libraries of vector stencils for main design elements of spatial infographics.
Use this solution to draw your own geospatial infographics documents with thematic maps, road maps, directional maps and transport maps.
FOUR RELATED HOW TO's:
Local area network connects computers and other network appliances within an area, such as office building or a campus. It can be difficult to provide such network without a predesigned plan. For these purposes you can use network diagram software, which helps you to create LAN network diagrams and office network diagrams quickly and effortless. This will speed up your work and you can save the diagram for the future network improvements.
The following diagram illustrates a network topology of the small office. LAN configuration has a star topology. The local network joins 8 computers among which are several desktop PCs, laptop, two iMacs and iBook. The end-point devices are divided into three groups. Each group is connected to its hub. There is a network printer and a modem, which are interconnected with other devices through a network server. Each computer on the LAN can access the server through a corresponding hub.
Picture: Network Diagram Software. LAN Network Diagrams. Physical Office Network Diagrams
Related Solution:
It can be tough to get straight into business papers and processes.Otherwise, you can learn how to create flowcharts for an accounting information system and visualize these documents. Accounting diagrams are clear and easy to understand for all the participants of the process.
There are symbols used for creating accounting flowcharts using ConceptDraw DIAGRAM and its Accounting Flowcharts solution. Accounting flow charts are a special kind of flow charts. Actually a variety of flowcharts are often used to facilitate many aspects of a workflow of accounting department. Accounting flowcharts are utilized to support creating accounting documentation, to depict positions responsible for fulfillment of each phase of accounting workflow.
Picture:
How to Create Flowcharts for an
Accounting Information System
Related Solution:
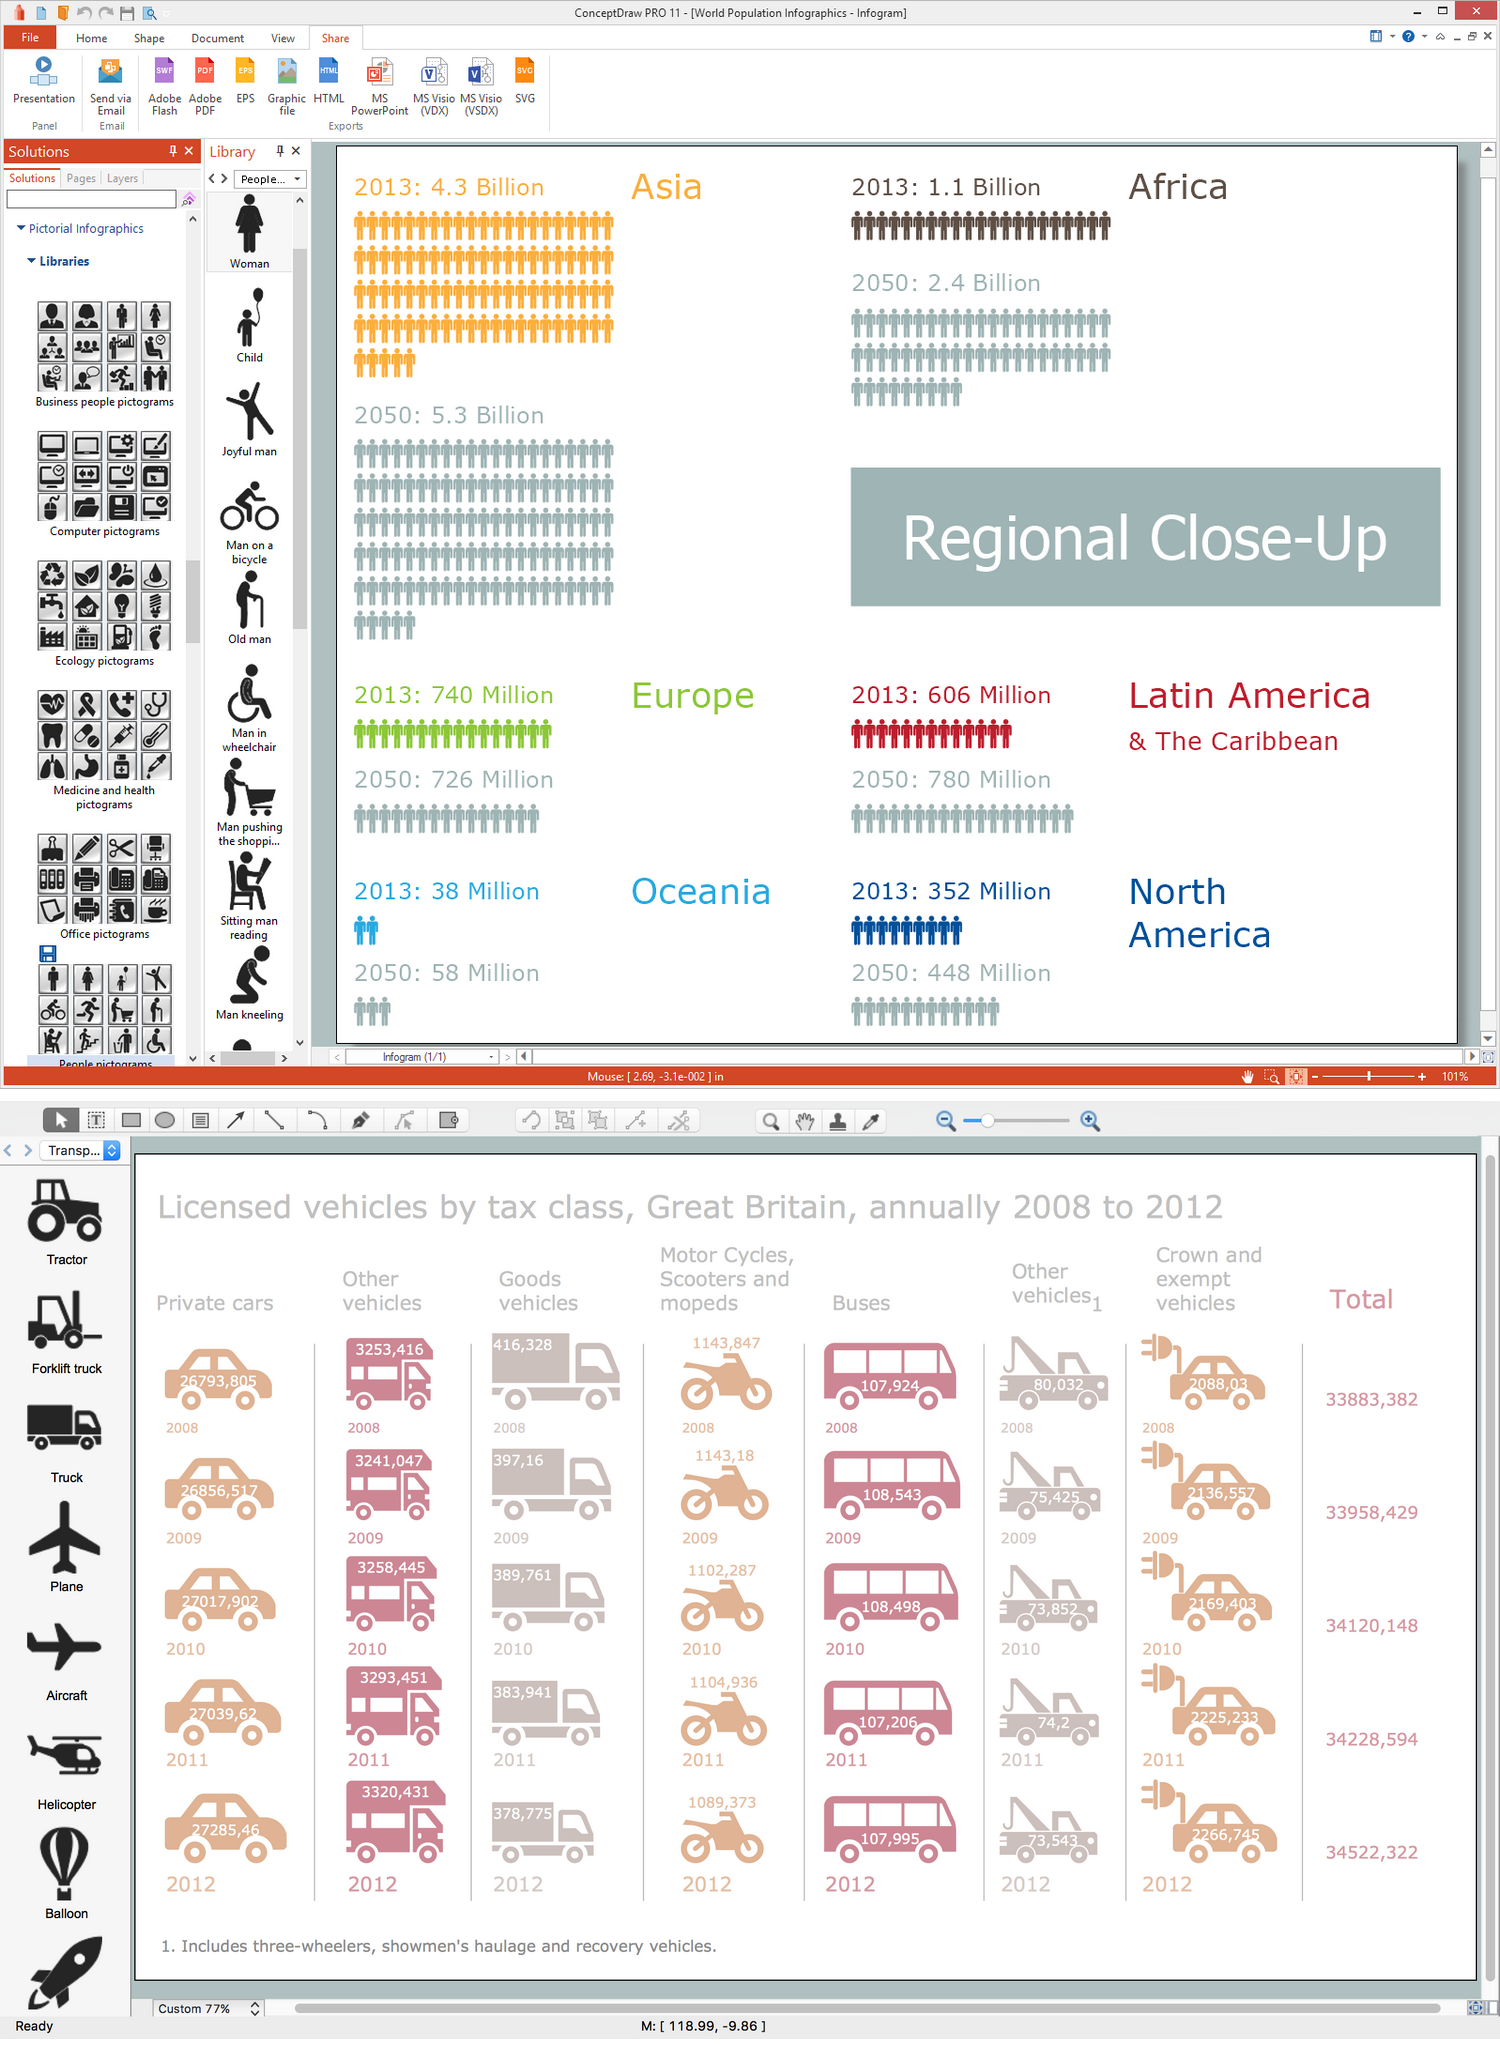
ConceptDraw DIAGRAM extended with Pictorial Infographics Solution from the “Infographics” Area is a powerful Infographic Software. Make sure in it right now!
Picture: Infographic Software
Related Solution:


