How to Create Gantt Chart
|
To begin managing a new project, you will need to define the individual Tasks that must be completed to deliver it. The default view for a new project in is the Gantt Chart. The left pane of a Gantt chart displays a list of project Tasks. The right pane displays a calendar and timeline of those tasks. |
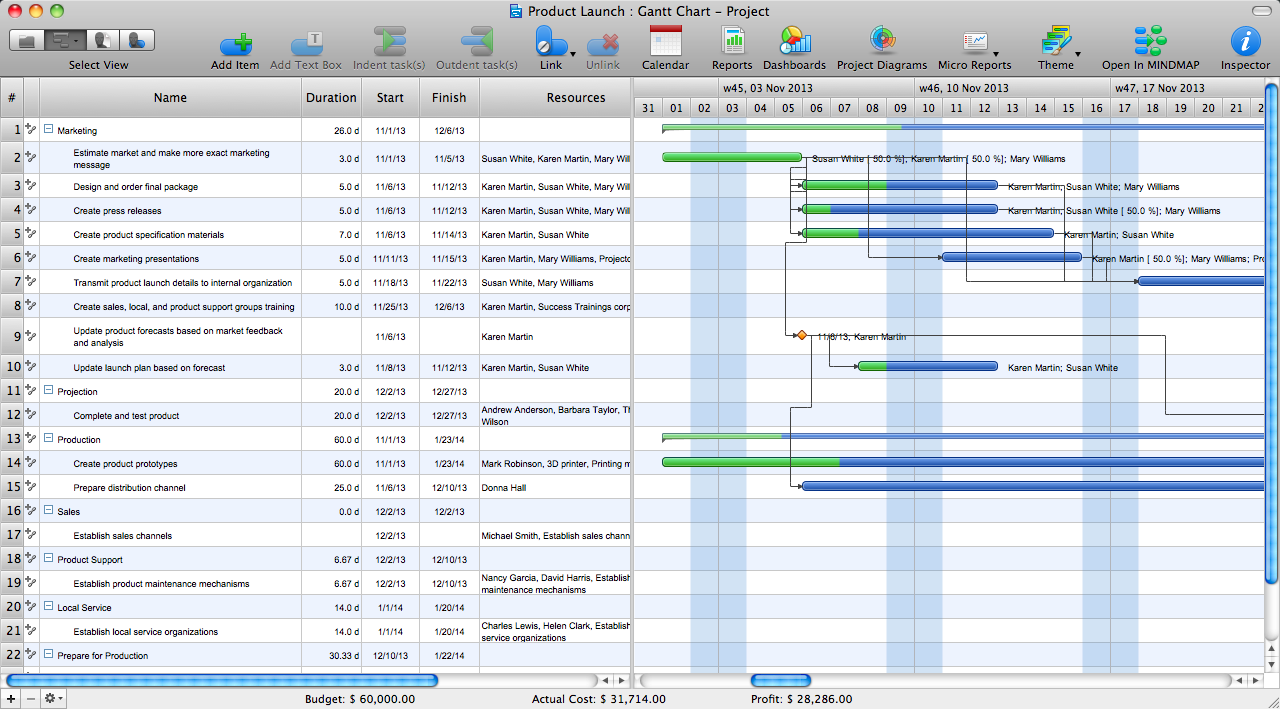
Pic. 1. ConceptDraw PROJECT - Gantt chart view.
- The first step in planning a new project is to create a list of the different tasks and phases in your project. There are several ways to add tasks to your Gantt Chart. The simplest way it to press the Add button
 on the toolbar. You can also press the Enter key on your keyboard.
 - The Gantt Chart table has columns for all of your project data, like task name, start and finish dates, duration, and completion level. Name the Task, and assign its duration. You can do so by double-clicking on the fields in the left pane of the Gantt chart, and then typing on your keyboard. Or simply drag and drop your tasks in the right pane of the Gantt chart to where you want them.
- You can also easily change a task’s start and finish dates. Either manually enter the data into the table, or drag the edge of the task to lengthen or shrink it in the graphical timeline view.
- Group Tasks into Phases. Use the Indent button
 create project phases on the Home toolbar to subordinate a Task, thereby making the dominant item into a Phase.
 - To establish a relationship between Tasks, select two or more Tasks on the Gantt chart, and then click the Link button
 to link project tasks on the toolbar.
 - The Gantt Chart also allows you to indicate a task’s priority level. Task colors can be used to highlight your tasks to draw attention to certain sections of your project.
You can also learn how to further manage the project task list.
TEN RELATED HOW TO's:
ConceptDraw PROJECT’s powerful reporting engine lets you generate a set of tabular reports with just one click, or visualize your project as Radial Tasks Structures, Work Breakdown Structures and Resource Calendars. It also provides you with dynamic Project Dashboards.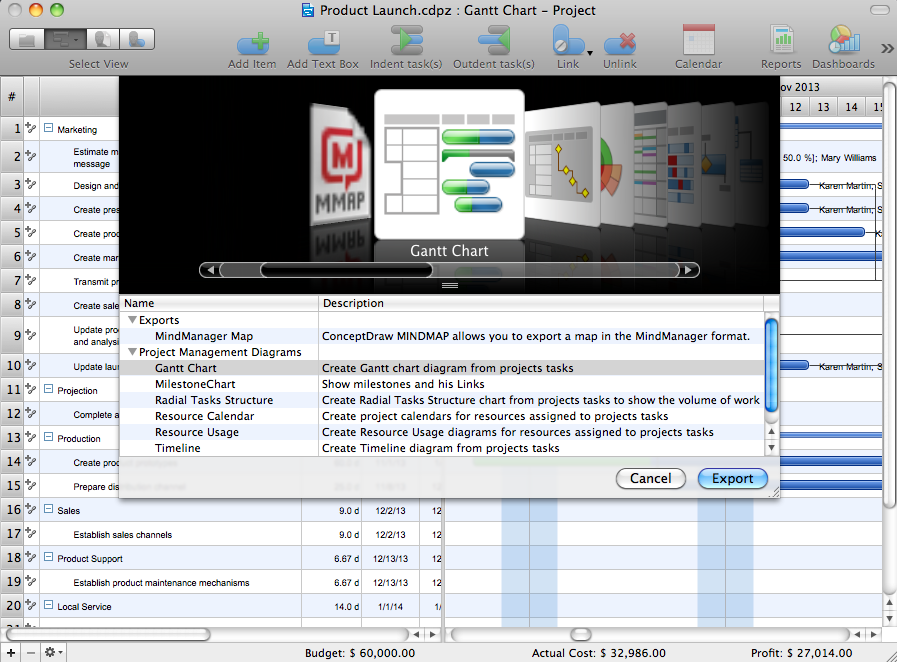
Picture: How to Report Task's Execution with Gantt Chart
During the planning, discussing and execution of a project you may need to prepare a presentation using project views such as the Gantt Chart, Multiproject Dashboard or Resource Usage View. It’s easy do with ConceptDraw PROJECT!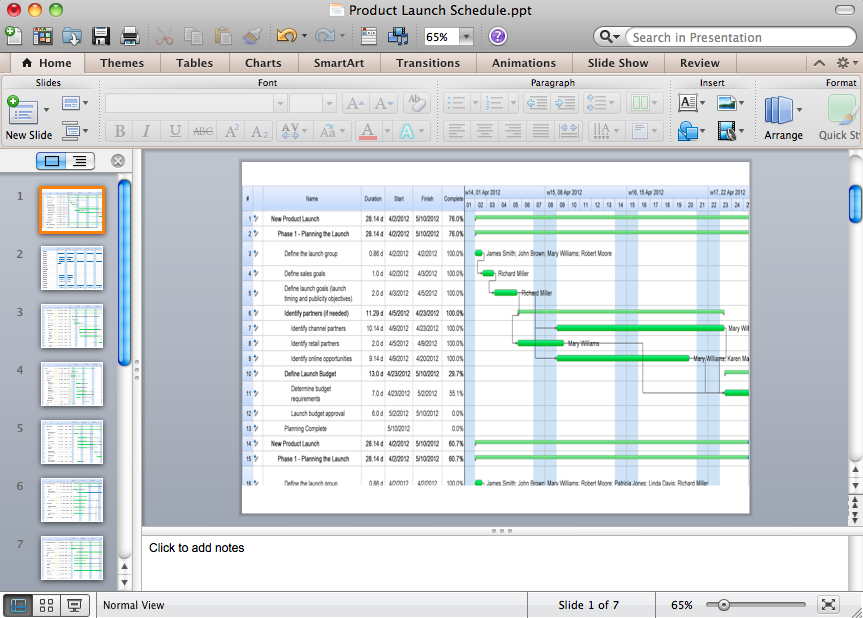
Picture: How to Create Presentation of Your Project Gantt Chart
There are numerous articles about the advantages of flowcharting, creating business graphics and developing different charts. Nevertheless, these articles are almost useless without the main component - the examples of flowcharts, org charts and without a fine example, it is difficult to get all the conveniences of creating diagrams. You can find tons of templates and vivid examples on Solution Park.
This illustration shows a variety of business diagrams that can be created using ConceptDraw DIAGRAM. It comprises a different fields of business activities: management, marketing, networking, software and database development along with design of infographics and business illustrations. ConceptDraw DIAGRAM provides a huge set of sample drawings including business process modeling diagrams,, network diagrams, UML diagrams, orgcharts, DFD, flowcharts, ERD, geographical maps and more.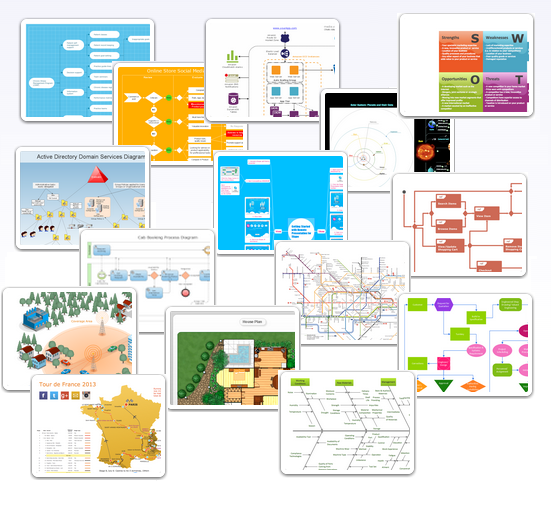
Picture: Examples of Flowcharts, Org Charts and More
Related Solution:
Historical reference about the Gantt chart.
Picture: What is Gantt Chart (historical reference)
ConceptDraw PROJECT is a powerful Gantt Chart Software. The Gantt Charts are useful for displaying a large amount of detailed information, project tasks and timelines in a visually pleasing, easy-to-understand format.
ConceptDraw PROJECT provides wide capabilities of importing and exporting in various formats: Microsoft Project, ConceptDraw MINDMAP , Mindjet MindManager, PDF file.
Picture: Gantt Chart Software
When we think about programming, we usually imagine sleepless nights spent on writing kilobytes of code. However, from another point of view, Software development with ConceptDraw DIAGRAM makes a programmer's life endlessly easier. This tool is unique to fulfill all your needs in short period of time.
Over the recent years object-oriented methodology has become more and more widespread. Thanks to this methodology developers manage to deal with growing complexity of applications. More and more programs are written in such programming languages as C++, Java, Visual Basic and Object Pascal. However, the complexity of the designed systems imposes extended requirements as to design of graphic documentation. ConceptDraw possesses powerful tools for designing of technical documentation for object-oriented projects. The libraries included in the package allow to easily draw class hierarchies, object hierarchies and diagrams of data flows with the use of the most popular notations, including UML and Booch notations. And the library for projecting COM-interfaces will spare developers of ActiveX-servers a headache.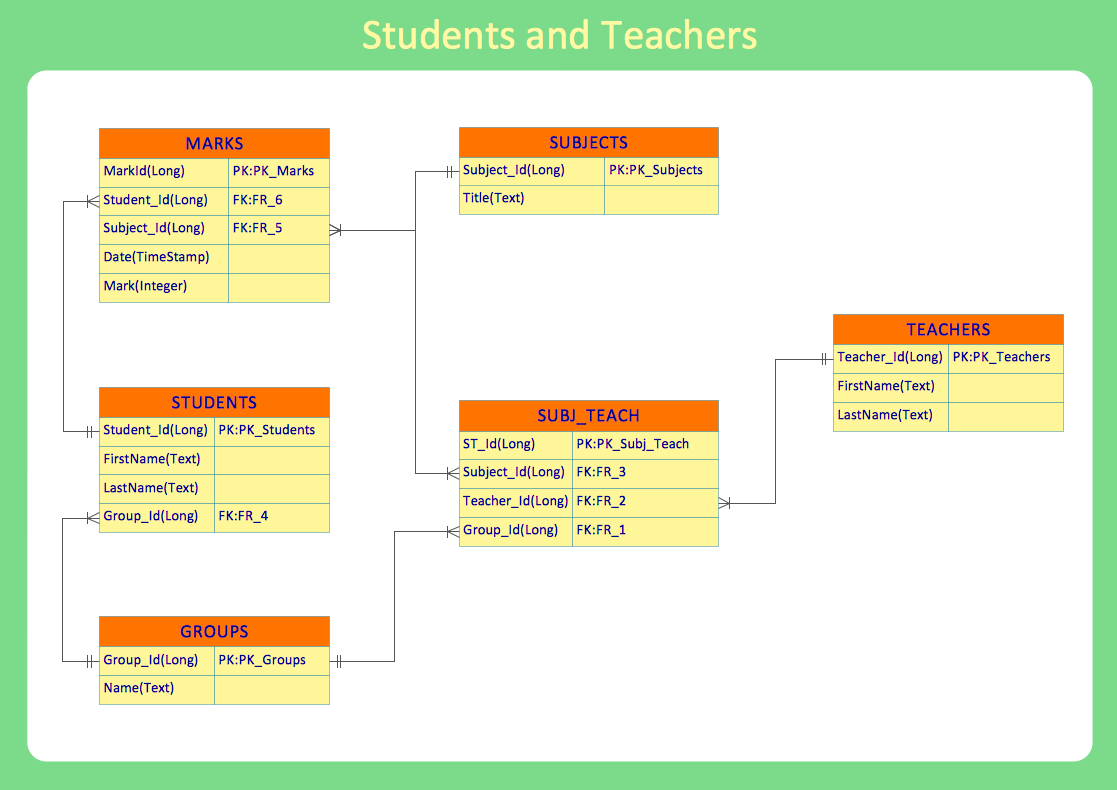
Picture: Software development with ConceptDraw DIAGRAM
Sometimes, when it is difficult to create a functional space plan or to rearrange existing one, the art of interior design comes in. It doesn't matter, if you need a cozy bedroom or an office layout plan, you should use appropriate tools to make your design great.
While making a floor plan of a new office it could be useful to apply some design elements such as furniture and office equipment. This diagram presents an office furniture objects that can be used for office interior design planning, or making office furniture and equipment layouts. This vector stencils library is supplied with ConceptDraw Office Layout Plans solution. It contains more then 30 vector objects of office interior for making office floor plans including an office space layout plans and furniture arrangement.
Picture: Interior Design. Office Layout Plan Design Element
Related Solution:
You need to draw a Functional Flow Block Diagram? You are an artist? Now it doesn't matter. With Block Diagrams solution from the Diagrams area for ConceptDraw Solution Park you don't need more to be an artist to design the Functional Flow Block Diagram of any complexity.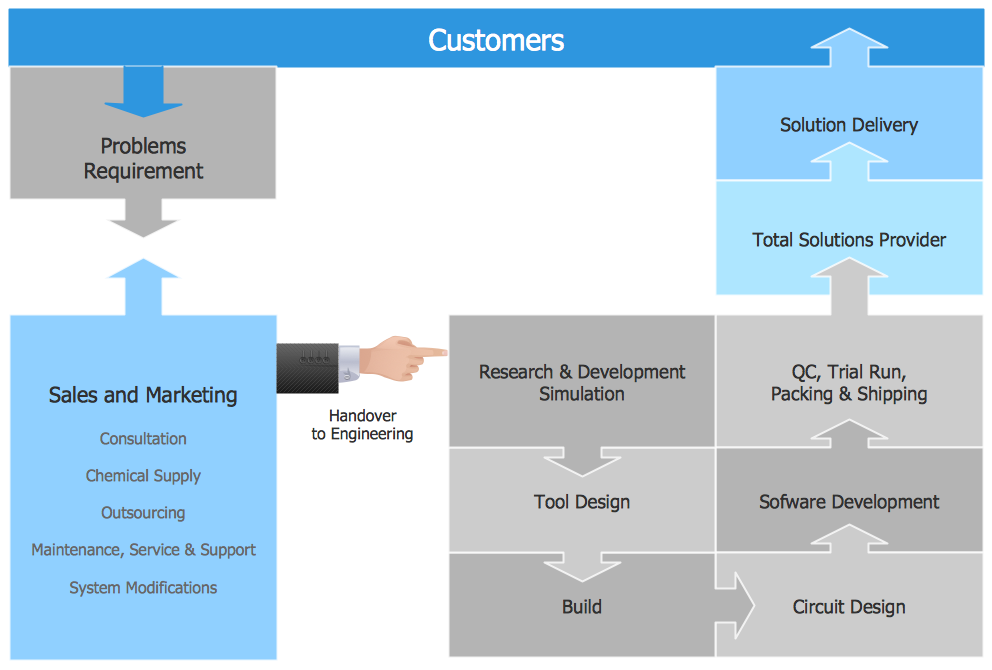
Picture: Functional Flow Block Diagram
Related Solution:
PDPC →
ConceptDraw DIAGRAM extended with Seven Management and Planning Tools Solution from the Management Area of ConceptDraw Solution Park is the best software for drawing all types of diagrams from the Seven Management and Planning Tools: Affinity Diagram, Relations Diagram, Prioritization Matrix, Root Cause Analysis Tree Diagram, Involvement Matrix, PERT Chart, and Risk Diagram (PDPC).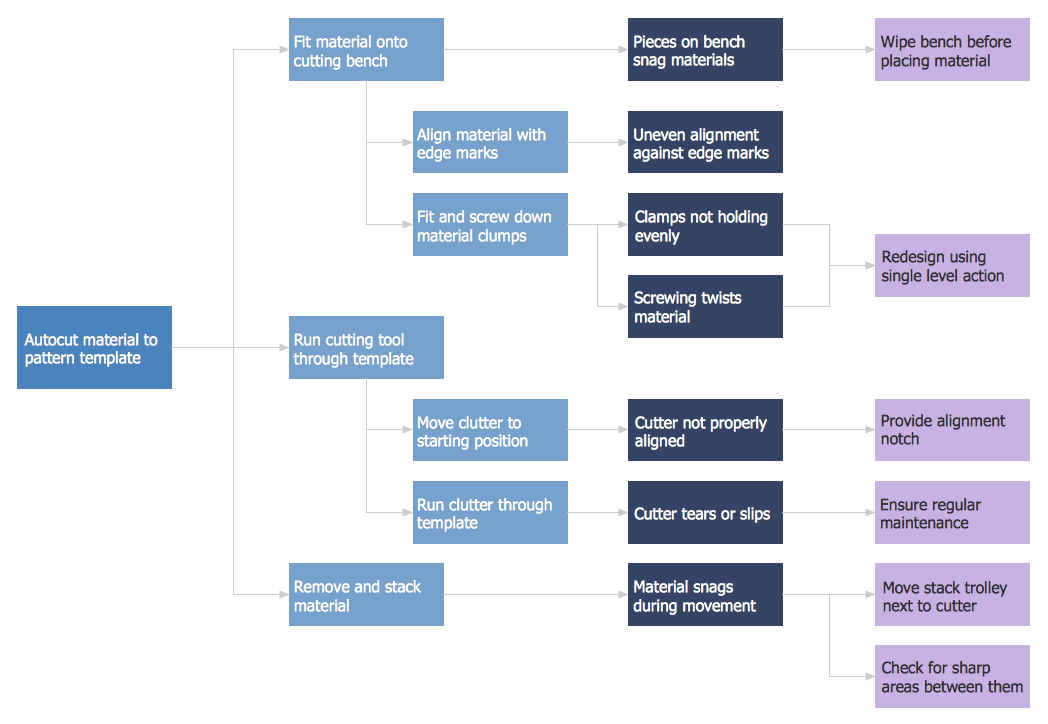
Picture: PDPC
Related Solution:
A full-featured project management solution with all the necessary functions right at your fingertips. Generates an extensive variety of reports on project and task statuses.
These videos provide a series of lessons that will enhance the understanding of all our users, from people just starting out with the software, through to expert users.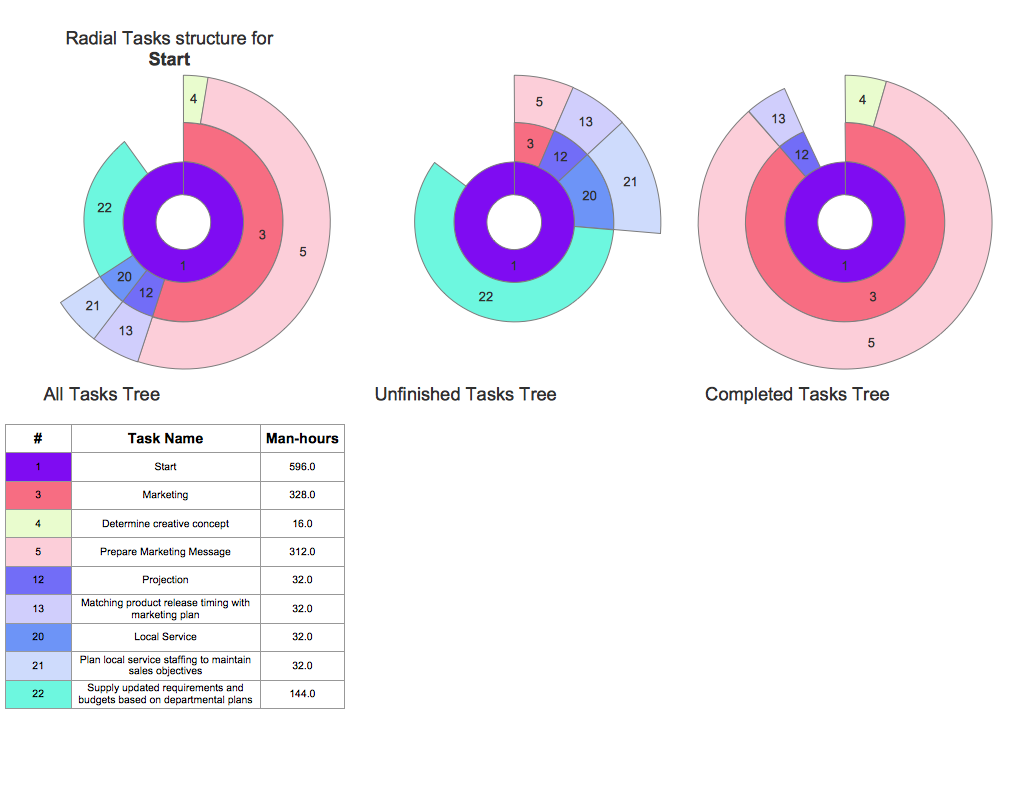
Picture: Project — Working With Tasks
ConceptDraw
PROJECT 15